Analysis of Water Soluble Vitamins (Thiamine, Nicotinamide and Pyridoxine) in Fortified Infant Food Products by Hplc
Narjis Naz1, Aiza Kashif1, Warda Sheikh1,Mateen Abbas2 and Abdul Muqeet Khan2
1Department of Chemistry, Lahore College for Women University, Lahore, Pakistan
2Department of Toxicology, University of Veterinary and Animal Sciences, Lahore, Pakistan
Corresponding author Email: narjis107@gmail.com
DOI : http://dx.doi.org/10.13005/ojc/320221
Article Received on :
Article Accepted on :
Article Published : 07 May 2016
The present study provides information about the levels of fortification of three water soluble vitamins i.e. thiamine (B1), nicotinamide (B3) and pyridoxine (B6) in a variety of foodstuffs include milk products and cereals for young children. Food fortification is key implement for improving health of the growing children. Twenty food samples were chosen for analysis because of their common utilization in the local area. The vitamin concentrations were determined by high performance liquid chromatography with C18 column with a gradient of mobile phase made of water and acetonitrile and a diode array detector set at 280 nm. The thiamine content investigated in the samples ranging from 268 µg/mL to 3 µg/ml, nicotinamide content was from 41 µg/ml to 1 µg/mL while the pyridoxine level was in between 412 µg/mL to 20 µg/mL. Detection and Quantification of compounds were attained by comparing their retention times with standard reference materials and on the basis the off peak area match against those of a standard. The method used, offer excellent linearity with r2 ≥ 0.994, detection limits, reproducibility, and analyte recovery.
KEYWORDS:Water soluble vitamins, Thiamine, Nicotinamide, Pyridoxine, High performance liquid chromatography, Food products
Download this article as:| Copy the following to cite this article: Naz N, Kashif A, Sheikh W, Abbas M, Khan A. M. Analysis of Water Soluble Vitamins (Thiamine, Nicotinamide and Pyridoxine) in Fortified Infant Food Products by Hplc. Orient J Chem 2016;32(2) |
| Copy the following to cite this URL: Naz N, Kashif A, Sheikh W, Abbas M, Khan A. M. Analysis of Water Soluble Vitamins (Thiamine, Nicotinamide and Pyridoxine) in Fortified Infant Food Products by Hplc. Orient J Chem 2016;32(2). Available from: http://www.orientjchem.org/?p=15905 |
Introduction
Vitamins counting B1 (thiamine), B3 (nicotinamide) and B6 (pyridoxine) is a diverse group of organic nutrients1, vital for sustaining good health, normal growth and for numerous physiological processes in humans especially in growing children2-3. These important constituents are supplied with a proper and balanced diet4. Even in developed countries, the vitamin deficiencies are amounting problem5. Foods that do not restrain ample amounts of vitamins result in vitamin deficiency-related profuse health problems6 such as deficiency of vitamins B6 have recently been connected to cardiovascular diseases7.The fructification and utilization of diverse dietary supplements and fortified food products are often recommended to overcome this dilemma curiously in infants 8. Precise information on vitamin content in food products consumed frequently is critical to assess for optimal nutrient intakes9-12. So, these food products require consistent quality control analysis to ensure the need and protection of consumers13. The objective of this study was to determine the quantity of dietary water soluble vitamins (thiamine, nicotinamide and pyridoxine) in the selected fortified food products in order to create awareness among the users. The detection of vitamins in food products was carried out by HPLC which is a very sensitive and selective technique for the quantitative and qualitative analysis.
Experimntal
Apparatus
Analysis was carried out by using high performance liquid chromatography instrument of Agilent 1100 series with a quaternary pump which includes vacuum degasser, Thermostatted column compartment and Thermostatted Autosampler. A diode array detector was employed for detection purpose. The reverse-phase column Zorbax SB-C18 4.6 × 75 mm was used for separation.
Chemicals/Reagents and solutions
HPLC grade solvents were employed throughout the analysis. Acetonitrile, methanol (Merck, UK) and glacial acetic acid were applied as supplied by the manufacturers. 1-heptane sulphonic acid, sodium salt monohydrate (C7H15NaO3S.H2O) – 96% pure was provided by Fluke Chemika. Vitamin B1 (Thiamin-Hydrochloride – 99%) and vitamin B6 (Pyridoxine – 98%) was purchased from BDH Biochemicals, England, whereas vitamin B3 (Nicotinamide – 98%) was from Alfa Aesar, UK.
Table 1: Statistical summary of data for HPLC Analysis of vitamins.
| PARAMETERS |
THIAMINE |
NICOTINAMIDE |
PYRIDOXINE |
| Mean |
52 |
10 |
126 |
| Median (min-max) |
36 (3-268) |
09 (1-41) |
63.5 (20-412) |
| Mode |
48 |
10 |
412 |
| Correlation co-efficient (r) |
0.997 |
0.997 |
0.998 |
| Standard Deviation |
66.01 |
10.22 |
133.44 |
| Intercept |
-1084.75 |
-330.508 |
-2160.87 |
| y = ax+b |
68983x – 1084.7 |
32034x – 330.51 |
91791x – 2160.9 |
| Slope |
68983 |
32033 |
91791 |
Twenty food products were purchased from the local market depending on their consumption for the infants and children’s. The food items bought included milk products, Juices, biscuits and powdered foods.
A buffer solution was prepared by taking 1 gram of 1-heptane sulphonic acid, sodium salt in a 1000 ml (1L) volumetric flask and dissolve with a minimum amount of water. 10 ml of glacial acetic acid was added and finally the volume was made up to the mark with water. The standard solutions were prepared by taking the proper amount of a compound (thiamin, nicotinamide and pyridoxine) and diluting it with the dilution medium that was prepared by mixing water, acetonitrile and glacial acetic acid in a ratio of 94 : 5 : 1.A series of dilutions, 100,200,300,400 and 500 µg/mL were made for all the three compounds from their respective 1000 µg/mL stock solutions. These concentrations of standards are prepared on the basis of the range required to contrive a calibration curve. The mobile phase was prepared by adding buffer and acetonitrile in a ratio of 90 : 10 v/v.
Table 2: The distribution of target compounds concentrations in the samples.
|
Thiamine (B1) (µg/mL) |
Nicotinamide(B3)(µg/mL) | Pyridoxine(B6)(µg/mL) | ||
|
S1 |
07 |
1.4 |
42 |
|
|
S2 |
36 |
01 |
52 |
|
|
S3 |
– |
13 |
40 |
|
|
S4 |
90 |
10 |
101 |
|
|
S5 |
03 |
11 |
412 |
|
|
S6 |
– |
22 |
75 |
|
|
S7 |
31 |
10 |
– |
|
|
S8 |
– |
41 |
82 |
|
|
S9 |
48 |
19 |
41 |
|
|
S10 |
268 |
03 |
– |
|
|
S11 |
56 |
10 |
211 |
|
|
S12 |
– |
– |
219 |
|
|
S13 |
16 |
1.8 |
47 |
|
|
S14 |
48 |
2.3 |
20 |
|
|
S15 |
14 |
– |
25 |
|
|
S16 |
89 |
09 |
120 |
|
|
S17 |
56 |
1.6 |
21 |
|
|
S18 |
11 |
– |
330 |
|
|
S19 |
08 |
1.4 |
23 |
|
|
S20 |
– |
09 |
412 |
|
Sample Preparation
The preparation of sample was done in three steps which are the following;
Buffer preparation
A buffer solution was prepared by taking 1 g of 1-heptane sulphonic acid sodium salt in a 1000 mL (1L) volumetric flask and dissolve with a minimum amount of water. 10 mL of glacial acetic acid was added and finally the volume was made up to the mark with water.
Extraction
All the samples were homogenized in a blender. 10 g of each sample were taken and dissolved in 100 mL of buffer. The solution was put in the shaker for 60 minutes for dissolution of the food materials.
Filtration
Afterwards the solution was filtered by whatmann® filter paper so any hard suspended food particles can be separated. The same solution was again filtered through a Millipore filter of 0.22 µm prior to the sample injection in the system.
Analytical Conditions For Hplc
Column = Zorbax SB-C18 4.6 × 75 mm
Particle size = 3.5 µm
Temperature of column compartment = 25 ºC
Sample Injection volume = 20 µL
Stop time = 20 minutes
Mobile phase = Buffer (90) : Acetonitrile (10) [v/v]
Flow rate = 1.2 mL/minute
Detector = Diode array
The Wavelength for detection = 280 nm
Vitamin Analysis By HPLC
The mobile phase was placed in the solvent reservoir and the pump was set at a flow rate 1.2 mL/min and allowed to pump for 10 to 15 minutes before the first analysis. The detector was switched on at least 30 minutes before analysis and was set at 280 nm wavelength. A 20 µL aliquot of sample solution was drawn into a clean HPLC injection syringe. The sample was injected and the detector system was activated at the same time. After approximately 15 to 20 seconds the injection valve is returned to the “load” position. The syringe and valve are rinsed or flushed with water for next sample analysis. The same method was used to inject the standard solutions and the rest of the samples. All the tests were performed in triplicate. The studied compounds were documented by using retention time that matches against those of the calibration standards while the quantification was achieved by means of peak area that match the standards.
Result and Discussion
Young children and babies are mainly at threat of intensifying micronutrient deficiencies14-15.Food fortification is important to avoid the problems associated with the deficiencies in which micronutrients are added to different food objects16-17.It is therefore of supreme meaning to know the sort and quantity of micronutrients added to food products especially for young children. So, the determination of dietary water-soluble vitamins is conceded using high performance liquid chromatography to the create awareness regarding the quantity of these vitamins in diverse food product among common people.
For calibration graphs, standard solutions of vitamins were made in the range of 100,200,300,400 and 500 µg /mL by the serial dilution to evaluate the linear dynamic range. The calibration curves for all the three compounds, i.e thiamine, nicotinamide and pyridoxine were linear with the regression co-efficient (R2) 0.996, 0.995 and 0.997 respectively as shown in Figures 1-3.
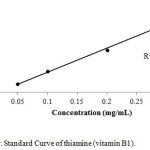 |
Figure 1: Standard Curve of thiamine (vitamin B1). Click here to View figure |
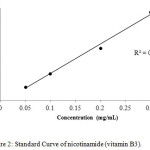 |
Figure 2: Standard Curve of nicotinamide (vitamin B3). Click here to View figure |
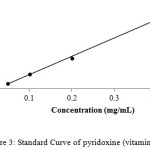 |
Figure 3: Standard Curve of pyridoxine (vitamin B6) |
The HPLC chromatograms were obtained when the standards and the samples were analyzed through the system (Figures 4-5). The studied compounds were recognized by using retention time that matches against those of the calibration standards while the quantification was achieved by means of peak area that match the standards. The retention times for the thiamine, pyridoxine and nicotinamide were 17.77,5.56 and 3.27 mins respectively. The nicotinamide was separated first, followed by pyridoxine and thiamine. Statistical summary of data for HPLC determination of vitamins is mentioned in Table 1.Sample 10 shows the highest thiamine content (268 µg/mL) and sample 5 shows the lowest (3 µg/mL). Nicotinamide contents are high in sample 8 (41 µg/mL) and low in sample 2 (1 µg/mL) while pyridoxine contents are higher in samples 5 and 20 (412 µg/mL) and lower in sample 14 (20 µg/mL). The distribution and comparison of these vitamins in the twenty samples of food products are shown in table 2 as well as in Figure 6.
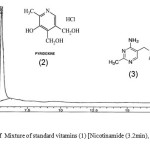 |
Figure 4: Chromatogram of Mixture of standard vitamins (1) [Nicotinamide (3.2min), (2) Pyridoxine (5.5min) and (3) Thiamine (17.7min). Click here to View figure |
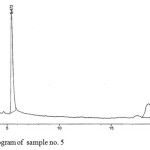 |
Figure 5: Chromatogram of sample no. 5 Click here to View figure |
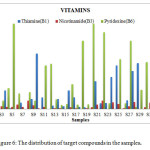 |
Figure 6: The distribution of target compounds in the samples. Click here to View figure |
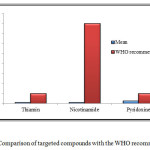 |
Figure 7: Comparison of targeted compounds with the WHO recommendation Click here to View figure |
The results obtained from the experiment are also compared with the World Health Organization’s (WHO) recommended daily intake. The comparison showed that the level of three vitamins in all the samples was below the recommended intake as shown in Figure 7. A proper check is required on these food products so that various diseases among the young children’s and babies can be avoided.
Conclusion
The level of three B-complex vitamins, Thiamine, Nicotinamide and Pyridoxine has been analyzed in a range of foodstuffs include milk products and cereals for young children and babies by High performance liquid chromatography because it enumerates the B-group vitamins concurrently in food items within a single run. All the investigated vitamins were separated completely under the 20 minutes run time. All the three vitamins studied in food product samples are below the recommended values and it is clinched that an appropriate check and balance is required to control and pledge the quality of these types of fortified food items for babies. Also a more accurate endorsement for the vitamins should be followed to terminate having such a large variation as seen in this study.
Acknowledgement
Authors are thankful to the University of Veterinary Sciences (UVAS) and Central Lab of Lahore college for Women University, Lahore for providing Laboratory facilities.
References
- Leporati, A., Catellani, D., Suman, M., Andreoli, R., Manini, P., Niessen, W.M.A. Anal Chim Acta.,2014,531, 87–95.
CrossRef - AL-Shaalan, N.M. Orient. J. Chem.,2015,31, 2343-2349.
CrossRef - Chuong, M.C., Prasad, D., LeDuc, B., Du, B.,Putcha, L. J Pharm Biomed Anal.,2011, 55, 1197–1200.
CrossRef - Lassen, A., Kall, M., Ovesen, L. Eur. Food Res. Technol. ,2002,215, 194-199.
CrossRef - Luo, X., Chen, B., Ding, L., Tang, F., Yao, S. Anal Chim Acta.,2006, 562, 185–189.
CrossRef - Lebiedzinska, L., Szefer, P. Food Chem., 2006,95, 116–122.
CrossRef - Gomez, A.Z., Garballo, A., Morales, J.C., Ayuso, L.E.G. J. Agr. Food Chem.,2006, 54, 4531-4536.
CrossRef - Sami, R., Li, Y., Qi, B., Wang, S., Zhang, Q., Han, F., Ma, Y., Jing, J., Jiang, L.J. Chem.2014., 1-6.
CrossRef - Flynn, A., Moreiras, O., Stehle, P., Fletcher, R.J., Muller, D.J., Rolland, V. Eur J Nutr., 2003,42, 118- 130.
CrossRef - Pedersen, H.B., Borg, S., Tauris, B., Holm, P.B. J Cereal Sci.,2007, 46, 308-326.
CrossRef - Herbers, K. J Plant Physiol.,2003, 160, 821-829.
CrossRef - Lynch, P.L.M., Young, I.S. J. Chromatogr. A.,2000, 881, 267-284.
CrossRef - Cubarsi, M.G., Sarraga, C., Clariana, M., Regueiro, G., Castellari, M. Meat Sci.2011, 87, 234-238.
CrossRef - El-Arab, A.E., Ali, M., Hussein, L.J. Food Comp. Anal.,2004, 17, 81-97.
CrossRef - Juraja, S., Trenerry, V.,Millar, R. J. Food Comp. Anal.,2003, 16, 93-106.
CrossRef - Ciulu, M., Solinas, S.,Floris, I., Panzanelli, I., Pilo, M.I., Piu, P.C., Spano, N., Sanna, G. Talanta.,2011, 83, 924–929.
CrossRef - Kumar, L.S., Thakur, M.S. Anal. Biochem., 2011, 418, 238–246.
CrossRef

This work is licensed under a Creative Commons Attribution 4.0 International License.
![]()
A New Edition of Web of Science
Journal Impact Factor
2022: 0.5
Five Year: 0.8
Journal is Indexed in

Cabells Whitelist
![]()


