Vibrational Spectroscopic and Thermodynamic Investigation of Poly (vinyl butyral)
DOI : http://dx.doi.org/10.13005/ojc/320148
Download this article as:
![]()
A detailed study was performed to investigate the normal modes of vibration and their dispersions in poly (vinyl butyral) by using Urey-Bradley force field and Wilson’s GF matrix method as modified by Higgs. It provides detailed interpretation of FTIR. Characteristic feature of dispersion curves such as regions of high density–of–states, repulsion and character mixing of dispersion modes are discussed. Predictive values of heat capacity as a function of temperature between 0-350 K have been evaluated.
KEYWORDS:Phonon dispersion; Vibrational dynamics; FTIR; Density-of-states; Heat capacity
Introduction
Poly (vinyl butyral) (PVB) is a resin usually used for applications that require strong binding, optical clarity, adhesion to many surfaces, toughness and flexibility [1-3]. The macroscopic physical properties of PVB are known to be intimately related to the polymer molecular dynamics, which is strongly influenced by water molecules in the polymer [4]. It was synthesized by condensation of poly (vinyl alcohol) with butyraldehyde. Preparation and characterization of PVB/grapheme nanocomposite was reported in a recent publication [5]. Worldwide 65 % of all PVB used in automotive application. With increasing material costs and demands for pollution control becoming more important there is an incentive to recycle plastic waste [6, 7]. In the case of PVB, there is a possibility to improve mechanical properties by mixing nano fillers with PVB. However, the optical and adhesive properties of PVB would not be to significantly change after mixing nano fillers. The decomposition mechanism of PVB is complex because PVB is a copolymer and decomposed products are very complicated [8]. The morphologies and structure of PVB/silica nano fibers were investigated by scanning electron microscopy (SEM), transmission electron microscopy (TEM), X-ray diffraction (XRD), thermo gravimetric analysis (TGA), FTIR, and energy dispersive spectrometer (EDS) [9]. The pyrolysis of PVB binder and other organic additives in thermoelectric green tapes are analyzed through differential thermal analysis, TGA and FTIR [10]. The possibility of using PVB film wastes as the adhesive component of cotton, adhesive sealing materials was reported by Artemenkoet. al. in 2008 [11]. In all these studies, to the best of our knowledge, no one has reported the vibrational dynamics and heat capacity of poly (vinyl butyral).
Vibrational spectroscopy is an important tool for probing conformation and conformationally sensitive modes of polymer. In general the IR absorption, Raman spectra &inelastic neutron scattering from polymeric systems are very complex and cannot be unraveled without the full knowledge of dispersion curves. Dispersion curves also give information on the extent of coupling along the chain and dependence of the frequency of a given mode upon the sequence length of ordered conformation. These curves also facilitate correlation of the microscopic behavior of a crystal with its macroscopic properties such as specific heat, enthalpy, and free energy. Thus the study of phonon dispersion in polymeric systems continues to be of topical importance. The present study reports a complete normal mode analysis of PVB using UBFF, phonon dispersion, and heat capacity as a function of temperature via the density-of-states derived from the dispersion curves. The experimental data of FTIR reported by previous authors have been used [12].
Theoretical Approach
Calculation of normal mode frequencies
The calculation of normal modes frequencies has been carried out according to the well-known Wilson’s GF [13] matrix method as modified by Higgs [14] for an infinite polymeric chain. It consists of writing the inverse kinetic energy matrix G and the potential energy matrix F in terms of internal coordinates. In the case of an infinite isolated helical polymer, there are infinite number internal coordinates that lead to G and F matrices of infinite order. Due to the screw symmetry of the polymer, a transformation similar to that given by Born and Von Karman can be performed that reduces the infinite problem to finite dimensions [15]. The vibrational secular equation, which gives normal modes frequencies and their dispersion as a function of phase angle, has the form:
│G(δ)F(δ) – λ(δ)I │= 0, 0≤ δ ≤ π …………..(1)
The vibrational frequencies n (d) (in cm-1) are related to the eigen values λ (δ) by the following relation:
l(d) = 4π2χ2v2 (d) …………..(2)
A plot of vi(δ) versus δ gives the dispersion curve for the ith mode.
Calculation of specific heat
Dispersion curves can be used to calculate the specific heat of a polymeric system. For a one-dimensional system the density-of-states function or the frequency distribution function expresses the way energy is distributed among the various branches of normal modes in the crystal, is calculated from the relation
g(ν) = ∑ (∂νj/∂δ)-1]νj(δ)=νj …………..(3)
The sum is over all the branches j. Considering a solid as an assembly of harmonic oscillators, the frequency distribution g(ν) is equivalent to a partition function. The constant volume heat capacity can be calculated using Debye’s relation
Cv= ∑ g(νj)KNA(hνj/KT)2[exp(hνj/KT)/{exp(hνj/KT)-1)}2] …………..(4)
with ∫g(νi)dνi = 1
The constant volume heat capacity Cv, given by above equation, can be converted into constant pressure heat capacity Cpusing the Nernst-Lindemann approximation [16, 17];
Cp – Cv = 3RA0 (Cp2T/ CvTm0) ………….(5)
Where A0 is a constant often of a universal value [3.9×10⁻³(K mol)/J] and Tm0 is the equilibrium melting temperature.
Results and Discussion
The structure of the PVB was determined by using the molecular modelling technique. On the basis of molecular modeling we accepted a planar zigzag geometry of PVB. The number of atoms per residue in PVB is 21 hence there would be a 21×3–4 = 59 normal modes of vibration. The vibrational frequencies were calculated for values of δ varying from 0 to π in steps of 0.5 .The optically active modes are those for which δ =π0, , π2 . The four zero frequencies correspond to the acoustic modes three representing translations along three axes and the fourth one is rotation around the chain axis. δ = 0 refers to the zone centre where δ = π is the zone
boundary. The assignments were made on the basis of potential energy distribution, band position band shape, band intensity and absorption scattering from molecules having similar group placed in similar environment. The Urey-Bradley force constants were initially transferred from the earlier work on molecule having similar groups and were further refined by using the least square method as described earlier [18].The final set of force constant for PVB is given in Table 1. Except for a couple of frequencies, most of them are fitted with in better than 1%. As we mentioned earlier the modes correspond to the = 0.0 are both Raman and IR active therefore the calculated frequencies are first fitted to observed frequencies for this phase. The experimental data of FTIR reported by previous authors has been used [12] for assignment.
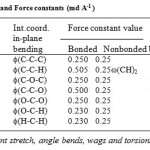 |
Table 1: Internal coordinates and Force constants (md A-1 ) Click here to View table |
Dispersion Curves
The dispersion curves below 1300 cm-1 are shown in Fig. 1(a). The modes above 1300 cm-1 are either non dispersive or their dispersion is less than 5 cm-1.
A very interesting feature of the dispersion curves is the convergence of various modes i.e. the modes which are separated by a large wave number at the zone center come very close at the zone boundary. This convergence arises mainly because of the closer sharing of potential energy in different measures by the various modes. For example, the two zone center modes calculated at 670 and 563 cm-1 are separated by 107 wave numbers at the zone center, but at the zone boundary they are separated by 14 wave numbers only. Similar features are observed in the pairs of modes, which appear at the zone center at 820 and 748 cm-1.
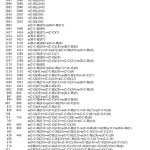 |
Table 2: Vibrational modes of PVB Click here to View table |
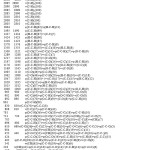 |
Table 3: Vibrational modes of PVB Click here to View table |
Another specific feature of the dispersion curves is the repulsion and mixing of the character of the various pairs of modes. The mixing of character depends on the strength of coupling; stronger coupling implies greater dispersion. The modes calculated at 177 and 129 cm-1 at the zone center show the repulsion at δ = 0.50. These two modes are separated by 48 wave numbers at the zone centre after this they repel each other and at the zone boundary they are again separated by 47 wave numbers.
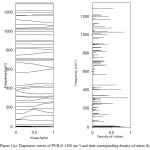 |
Figure 1(a): Dispersion curves of PVB (0-1300 cm-1) and their corresponding density-of-states (b) Click here to View figure |
Heat Capacity
The dispersion curves obtained for PVB were used to calculate the density-of-states and heat capacity as a function of temperature. The density-of-states are shown in Fig. 1(b). Predictive variation of heat capacity as a function of temperature is shown in Fig. 2.
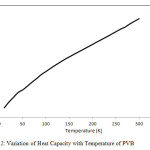 |
Figure 2: Variation of Heat Capacity with Temperature of PVB Click here to View figure |
Conclusion
The vibrational dynamics of PVB can be satisfactorily interpreted from the dispersion and dispersion profile of the normal modes of PVB as obtained by Higg’s method for infinite systems. Some of the internal symmetry dependent features such as attraction and exchange of character are also well understood.
References
- Blomstrom, T.P. “Concise Encyclopedia of Polymer Science and Engineering“, Edited by Kroschwitz, J. I. John Wiley & Sons, Inc., New York, 1990.
- Chen, W. J.; David, D. J.;MacKnight, W. J.; Karasz, F. E. Polymer2001, 42, 20, 8407-8414.
CrossRef - Alsaed, O.;Jalham, I.S., Jordan J. of Mech. and Indus. Eng.2012, 6,2, 127-133.
- Namgoong, H.; Kim, J.S.; Han, O.H.,J. Korean Mag. Res. Soc.2002, 6, 1-11.
- Fernandez,M.D.; Fernandez,M.J.; Hoces,P. J. Appl. Polym. Sci.2006, 102, 5007–5017.
CrossRef - Nakane,K.; Kurita,T.; Takahashi,O. Thermochem. Acta2004,35, 3, 219-222.
- Dhaliwal,A.K.; Hay,J.N.Thermochem. Acta2002,391, 245-255.
CrossRef - Seo, J. J.;Kuk, S. T.; Kim, K.J. J. of Power Sources1997, 69, 12, 61-68.
CrossRef - Chen,L.J.; Liao, J.D.; Lin,S.J.;Chaung,Y.J.;Fu,Y.S. Polymer2009,50, 15, 3516-3521.
CrossRef - Salam,A.; Mathews,R.D.; Robertson,H. J. Eur. Cer. Soc.2000, 20, 9, 1375-1383.
CrossRef - Artemenko,S.E.;Nikulina,L.P.; Gashnikova, G. Y. Fibre Chem.2008,40, 1, 48-49.
CrossRef - Tripathy, A.R.;Chen, W.; MacKnight,W. J. Polymer2003, 44, 1835-1842.
CrossRef - Wilson,E.B.;Decuis,J.C.; Cross,P. C. Molecular Vibrations: The theory of infrared and Raman vibrational spectra, Dover Publication, New York,1980.
- Higgs,P.W. Proc. Roy. Soc.1953, 220, 472-480.
CrossRef - Tondon,P.; Gupta,V.D.; Prasad,O.;Rastogi,S.; Gupta,V.P. J. Polym. Sci. B Polym. Phys. 1997, 35, 2281-2292.
CrossRef - Pan,R.;Verma,M.N.;Wunderlich,B. J. Therm. Annal. 1989, 35, 955-961.
CrossRef - Roles,K.A.; Xenopoulos,A.;Wunderlich,B. Biopolymers1993, 33, 753-755.
CrossRef - Ali,P.; Srivastava,S.; Ansari,S.I.; Gupta,V.D. Spectrochim. ActaA2013, 111,86-90.
CrossRef


![]()


