Structure-based virtual screening campaigns on curcuminoids as potent ligands for histone deacetylase-2
Enade Perdana Istyastono,1,* Arief Nurrochmad,2 and Nunung Yuniarti2
1Division of Drug Design and Discovery, Faculty of Pharmacy, UniversitasSanata Dharma, Campus 3 Paingan, Maguwohardjo, Depok, Sleman, Yogyakarta 55282, Indonesia; 2Departmentof Pharmacology and Clinical Pharmacy, Faculty of Pharmacy, UniversitasGadjahMada, Sleman, Yogyakarta 55281, Indonesia; Corresponding Author Email : enade@usd.ac.id
DOI : http://dx.doi.org/10.13005/ojc/320130
Article Received on :
Article Accepted on :
Article Published : 24 Feb 2016
Curcumin was reported to reverse the decrease in histone deacetylase-2 (HDAC2) protein expression in inflammatory diseases of the lung, including chronic obstructive pulmonary disease (COPD), severe asthma, and asthma in smokers. This indicates that curcumin is a potent ligand for HDAC2. The construction and retrospective validation of a structure-based virtual screening (SBVS) protocol to identify potent ligands for HDAC2 are presented in this article. The validated protocol was subsequently employed to screen curcumin and other curcuminoids found in Curcuma longa, i.e. demethoxy curcumin and bis-demethoxy curcumin, and to examine their interactions to HDAC2 in the atomic level. The results show that curcumin, demethoxy curcumin and bis-demethoxy curcumin are potent HDAC2 ligands. The insights from their interactions to HDAC2 resulted from the molecular docking simulations presented in this article could be employed further in the design and discovery potent HDAC2 ligands.
KEYWORDS:Curcuminoid; histone deacetylase-2 (HDAC2); structure-based virtual screening; molecular docking
Download this article as:| Copy the following to cite this article: Istyastono E. P, Nurrochmad A, Yuniarti N. Structure-based virtual screening campaigns on curcuminoids as potent ligands for histone deacetylase-2. Orient J Chem 2016;32(1). |
| Copy the following to cite this URL: Istyastono E. P, Nurrochmad A, Yuniarti N. Structure-based virtual screening campaigns on curcuminoids as potent ligands for histone deacetylase-2. Orient J Chem 2016;32(1). Available from: http://www.orientjchem.org/?p=14236 |
Introduction
Histone deacetylase 2 (HDAC2) plays an important role in physiological insulin signaling, the pathophysiology of the failing heart1, memory formation2, the pathophysiology of airway disease3, and also in the regulation of cell cycle and apoptosis4. Targeting HDAC2 to discover novel ligands for HDAC2 can therefore serve in the new therapeutic strategies against diabetes mellitus, myocardial injury, memory impairment, airway disease and cancer1–4. Inhibition of HDAC2 restored insulin signaling in both type 1 and type 2 diabetes mellitus by increasing GLUT4 translocation and augmenting basal and insulin-induced glucose up-take in skeletal muscle, returned to normal level of ventricular function by inhibit autophagy1, ameliorated reduced synapse number and learning impairment2, and repressed tumor cell growth and activated cellular apoptosis via p53 and Bax activation and Bcl2 suppression4. Meanwhile, HDAC2 activator such as curcumin restored corticosteroid sensitivity, suppressed inflammatory gene expression and treating corticosteroid-resistant inflammatory diseases of the lung, including COPD, severe asthma, and asthma in smokers3. Moreover the novel ligands can support as tools in the research to unravel the prominent role of HDAC2. A combined LBVS/SBVS approaches to design novel ligands for HDAC2 has been done and suggested 26 putative HDAC2 ligands5. Xiang et al.5 has suggested that an interaction with zinc ion and strong hydrogen bonds should be formed by the putative ligands.
In patients with chronic obstructive pulmonary disease (COPD) caused by oxidative stress as a result of cigarette smoking, curcumin was reported to reverse the decrease in histone deacetylase-2 (HDAC2) protein expression6. This indicates that curcumin is a potent ligand for HDAC23,6,7. Curcumin is an active compound found in turmeric (Curcuma longa), which co-exist with other curcuminoids demethoxy curcumin and bis-demethoxy curcumin8 (Figure 1). These compounds have been reported having similar pharmacological activities, i.e. as free radical scavenger, antioxidant, anti-inflammatory, anticarcinogenic, and neuroprotective agents9. Therefore, study on curcuminoids as ligands for HDAC2 could provide insights in the design of novel ligands for HDAC2 as well as unraveling other applications of curcuminoids in the prevention or therapy of memory impairment and airway disease.
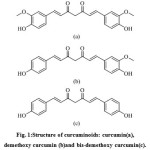 |
Figure 1: Structure of curcuminoids: curcumin(a), demethoxy curcumin (b)and bis-demethoxy curcumin(c). Click here to View figure |
Following the successful attempts of Xiang et al.5, the research presented in this article aimed to employ the systematic filtering on protein-ligand interaction fingerprints (PLIF)10,11 as suggested12,13 in SBVS campaigns to identify HDAC2 ligands among their decoys14. The SBVS campaigns employing PLANTS1.2 docking software15,16 as the backbone of the protocol17. The retrospectively validated protocol by using database of HDAC2 ligands and decoys provided by Mysinger et al.14 was subsequently employed to examine virtually if curcuminoids18,19 were potent ligands for HDAC2.
Materials and Methods
The crystal structure of human HDAC2 obtained from the protein data bank (PDB) with PDB id of 3MAX20 was used as the reference structure. Ligands (185) and decoys (10,300) for HDAC2 from DUD-e14 were employed as the test compounds to perform retrospective SBVS. All calculations and computational simulations were performed on a Linux (Ubuntu 12.04 LTS Precise Pangolin) machine with Intel® Core™ i5-4210U (1.7 GHz, 3M Cache) as the processors and 4 GB of RAM. Computational medicinal chemistry applications employed in this research were SPORES21, PLANTS1.215,16, BKChem (http://bkchem.zirael.org/), Open Babel 2.2.322, PyPLIF 0.1.110,11, and PyMOL 1.2r123. Statistical analysis was performed by using R 3.1.224.
The computational methods employed in this research mainly referred to previously published construction and retrospective validation of an SBVS protocol to identify potent ligands for adrenergic β2 receptor (ADRB2) by Istyastono and Setyaningsih13. The crystal structure of human HDAC2 with the PDB id of 3MAX20 was downloaded from the PDB website (http://www.rcsb.org/pdb/explore/explore.do?structureId=3max). Only chain A of the crystal structure was used further. The module splitpdb in SPORES was employed to split the receptor, the co-crystal ligand, and the water molecules discovered in the pdb file and to subsequently convert the files into mol2 files ready to be employed in molecular docking simulation employing PLANTS1.2 docking software. This procedure produced the virtual target protein.mol2 and the co-crystal ligand ligand_LLX400_0.mol 2.
Known HDAC2 active ligands and their decoys were downloaded in their SMILES format from DUD-e14. There were 185 ligands and 10,300 decoys downloaded and stored locally as actives_final.ism and decoys_final.ism. Each compound in the file was then subjected to Open Babel 2.2.3 conversion software to be converted in its three dimensional (3D) format at pH 7.4 as a mol2 file. The set types module in SPORES was subsequently employed to properly check and assign the mol2 file into a proper mol2 file ready to dock by using PLANTS1.2 docking software.
The methods were previously published in Istyastono and Setyaningsih13. All virtual screenings were performed by molecular docking program PLANTS1.2. These steps resulted in ChemPLP scores from PLANTS1.2 and Tc-PLIF values from PyPLIF for all docking poses. The docking pose with the best ChemPLP score or the best Tc-PLIF value was selected for each virtually screened compound. Virtual screening accuracies were determined in terms of the enrichment in True Positives rate (TP) reported at a false positive rate (FP) of 1% (EF1%) value. The EF1% values were calculated as follows: EF1% = ((%TP)/FP1%).
Systematic filtering was performed on resulted PLIFs. For every filtering result, a new rank based on the ChemPLP scores was created and the EF1% values were then calculated12,25,26. Only poses that have the interaction with the best EF1% value were selected for further cutoffs optimization. Cutoffs optimization was performed by gradually decreasing the Chem PLP score and increasing the Tc-PLIF value as the cutoffs. The cutoffs with the highest Matthews correlation coefficient (MCC) value with the enrichment factor value (EF = (%TP)/(%FP)) higher than or similar to the EF1% of the best bitstring filtered poses were selected for further SBVS campaigns.
Structures of curcumin, demethoxy curcumin, and bis-demethoxy curcumin (Figure 1) in two-dimension (2D) in mol file format were built in BKChem software and subsequently transformed to its SMILES format using Open Babel 2.2.3. Similar with the ligand preparation for the retrospective validation, each compound was then subjected to Open Babel 2.2.3 conversion software to be converted in its three dimensional (3D) format at pH 7.4 as a mol2 file and the settypes module in SPORES was subsequently employed to properly check and assign the mol2 file into a proper mol2 file ready to dock by using PLANTS1.2 docking software. The docking poses were then filtered based on the selected bitstring and cutoffs. Compounds with at least one pose that met the filtering requirements were considered as potent HDAC2 ligands. Visual inspections using PyMOL 1.2r123 on the poses were performed to investigate manually some representative docking poses to obtain insights on the HDAC2-ligands binding.
Results and Discussion
Construction and retrospective validation of the SBVS protocol to identify potent HDAC2 ligands
This approach aimed to develop an in silico tool to identify potent ligands for HDAC2. Potent ligand in this article means ligand with IC50, Ki or EC50 equal or less than 1 µM14. The developed SBVS protocol should have better EF value compared to the reference protocol14, which showed EF value of 20.0. The molecular docking simulations on 185 potent ligands and 10,300 decoys resulted in 31,455 docking poses which were subsequently subjected to PLIF identification and the Tc-PLIF values were calculated by comparing the PLIF to the interaction of co-crystal ligand N-(4-aminobiphenyl-3-yl)benzamide (ligand_LLX400_0.mol2) to HDAC2 (protein.mol2). Thence, each pose had two objective functions: ChemPLP score and Tc-PLIF value.
The default SBVS protocol resulted in EF1% values of 15.14 and 1.08 for data series ranked by ChemPLP score and Tc-PLIF, respectively. Based on the objective functions, one best pose was selected for every docked ligand and ranked, resulted in 2 data series: ChemPLP-ranked and Tc-PLIF-ranked datasets. Since the EF1% values were not better than the EF value of the reference protocol14, systematic filtering on PLIF which was previously reported by Istyastono and Setyaningsih13 to identify the most important interaction that significantly increased the SBVS quality was performed. The results showed that filtering on the interaction to bitstring #117 increased the EF1% from 15.14 to 24.31 for the ChemPLP-ranked dataset. On the other hand, the filtering on the interaction to bitstring #117 increased the EF1% from 1.08 to 19.46 for the Tc-PLIF-ranked dataset. This indicated that the hydrogen bond interaction to the carbonyl backbone of ALA141 as the hydrogen bond acceptor is an important interaction to identify potent ligands for HDAC2. Notably, the EF1% value after filtering on the interaction outperformed the EF value of the reference protocol. These results are summarized in Table 1. Nevertheless, very recently Istyastono et al.12 has suggested optimizing the quality of SBVS by making use of both objective functions ChemPLP and Tc-PLIF as the cutoffs.
Table 1: The predictive quality of the developed SBVS protocol
| SBVS protocol | EF1%whenthe objective functions used for ranking is | |
| ChemPLP | Tc-PLIF | |
| Default | 15.14 | 1.08 |
| With filtering on bitstring #117 | 24.31a) | 19.46 |
aThis value outperforms the EF value of the reference protocol (20.00) (Mysinger et al., 2012).
The cutoffs optimization discovered that by using ChemPLP score of -90.0 as the highest score and Tc-PLIF value of 0.50 as the lowest resulted in EF value of 30.19. The ChemPLP scores used in the optimization were -80.0 to -110.0, while the Tc-PLIF used in the optimization were 0.50 to 0.80. Based on the EF values, combined cutoffs were divided in to cutoffs resulted in EF value ≥ 24.31 and cutoffs resulted in EF value < 24.31 (Table 1 and Figure 2A). Subsequently, the cutoffs with the best MCC value among cutoffs resulted in EF value ≥ 24.31 were selected as the optimized cutoffs, i.e. ChemPLP score of -90.0 as the highest score and Tc-PLIF value of 0.50 as the lowest (Figures 2B and 2C). Based on the results of the retrospective validation, the SBVS protocol to identify potent HDAC2 developed in this research (Figure 3) was confidently employed to examine if curcumin, demethoxy curcumin and bis-demethoxy curcumin are potent ligands for HDAC2. Notably, the Tc-PLIF value is a reference dependent scoring function10,11, which could make the protocol too rigid with less predictive ability27. Employing the PLIF bitsrings as non-reference dependent predictors could lead to a better scoring function.
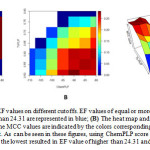 |
Figure 2: (A)The heat map of EF values on different cutoffs. EF values of equal or more than 24.31 are represented in red, while EF values of less than 24.31 are represented in blue; (B) The heat map and (C) the 3D plot of MCC values on different cutoffs. The MCC values are indicatedby the colorscorresponding to the heat colors on the right side of the map or the 3D plot. As can be seen in these figures, using ChemPLP score of -90.0 as the highest score and Tc-PLIF value of 0.50 as the lowest resulted in EF value of higher than 24.31 and the best MCC value (0.282).
|
Fig. 2: (A) The heat map of EF values on different cutoffs. EF values of equal or more than 24.31 are represented in red, while EF values of less than 24.31 are represented in blue; (B) The heat map and (C) the 3D plot of MCC values on different cutoffs. The MCC values are indicated by the colors corresponding to the heat colors on the right side of the map or the 3D plot. As can be seen in these figures, using ChemPLP score of -90.0 as the highest score and Tc-PLIF value of 0.50 as the lowest resulted in EF value of higher than 24.31 and the best MCC value (0.282).
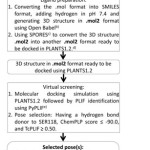 |
Figure 3: The retrospectively validated SBVS protocol to identify potent HDAC2. Click here to View figure |
Curcumin, demethoxy curcumin and bis-demethoxy curcumin as potent ligands for HDAC2
By employing the SBVS protocol developed previously (Figure 3), curcumin, demethoxy curcumin and bis-demethoxy curcumin (Figure 1) were tested. The results showed that all of them were potent ligands for HDAC2 with the number of selected poses were 6, 19, and 38 for curcumin, demethoxy curcumin and bis-demethoxy curcumin, respectively. All selected poses are presented in Figures 4, while the representative poses were presented in Figure 5. These results are in line with the results from3,6. Moreover, these results suggest that the curcuminoids-rich extract of Curcuma longa 8,9 could be developed or investigated further as potent HDAC2 ligands.
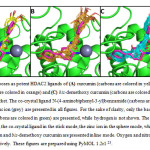 |
Figure 4: All selected poses as potent HDAC2 ligands of (A)curcumin (carbons are colored in yellow), (B)demethoxy curcumin (carbons are colored in orange)and (C)bis-demethoxy curcumin(carbons are colored in cyan) in the HDAC2 binding pocket. The co-crystal ligand N-(4-aminobiphenyl-3-yl)benzamide(carbons are colored in magenta) and the zinc ion (grey) are presented in all figures. For the sake of clarity, only the backbone atoms of the HDAC2 protein (carbons are colored in green) are presented, while hydrogen is not shown. The protein is presented in the cartoon mode, the co-crystal ligand in the stick mode, the zinc ion in the sphere mode, while curcumin, demethoxy curcumin and bis-demethoxy curcumin are presented in line mode. Oxygen and nitrogen are colored in red and blue, respectively. These figures are prepared using PyMOL 1.2r123.Click here to View figure |
Fig. 4: All selected poses as potent HDAC2 ligands of (A) curcumin (carbons are colored in yellow), (B) demethoxy curcumin (carbons are colored in orange) and (C) bis-demethoxy curcumin (carbons are colored in cyan) in the HDAC2 binding pocket. The co-crystal ligand N-(4-aminobiphenyl-3-yl)benzamide (carbons are colored in magenta) and the zinc ion (grey) are presented in all figures. For the sake of clarity, only the backbone atoms of the HDAC2 protein (carbons are colored in green) are presented, while hydrogen is not shown. The protein is presented in the cartoon mode, the co-crystal ligand in the stick mode, the zinc ion in the sphere mode, while curcumin, demethoxy curcumin and bis-demethoxy curcumin are presented in line mode. Oxygen and nitrogen are colored in red and blue, respectively. These figures are prepared using PyMOL 1.2r1 23.
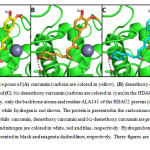 |
Figre 5: Representative poses of (A)curcumin (carbons are colored in yellow), (B)demethoxy curcumin (carbons are colored in orange) and (C)bis-demethoxy curcumin (carbons are colored in cyan) in the HDAC2 binding pocket. For the sake of clarity, only the backbone atoms and residue ALA141 of the HDAC2 protein (carbons are colored in green) are presented, while hydrogen is not shown. The protein is presented in the cartoon mode, the zinc ion (grey) in the sphere mode, while curcumin, demethoxy curcumin and bis-demethoxy curcumin are presented in stick mode. Hydrogen, oxygen and nitrogen are colored in white, red and blue, respectively. Hydrogen bonds and ion-dipole interactions are represented in black and magenta dashed lines, respectively. These figures are prepared using PyMOL 1.2r123. Click here to View figure |
Representative poses of (A) curcumin (carbons are colored in yellow), (B) demethoxy curcumin (carbons are colored in orange) and (C) bis-demethoxy curcumin (carbons are colored in cyan) in the HDAC2 binding pocket. For the sake of clarity, only the backbone atoms and residue ALA141 of the HDAC2 protein (carbons are colored in green) are presented, while hydrogen is not shown. The protein is presented in the cartoon mode, the zinc ion (grey) in the sphere mode, while curcumin, demethoxy curcumin and bis-demethoxy curcumin are presented in stick mode. Hydrogen, oxygen and nitrogen are colored in white, red and blue, respectively. Hydrogen bonds and ion-dipole interactions are represented in black and magenta dashed lines, respectively. These figures are prepared using PyMOL 1.2r1 23.
The potential of curcumin, demethoxy curcumin and bis-demethoxy curcumin as inhibitor for HDAC2 identified in this research enable them to be anticancer agents and to treat Alzheimer’s disease due to the overexpression of HDAC2 in solid tumors including colon cancer, lung cancer, cervical carcinoma, breast cancer, and kidney/cervix cancer and also in Alzheimer’s disease28,29. As HDAC inhibitors, these curcuminoids may alter phosphorylation30 and/or reduce the stability of tau protein31,32, resulting in decreased clinical features of tauopathies, a class of neurodegenerative diseases associated with the pathological aggregation of tau protein in the human brain. The best known of these illnesses is Alzheimer’s disease, wherein tau protein is deposited within neurons in the form of neurofibrillary tangles. These curcuminoids as HDAC inhibitors could also suppress cancer by inducing the G1/S phase arrest primarily through transcriptional changes in cell cycle regulatory genes33.
Conclusions
A retrospective validation on an SBVS protocol to identify potent HDAC2 ligands employing molecular docking using PLANTS1.2 and PLIF identification using PyPLIF resulted in EF value of 30.19. The protocol employed filtering on the hydrogen bond interaction to the carbonyl backbone of ALA141of HDAC2 and selecting only poses with ChemPLP score is similar or lower than -90.0 and Tc-PLIF value is similar or higher than 0.50 (Figure 3). The protocol was then employed to screen curcumin, demethoxy curcumin and bis-demethoxy curcumin and the results showed that all of them were potent ligands for HDAC2. The selected docking poses of curcumin, demethoxy curcumin and bis-demethoxy curcumin (Figures 4 and 5) could be used as insights in further design and discovery novel HDAC2 ligands.
Acknowledgments
This work was supported by the Ministry of Research Technology and Higher Education, the Government of the Indonesian Republic, through the Hibah Kompetensi 2015 Research Grant.
References
- Dinarello, C. A.; Fossati, G.; Mascagni, P. Mol. Med. 2011, 17, 333–352.
CrossRef - Guan, J.-S.; Haggarty, S. J.; Giacometti, E.; Dannenberg, J.-H.; Joseph, N.; Gao, J.; Nieland, T. J. F.; Zhou, Y.; Wang, X.; Mazitschek, R.; Bradner, J. E.; DePinho, R. A.; Jaenisch, R.; Tsai, L.-H. Nature 2009, 459, 55–60.
CrossRef - Barnes, P. J. Ther. Adv. Respir. Dis. 2009, 3, 235–243.
CrossRef - Jung, K. H.; Noh, J. H.; Kim, J. K.; Eun, J. W.; Bae, H. J.; Xie, H. J.; Chang, Y. G.; Kim, M. G.; Park, H.; Lee, J. Y.; Nam, S. W. J. Cell. Biochem. 2012, 113, 2167–2177.
CrossRef - Xiang, Y.; Hou, Z.; Zhang, Z. Chem. Biol. Drug Des. 2012, 79, 760–770.
CrossRef - Meja, K. K.; Rajendrasozhan, S.; Adenuga, D.; Biswas, S. K.; Sundar, I. K.; Spooner, G.; Marwick, J. a; Chakravarty, P.; Fletcher, D.; Whittaker, P.; Megson, I. L.; Kirkham, P. a; Rahman, I. Am. J. Respir. Cell Mol. Biol. 2008, 39, 312–323.
CrossRef - Segré, C. V; Chiocca, S. J. Biomed. Biotechnol. 2011, 2011, 690848.
- Yang, K.-Y.; Lin, L.-C.; Tseng, T.-Y.; Wang, S.-C.; Tsai, T.-H. J. Chromatogr. B Anal. Technol. Biomed. Life Sci. 2007, 853, 183–189.
CrossRef - Esatbeyoglu, T.; Huebbe, P.; Ernst, I. M. a; Chin, D.; Wagner, A. E.; Rimbach, G. Angew Chem Int Ed Engl. 2012, 51, 5308–5332.
CrossRef - Radifar, M.; Yuniarti, N.; Istyastono, E. P. Bioinformation 2013, 9, 325–328.
CrossRef - Radifar, M.; Yuniarti, N.; Istyastono, E. P. Indo. J. Chem. 2013, 13, 283–286.
CrossRef - Istyastono, E. P.; Kooistra, A. J.; Vischer, H.; Kuijer, M.; Roumen, L.; Nijmeijer, S.; Smits, R.; de Esch, I.; Leurs, R.; de Graaf, C. Med. Chem. Commun. 2015, 6, 1003–1017.
CrossRef - Istyastono, E. P.; Setyaningsih, D. Indones. J. Pharm. 2015, 26, 20–28.
CrossRef - Mysinger, M. M.; Carchia, M.; Irwin, J. J.; Shoichet, B. K. J. Med. Chem. 2012, 55, 6582–6594.
CrossRef - Korb, O.; Stützle, T.; Exner, T. E. Proc. IEEE Swarm Intell. Symp. 2007, 1, 115–134.
- Korb, O.; Stützle, T.; Exner, T. E. J. Chem. Inf. Model. 2009, 49, 84–96.
CrossRef - Setyaningsih, D.; Radifar, M.; Murti, Y. B.; Istyastono, E. P. Indones. J. Pharm. 2013, 24, 75–85.
- Appiah-Opong, R.; Commandeur, J. N. M.; Istyastono, E.; Bogaards, J. J.; Vermeulen, N. P. E. Xenobiotica 2009, 39, 302–311.
CrossRef - Appiah-Opong, R.; de Esch, I.; Commandeur, J. N. M.; Andarini, M.; Vermeulen, N. P. E. Eur. J. Med. Chem. 2008, 43, 1621–1631.
CrossRef - Bressi, J. C.; Jennings, A. J.; Skene, R.; Wu, Y.; Melkus, R.; De Jong, R.; O’Connell, S.; Grimshaw, C. E.; Navre, M.; Gangloff, A. R. Bioorg. Med. Chem. Lett. 2010, 20, 3142–3145.
CrossRef - Ten Brink, T.; Exner, T. E. J. Chem. Inf. Model. 2009, 49, 1535–1546.
CrossRef - O’Boyle, N. M.; Banck, M.; James, C. A.; Morley, C.; Vandermeersch, T.; Hutchison, G. R. J. Cheminform. 2011, 3, 33–47.
CrossRef - Lill, M. A.; Danielson, M. L. J. Comput. Aided Mol. Des. 2011, 25, 13–19.
CrossRef - R Development Core Team R: A Language and Environment for Statistical Computing; Vienna. http://www.r-project.org, 2008.
- De Graaf, C.; Kooistra, A. J.; Vischer, H. F.; Katritch, V.; Kuijer, M.; Shiroishi, M.; Iwata, S.; Shimamura, T.; Stevens, R. C.; de Esch, I. J. P.; Leurs, R. J. Med. Chem. 2011, 54, 8195–8206.
CrossRef - Sirci, F.; Istyastono, E. P.; Vischer, H. F.; Kooistra, A. J.; Nijmeijer, S.; Kuijer, M.; Wijtmans, M.; Mannhold, R.; Leurs, R.; de Esch, I. J. P.; de Graaf, C. J. Chem. Inf. Model. 2012, 52, 3308–3324.
CrossRef

This work is licensed under a Creative Commons Attribution 4.0 International License.
About The Author
![]()
A New Edition of Web of Science
Journal Impact Factor
2022: 0.5
Five Year: 0.8
Journal is Indexed in

Cabells Whitelist
![]()


