Spectrophotometric micro determination of silver(I) using meloxicam as a new analytical reagent
Reem Kamal Shah
Chemistry Department, College of Applied Sciences, Umm Al-Qura University, Makkah 21955, Saudi Arabia Corresponding author e-mail: reem.shah@hotmail.com
DOI : http://dx.doi.org/10.13005/ojc/320157
Article Received on :
Article Accepted on :
Article Published : 16 Feb 2016
A new chromogenic reagent, meloxicam was used for highly sensitive, selective and rapid method for the determination of silver based on the rapid reaction of silver(I) with meloxicam. In the presence acetate buffer solution of pH 4.6 and Triton X-100 as an optimum medium, meloxicam reacts with silver to form a yellow complex of molar ratio 1:1 (silver to meloxicam). The molar absorptivity of the formed complex was calculated to be 1.124 x 10⁴ L mol-1 cm-1 at 412 nm. Beer’s law is obeyed in the range of 1.0-15.0 µg mL-1. The relative standard deviation for six replicate samples of 7.0 µg mL-1 was 1.33%. The limits of detection and quantification were also calculated. Finally the repeatability, accuracy and the effect of interfering ions on the determination of silver ion were evaluated. The method was applied successfully for determination silver in some water samples.
KEYWORDS:Silver determination; Spectrophotometry; Meloxicam; Water samples
Download this article as:| Copy the following to cite this article: Shah R. K. Spectrophotometric micro determination of silver(I) using meloxicam as a new analytical reagent. Orient J Chem 2016;32(1). |
| Copy the following to cite this URL: Shah R. K. Spectrophotometric micro determination of silver(I) using meloxicam as a new analytical reagent. Orient J Chem 2016;32(1). Available from: http://www.orientjchem.org/?p=14003 |
Introduction
Silver and its compounds have an essential role in electronic and electrical applications, photographic film production, dental and pharmaceutical preparations, and manufacturing of fungicides [1,2]. Silver is also used for the preparation of high-strength and corrosion-resistance alloys and jewelry. These widespread applications have resulted in an increased silver content of the environmental samples. Silver can also enter the environment via industrial waters because it is often an impurity in zinc, copper, antimony, and arsenic ores [3]. On the other hand, silver has been recognized as a toxic element to many aquatic organisms even at low concentrations [4]. Moreover, Ag accumulation in the human body may lead to a permanent blue-gray skin discoloration (known as Argyria), and the threshold values regulating the maximum amount of silver permitted in different kinds of samples have been established in many countries [5]. Therefore, its trace determination in water and environmental samples is important. There are different methods for Ag(I) determination, like , high performance liquid chromatography (HPLC) [6], atomic absorption spectrometry (AAS) [7,8], kinetic [9–12], capillary zone electrophoresis (CZE) [13], flow injection analysis (FIA) [14], fluorimetric [15] and spectrophotometric [16-28]. Spectrophotometric methods still the most commonly used tools due to the common availability of instrumentation, the simplicity, speed and the accuracy of the technique still make spectrophotometric methods attractive. Meloxicam, 4-hydroxy-2-methyl-N(5-methyl-2-thiazolyl)-2-H-1,2-benzothiazine-3-carbox-amide -1,1-dioxide [Fig. 1] is a non-steroidal anti-inflammatory drug [29] which also acts as a green chelating agent for many metal ions. In this work, we used spectrophotometric method in order to determine silver for the first time using a meloxicam as a chelating agent. The advantages of the proposed method, with respect to previous ones, are that highly selective, fairly sensitive, simple, rapid, economical and may be safely applied to Ag(I) determination in different real samples in order to discover its possibilities for further applications.
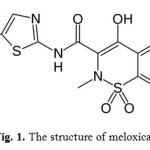 |
Figure 1: The structure of meloxicam |
Experimental
Apparatus
All the absorption spectra measurements were carried out using a SHIMADZO UV-VIS-NIR spectrophotometer (model UV-3600) with a scanning speed 400 nm/min, slit width 2.0 nm and equipped with 10 mm matched quartz cells. The pH of all solutions was adjusted to the required value using pH-meter (HANA instruments; model HI 8014).
Chemicals
All the chemical reagents employed were of analytical grade and the solutions were prepared with bidistilled water. A stock solution of 10-2 M silver(I) nitrate was prepared by weighing 0.157 g of (AgNO3, Merck) and dissolved in least amount of water and then completed in a 100 mL measuring flask to the mark with bidistilled water. A stock solution of 10-3 M of meloxicam (a gift from ADWC Company, Cairo) was prepared by dissolving 0.03517 g in absolute ethanol. Acetate buffer solutions were prepared according to the previous procedure of Gomori [30]
General procedure
An aliquot of Ag(I) standard solution was transferred to 10 mL measuring flask, 1.0 mL of 1 x 10⁻³ M meloxicam solution, 0.6 mL of and 1.0 mL acetate buffer solution of pH 4.6 were mixed well. The solution was completed up to the mark with bidistilled water and allowed to stand for 2 min. The absorbance of the formed yellow complex was measured at 412 nm. The blank solution was prepared by the same procedure without silver ion. All the measurements were performed at room temperature.
Determination of stoichiometry
The experiments for the determination of the stoichiometry of Ag(I)–meloxicam complex was conducted using a UV–Vis spectrometry. Job’s method of continuous variation was applied to establish the components ratio of the complexes. For this, different volumes (0.2, 0.4, 0.6, 0.8, 1.0, 1.2, 1.4, 1.6, 1.8, 2.0 mL) of 1.0 × 10⁻³ M Ag(I) was added to different volumes (1.8, 1.6, 1.4, 1.2, 1.0, 0.8, 0.6, 0.4, 0.2, 0 mL) of 1.0 × 10⁻³ M meloxicam at optimum conditions and diluted to the volume with bidistilled water in 10 mL standard volumetric flask. The absorbance was recorded at wavelength 412 nm and plotted against the mole fraction of Ag(I). The complex stoichiometry was found from the graphs obtained and the conditional stability constant of this complex was calculated using the Harvey and Manning method [31].
Determination of silver(I) in real samples
The studied method was successfully applied to the determination of silver(I) in some water samples. The water samples were analyzed as follows: 500 mL of water samples in a 1.0 L flask was concentrated to about 50 mL by heating on a hot plate. After that, addition of 10 mL of concentrated nitric acid and 2 mL of 30% hydrogen peroxide, then heat on hot plate till evaporated and emitting large white smoke. Add 2 mL of perchloric acid, Evaporated to near dryness. Dissolve the residue with 5 mL of 5% of nitric acid and transferred into a measuring flask. The obtained solution was neutralized with sodium hydroxide and analyzed by the developed method. The recovery of silver(I) by adding standard known amounts of silver(I) in water samples was carried out, applying the method of standard addition.
Results and Discussion
Absorption spectra
The absorption spectra of meloxicam-silver(I) complex in acetate buffer solution of pH 4.6 were recorded against a meloxicam and buffer as a blank. Meloxicam shows a maximum absorbance at 367 nm. The formation of silver(I)-meloxicam yellow complex was accompanied with bathochromic shift of λmax to 412 nm, [Fig. 2]. Optimization was carried out to variables permitting measurements in order to establish the most favorable conditions. These conditions were optimized by fixing all parameters to be constant and optimizing one at a time. The influence of each of the following variables on the reaction was tested.
Effect of pH
The most convenient solution pH on the spectrophotometric determination of the silver–meloxicam complex was investigated using different types of buffers (acetate 3.0 – 6.0), borate (8.0 – 10.0), phosphate (5.8 – 8.0) and universal (1.93 – 12.7). The suitable one was the acetate buffer. After mixing 1.0 mL of 1 x 10⁻³ M meloxicam solution, 0.6 mL of and 4.0 mL acetate buffer of different pH, Fig. 3 reflects highest absorbance value in extremely narrow pH range (3.3 – 5.0), outside which a decline in absorbance was observed. Obviously, pH 4.6 seems to be the appropriate choice as optimum pH. Also amount of buffer was investigated as shown in Fig. 4. 1.0 mL acetate buffer gave a highest absorbance, so all subsequent studies were performed using 1.0 mL buffer at pH 4.6.
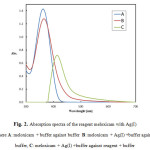 |
Figure 2: Absorption spectra of the reagent meloxicam with Ag(I) where A: meloxicam + buffer against buffer B: meloxicam + Ag(I) +buffer against buffer, C: meloxicam + Ag(I) +buffer against reagent + buffer Click here to View figure |
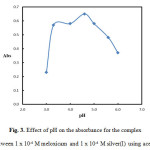 |
Figure 3: Effect of pH on the absorbance for the complex formed between 1 x 10⁻⁴ M meloxicam and 1 x 10⁻⁴ M silver(I) using acetate buffer Click here to View figure |
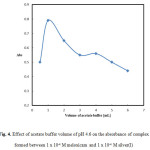 |
Figure 4: Effect of acetate buffer volume of pH 4.6 on the absorbance of complex formed between 1 x 10⁻⁴ M meloxicam and 1 x 10⁻⁴ M silver(I) Click here to View figure |
The concentration of meloxicam has a significant effect on the absorbance of the formed complex with Ag(I) which was investigated in the range of (0.5 – 6.0) x 10-4 M. It can be seen from Fig. 5 that the absorbance increases with an increase in the meloxicam concentration up to 2.0 x 10⁻⁴ M, above which it starts to decline. Therefore 2.0 x 10⁻⁴ M of meloxicam was selected for further work.
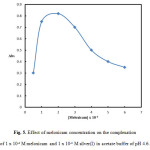 |
Figure 5: Effect of meloxicam concentration on the complexation of 1 x 10⁻⁴ M meloxicam and 1 x 10⁻⁴ M silver(I) in acetate buffer of pH 4.6. Click here to View figure |
Effect of the sequence of addition
It is important to study the sequence of the addition of species formed the studied complex by measuring the absorbance of the formed complex using different sequence of addition against the blank solution prepared by the same manner without including Ag(I). The best sequence was determined from the highest absorbance value. The optimal sequence of addition was found [R-M-B]. All the optimal conditions are shown in Table (1).
Table 1: Optimum condition parameters of Ag(I) complex with meloxicam.
| Parameters | Ag(I)-meloxicam |
| Type of buffer | Acetate |
| Working pH | 4.60 |
| Volume of buffer, mL | 1.00 |
| λmax(nm) | 412 |
| Conc of reagent, M | 1.0 × 10⁻³ |
| Sequence of addition | R-M-B |
| Optimum time (min) | 2 |
| Stoichiometric ratio (M:L) | (1:1) |
| Stability constanta | 11.22 |
R: Meloxicam, B: Buffer, M: Silver
a Stability constant using continuous variation method3.5. The stoichiometric ratio of the formed complex
The nature of the studied complex was determined at the above optimum conditions using continuous variation method. The Jop’s method indicated an inflection at a mole fraction of 0.5 of Ag(I) [Fig. 6] which gave evidence that the stoichiometric ratio of Ag(I)-meloxicam was (1:1). Moreover, the formation constant [log k], calculating using the Harvey and Manning equation, applying the data obtained from continuous variation method, was found to be 11.22.
Interference studies
The effect of foreign ions on the determination of 7.0 µg mL-1 of Ag(I) by the proposed method was examined. The tolerable amount of each ion was taken as an Ag: interference ratio that caused an error not exceeding ± 5% in the absorbance value of the solution. Results showed that about a 300–1500 fold excess of Br-, Ba2+, K+, Na+, acetate, Bi3+, Cr4+, Li+, Cl–, oxalate, Mn2+, Au3+, Ca2+, Mg2+, Sr2+, I–, Br–, W6+, U4+, S2-, Ni2+, F–, Fe2+, Al3+, Fe3+, Mo6+ Ti4+, Cr6+ and Zr4+ showed no interference. As given in Table 2, Th4+ and V5+ observed interfere resulting in positive errors, so these interferences should be eliminated using nitric acid.
![Fig. 6. Job’s plot for determination of stoichiometry of the reaction between silver(I) and meloxicam [Ag(I)]: 1 × 10⁻³ M; [meloxicam] 1 × 10⁻³ M; [Ag(I)] + [meloxicam]: 2.0 mL at pH 4.6 using acetate buffer.](http://www.orientjchem.org/wp-content/uploads/2016/02/Vol32_No1_Spec_Reem_Fig6-150x150.jpg) |
Figure 6: Job’s plot for determination of stoichiometry of the reaction between silver(I) and meloxicam [Ag(I)]: 1 × 10⁻³ M; [meloxicam] 1 × 10⁻³ M; [Ag(I)] + [meloxicam]: 2.0 mL at pH 4.6 using acetate buffer. Click here to View figure |
Table 2: Tolerance limits for the determination of 7.0 µg mL−1 of Ag(I) using meloxicam (accepted relative error ± 5.0%)
| Foreign ion added | The tolerance limit |
| Br–, Ba2+, K+, Na+, acetate, Bi3+ |
1500 |
| Cr4+, Li+, Cl–, oxalate, Mn2+ |
1200 |
| Au3+, Ca2+, Mg2+, Sr2+, I– , Br– |
850 |
| W6+, U4+, S2- |
650 |
| Ni2+, F–, Fe2+, Al3+, Fe3+, Mo6+ |
500 |
| Ti4+, Cr6+, Zr4+ |
300 |
| Cd2+, Pd2+, Zn2+, Cu2+ |
150 |
| Sn4+, Pb2+, Hg2+ |
100 |
| Cr3+, La3+,Co2+ |
50 |
| Se4+, Te4+, Zr4+ |
30 |
| Th4+, V(V), |
10 |
Analytical characteristics
Linearity
The calibration curve for the determination of Ag(I) by its reaction with meloxicam was constructed by plotting the absorbance as a function of the corresponding concentrations (µg mL-1). The regression equation for the results was A = 0.0692 C – 0.053 with a correlation coefficient R2 = 0.9992, where A is the absorbance at 412 nm, C is the concentration of silver(I) in μgmL−1 in the range of 1.0–15.0 μg mL−1. [Fig. 7]. The molar absorptivity (ε) was 1.124 x 10⁴. For more accurate analysis, Ringbom plot for optimum concentration range was obtained. Statistical analysis of the results obtained (Table 3), indicated that the proposed procedure was accurate and precise. The precision of the proposed method was determined by analyzing six replicate samples of standard silver(I) solution at one concentration level, . The assay gave satisfactory results; the relative standard deviation (RSD) was 1.33% indicating good reproducibility of the proposed methods. This precision level is adequate for the precision and routine analysis of silver(I) in quality control laboratories.
Sensitivity
Based on the IUPAC’s recommendation, the detection limit (LOD) for the proposed method was calculated using the following equation
LOD = 3.3s/k
where s is the standard deviation of replicate determination values under the same conditions as for the sample analysis in the absence of the silver(I) and k is the sensitivity, namely the slope of the calibration curve. In accordance with the formula, the detection limit was found to be 0.296 μgmL−1 which indicate high sensitivity of the proposed methods (Table 3).
The limit of quantification, LOQ, is defined as
LOQ = 10 s/k
According to Eqn, the limit of quantization was found to be 0.889 μg mL−1.
The percentage relative error was calculated using the following equation:
Error% = [(founded − added)/added] × 100
and was found to be 2.13%.
These above results indicating good accuracy and precision of the proposed method show that this method has good repeatability and reproducibility.
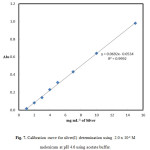 |
Figure 7: Calibration curve for silver(I) determination using 2.0 x 10⁻³ M meloxicam at pH 4.6 using acetate buffer. Click here to View figure |
Table 3: Cumulative data of the analytical conditions for spectrophotometric determination of Ag(I) with meloxicam
|
Parameters |
Ag(I) |
|
Meloxicam complex |
|
| Color | Yellow |
| pH | 4.60 |
| lmax (nm), A curve | 367 |
| lmax (nm), B curve | 375 |
| lmax (nm), C curve | 412 |
| Beer’s law range ,(mg/mL) | 1.0-15.0 |
| Ringbom range ,(mg/mL) | 2.5-12.5 |
| Detection limit, (mg mL-1) | 0.296 |
| Quantification limit, (mg mL-1) | 0.889 |
| Standard deviation (SD) | 0.0934 |
| Relative standard deviation (RSD), % | 1.33 |
| Variance x 10-3 | 8.72 |
| Error % | 2.13 |
| *Regression equation | |
| Slope (b) | 0.069 |
| Intercept (a) | 0.053 |
| Correlation coefficient | 0.9992 |
| Molar absorptivity,(L mol-1 cm-1) | 1.124×10⁴ |
| Sandell’s sensitivity (ng cm-2) | 14.49 |
| aConfidence limit | 7 ± 0.093 |
*A = a + b C, where C is the concentration of Ag(I) in mg L–1
a Confidence limit after six replicate measurements at 95% confidence level
Analytical application
Aiming to demonstrate the usefulness of the developed method, a set of samples containing different water samples was analyzed. The proposed method was successfully applied to the determination of silver(I) in tap and wastewater samples. The results were shown in Table 4. The recoveries are close to 100% and indicate that the proposed method was helpful for the determination of silver(I) in the real samples. The performance of the proposed method was determined by calculation of the student’s t-value (for accuracy) and F-test (for precision) applying a standard addition method. The mean values were obtained in a Student’s t– and F-tests at 95% confidence limits for five degrees of freedom. The results showed that the calculated values (Table 4) did not exceed the theoretical values reveal no significant difference in the performance of the two methods. A wider range of determination, higher accuracy, more stability and less time consuming, shows the advantage of the proposed method over other method.
Table 4: Analytical application of silver(I) in water samples using the proposed method
|
Sample |
Ag(I), µg mL-1 |
t– test |
F- value |
Recovery (%) ± RSD |
|
|
Added |
Found |
||||
|
Tape watera |
— |
1.91 |
— |
— |
— |
|
2 |
4.03 |
2.01 |
1.52 |
106 ± 1.07 |
|
|
4 |
5.89 |
1.45 |
2.58 |
99.5 ± 2.11 |
|
|
Waste waterb |
— |
11.82 |
— |
— |
— |
|
1 |
12.78 |
2.22 |
4.75 |
107 ± 1.77 |
|
|
2 |
13.88 |
0.82 |
1.87 |
103 ± 1.92 |
|
|
Well water |
— |
ND |
— |
— |
— |
|
3 |
3.03 |
1.69 |
3.45 |
101 ± 0.97 |
|
|
5 |
4.98 |
1.35 |
2.48 |
99.6 ± 1.13 |
|
a Obtained from the drinking water system of Makkah, Saudia.
b Waste water collected from processing of photographic films Lab.
bAt 95 % confidence level, the theoretical t– and F-values for five degree of freedom are 2.78 and 6.26, respectively.
ND: Not detected
Table 5: Comparison of reagents for spectrophotometric determination of silver
| Reagent |
pH/Surfactant |
λmax (nm) |
e x/104 Lmol−1cm−1 |
Linear range (µgmL−1) |
Ref.
|
| 2-(5-Chloro-2-pyridylazo)-5-diethylaminoaniline |
(pH 10), SDS |
530 |
6.7 | 0.05–1.2 | [32] |
| Thio-Michler’s ketone |
(pH 5), SDS |
535 |
9.4 | 0.0–0.4 | [33] |
| 2-(5-Bromo-2-pyridylazo)-5-dimethylaminophenol |
(pH 6.8-8), SDS |
542
|
6.5 | 0.1–1.6 | [34] |
| 2-(3,5-Dibromo-2-pyridylazo)-5-diethylaminophenol |
(pH 5), SDS |
565 |
6.4 | 0.02–0.48 | [35] |
| SulfochlorophenolazoThiorhodanine |
(pH 2.8), Triton X-100 |
540
|
39.4 | 0.0–/0.8 | [36] |
| Tetra-(4-chlorophenyl)-porphyrin |
(pH 10), TritonX-100 |
426
|
3.88 | 0.0–0.32 | [37] |
| Meloxicam |
pH 4.6,
|
412 |
1.124 | 1.0–15.0 | This work |
Conclusion
Although various techniques were reported for the determination of Ag(I), this work presents the appropriate simplicity, (Table 5) sensitivity and selectivity for the determination of trace amount of Ag(I). This method is useful owing to the sufficient capability for the determination of Ag(I) ion in various water samples. Apart from the high sensitivity, the procedure is very simple, fast and gains a low detection limit without any complicated equipment. Furthermore, the method benefits from an acceptable reproducibility, which is comparable with well-known confident methods.
References
- M. Grayson, Kirk-Othmer Encyclopedia of Chemical Technology, 21, John Wiley & Sons, New York, NY, USA, 3rd edition, 1980.
- I. C. Smith and B. L. Carson, Trace Metals in the Environment, Ann Arbor Science Publishers, Ann Arbor, Mich, USA, 1977,2,
- R. Soager, Metallic Raw Materials Dictionary, Bank Tobel, Zurich, Switzerland, 1984.
- J. L. Manzoori, H. Abdolmohammad-Zadeh, and M. Amjadi, Ultra-trace determination of silver in water samples by electrothermal atomic absorption spectrometry after preconcentration with a ligand-less cloud point extraction methodology, Journal of Hazardous Materials.2007,144,-2,458–463,
- M. Resano, M. Aramend´ıa, E. Garc´ıa-Ruiz, C. Crespo, and M. A. Belarra, Solid sampling-graphite furnace atomic absorption spectrometry for the direct determination of silver at trace and ultratrace levels, Analytica Chimica Acta, 2006,571,1,142– 149.
CrossRef - L. Wang, Q. Hu, G. Yang, J. Yin, Z. Yuan, Online solid phase extraction reverse phase liquid chromatographic determination of lead, cadmium, silver and mercury in water, Fenxi Huaxue. (2004), 32,421–427 (in Chinese).
- G. Chakrapani, P.L. Mahanta, D.S.R. Murty, B. Gomathy, Preconcentration of traces of gold, silver and palladium on activated carbon and its determination in geological samples by flame AAS after wet ashing, Talanta.(2001),53,1139–1147.
CrossRef - J. Pandey, P. Sudhakar, V.J. Koshy, Determination of silver at submicrogram levels by absorption spectrophotometry, Ind. J. Chem. Tech. (2003),10,295–297.
- G.M. Mastoi, A.A. Khaskheli, I.A. Ansari, M.Y. Khuhawar, Kinetic spectrophotometric determination of silver(I) by the catalytic effect on the oxidation of chromotropic acid by bromate, Paks. J. Chem. Soc.(1997),19, 273–278.
- Yu.I. Grosse, A.D. Miller, Highly sensitive kinetic method for determination of silver in rocks, Metody Anal. Redkometal. Miner. Rud. Gorn. Porod.(1971), 2, 52–64.
- V.K. Reddy, A. Chennaiah, P.R. Reddy, T.S. Reddy, Kinetic-photometric determination of silver(I) based on its catalytic effect on reaction between potassium ferrocyanide and 2-hydroxy-4-metoxybenzophenone thioemicarbazone, Chem Anal. (2003), 48, 733–740.
- Yu.I. Grosse, A.D. Miller, Kinetic determination of silver in natural material, Zavodskaya Lab.(1974),40,262––263.
- M. Aguilar, A. Farran, M. Martinez, Determination of gold (I) and silver (I) cyanide in ores by capillary zone electrophoresis, J. Chromatogr.(1993),635, 127–131.
CrossRef - K. Fujimura, T. Odake, H. Takiguchi, N. Watanabe, T. Sawada, Flow injection spectrophotometric determination of sub mg/dm3 silver in a strongly acidic solution containing concentrated copper(II) using a pyridylazo reagent, Anal. Sci.(2011), 27, 1197–1201.
CrossRef - V. Kabasakalis, Fluorimetric determination of silver by brilliant green in aqueous systems and its application in photographic fixing solutions, Anal. Lett. (1994), 27,2789–2798.
CrossRef - P. Nagaraja, M.S.H. Kumar, H.S. Yathirajan, Silver enhanced reduction of 2,3,5-triphenyl-2H-tetrazolium by semicarbazide hydrochloride (SHC) for the spectrophotometric determination of traces silver(I), Anal. Sci.(2002),18, 815–820.
CrossRef - C. Ivanova, S. Popova, Spectrophotometric determination of silver with brompyrogallol red (BPR) and 1,10-phenantroline in the presence of gelatin, J. Univ. Chem.Tech. Met (2002), 37, 33–38.
- H.W. Gao, L. Wang, M. Tao, Primary-secondary wavelength spectrophotometric determination of trace amounts of silver in waste water with 2,4-dibromo-6-carboxy-benzendiazoaminoazobenzene (DBCBAAB), Paks. J. Chem. Soc.(2000),22, 275–280.
- S.G. Kawatkar, P.S. Manol, A simple and sensitive spectrophotometric method for determination of silver(I) with resacetophenone guanylhydrazone (RAG), Acta Cie. Ind.(1998), 24, 167–169.
- S. Tsiouris, F. Aravanopoulos, I. Papadoyannis, M. Sofoniou, N. Polyzopoulos, M. Christodoulou, V. Samanidou, G. Zachariadis, H.Constantinidou, Soil silver content of agricultural areas subjected to cloud seeding with AgI, Frez. Env. Bull.(2002),11, 697–702.
- H.W. Gao, Reanalysis of silver chelate solution and determination of trace amounts of silver in waste water, Asian J. Chem.(1999),11,740–745.
- F. Salinas, A. Espinosa-Mansilla, A.P. Lopez de Alba, Extraction-spectrophotometric determination of silver in ores, electronic flow- solders and white metals with 2-carboxybenzaldehyde thiosemicarbazone (2CBTSC), Analyst.(1995),120, 2857–2860
CrossRef - B.G., R.P., Singh, Determination of silver, platinum or gold and copper in ternary mixtures with potassium thiocarbonate, Analyst.(1982), 29, 85
- Z. Fulong, Z. Hang, Different approaches to the determination of silver ion at low levels by flow injection analysis, Anal. Chem. Acta.(1988),15,206-213.
- N.N. Ischenko, L.I. Ganago, I.F. Ivanova, Flotation-spectrophotometric determination of silver, J. Anal. Chem.(1997), 52, 768–769
- X.J. Guo, Q.L. Deng, B. Peng, J.Z. Gao, J.W. Kang, Catalytic spectrophotometric determination of ultratrace amounts of silver with solubilizing effect on nonionic surfacant, Chin. J. Chem. (2002), 20, 39–44
CrossRef - C. H. Shul and L. Chang, Spectrophotometric determination of silver with 2-(3,5-dibromo-2-pyridylazo)-5-diethyl-aminophenol in the presence of anionic surfactant, Talanta,(1982), 29, 85- 88.
CrossRef - M. A. Kassem, Development of a cloud-point extraction method for spectrophotometric nano determination of silver in real samples, Anal. Meth., (2015), 7, 6747-6754.
CrossRef - Pairet M., Van-Ryn J., Schierok H., Mauz A.,Trummlitz G., Engelhardt G., Differential inhibition of cyclooxygenases-1 and -2 by meloxicam and its 4′-isomer, Inflammatory Res., , (1998), 47, 270
CrossRef - G. Gomori, “Mothods in Enzymology”,(1955), 1, 141.
CrossRef - A.E. Harvey, D.L. Manning, “Spectrophotometric Methods of establishing empirical formulas of colored complexes in solution”, J. Am. Chem. Soc., (1950), 72, 4488.
CrossRef - G. Xue, Huangjin Chin. J. Gold ,(1996), 17, 43-48.
- K. M Liao, Fenxi Shiyanshi Chin. J. Anal. Lab.(1985) ,4, 62-67.
- L. H. Chai and X. J. Zhang, Fudan Daxue Xuebao, Fudan Univ. Acta,(1992) 31, 115-120.
- Y. L. Yang, G. Y. Yang, J. Y. Yin and Q. H. Xu, Lihua Jianyan Huaxue Fence, Chin. J. Phys. Chem. Anal.,(2000), 36, 157.
- S. L Cheng, Fenxi Huaxue Chin. J. Anal. Chem.,(1992),20, 7.
- Z. Y. Wang and X. Q. Zhu, Yejin Fenxi, Chin. J. Metall. Anal.,(1998),18, 46.

This work is licensed under a Creative Commons Attribution 4.0 International License.
![]()
A New Edition of Web of Science
Journal Impact Factor
2022: 0.5
Five Year: 0.8
Journal is Indexed in

Cabells Whitelist
![]()


