Spectrophotometric Estimation of Drugs Using N-Bromo Succinamide and Indigo Caramine Couple
M. Sasikala1, P. Priyanka2, T. Vinod Kumar1 and G. Venkateshwarlu1*
1Department of Chemistry, University College of Science, Osmania University, Hyderabad-500007, India.
2Department of Chemistry, Jaya Prakash Narayan College of Engineering, Mahabubnagar-509001, India.
Corresponding author E-mail: venkateshwarlugoud@yahoo.com
DOI : http://dx.doi.org/10.13005/ojc/320170
Article Received on :
Article Accepted on :
Article Published : 02 Mar 2016
Simple, specific, accurate and precise UV–visible spectrophotometric methods have been developed for the estimation of five drugs viz., Dobutamine hydrochloride (DOB), Domperidone(DOM), Duloxetine hydrochloride(DUL), Phenylephrine(PHE) and Trimetazidine(TRM). These methods involve the addition of a known excess of NBS to the drugs in acid medium followed by estimation of residual NBS by reacting with a fixed amount of Indigo Caramine and measuring the absorbance at 520nm. Beer’s law is obeyed in the concentration range of 0.6-4.2, 0.4-2.8, 0.3-2.1, 0.8-5.6 and 0.4-2.8 µg mL-1 for DOB, DOM, DUL, PHE and TRM respectively. Different variables affecting the reaction were studied and optimized. The proposed methods were applied successfully to the determination of the examined drugs in pure and pharmaceutical dosage forms with good accuracy and precision. The proposed methods were found to be successful for the estimation of these drugs in bulk and their formulations. The results of analysis have been validated statistically for linearity, accuracy, precision, LOD and LOQ.
KEYWORDS:Trimetazidine, Domperidone; Dobutamine hydrochloride; Phenylephrine; Duloxetine hydrochloride; NBS-Indigo Caramine; UV-visible spectrophotometry; Validation
Download this article as:| Copy the following to cite this article: Sasikala M, Priyanka P, Kumar T. V, Venkateshwarlu G. Spectrophotometric Estimation of Drugs Using N-Bromo Succinamide and Indigo Caramine Couple. Orient J Chem 2016;32(1). |
| Copy the following to cite this URL: Sasikala M, Priyanka P, Kumar T. V, Venkateshwarlu G. Spectrophotometric Estimation of Drugs Using N-Bromo Succinamide and Indigo Caramine Couple. Orient J Chem 2016;32(1). Available from: http://www.orientjchem.org/?p=14522 |
Introduction
Dobutamine
(DOB) (Fig.1a) Dobutamine hydrochloride, chemically: 4-(2-((1-methyl-3-(4-hydroxybenzene)propyl)amido)ethyl)-1,2-di-hydroxybenzen hydrochloric salt and it is indicated for coronary heart disease[1]. There are various analytical methods for the assay of dobutamine, Spectrophotometric analysis [2-6], HPLC [7], Spectrofluorimetry [8], Chromatography [9] and Voltametry [10].
Domperidone
(DOM) (Fig. 1b) is chemically known as 5-chloro-1-(1-[3-92-oxo-2,3-dihydro-1H-benzo[d]imidazol-1-yl)propyl]piperidin-4-yl)-1H-benzo[d]imidazol-2(3H)-one. It is indicated for nausea and vomiting[11]. Several techniques have been reported in the literature for the determination of DOM in pharmaceuticals and in biological samples include HPLC[12-15], Spectrophotometry[16], UPLC[17] and Cyclic Voltametry[18].
Duloxetine
(DUL) (Fig.1c) is chemically known as (+)-(S)-N-Methyl-3-(naphthalen-1-yloxy)-3-(thiophen-2-yl) propan-1-amine. It is used in the treatment of various anxiety disorders[19]. Several techniques have been reported in the literature for the determination of DUL in pharmaceuticals and in biological samples include HPLC [20-24], UPLC [25], Visible Spectrophotometry [26] UV-Sectrohotometry[27,28] and Spectrofluorimetry [29].
Phenylephrine Hydrochloride
(PHE) (Fig.1d) chemically (R)-1-(3-hydroxyphenyl)-2-methylaminoethanol hydrochloride is a direct sympathomimetic agent, a selective α1 agonist[30], causing vasoconstriction. Literature review reveals that a few methods have been published for analysis of PHE in the bulk form and in pharmaceutical preparations. Methods available include Spectrophotometry [31- 38], HPLC [39-41] and liquid chromatography [42].
Trimetazidine
(TRM) (Fig.1e) is chemically known as 1-[(2,3,4-Trimethoxyphenyl) methyl] piperazine dihydrochloride and is a coronary vasodilator drug[43] and also have an antioxidant effect. Several methods have been reported for the determination of Trimetazidine dihydrochloride. These methods include spectrophotometry [44-49], HPLC [50,51], voltametry [52].
A comparision of various techniques used for estimation of above drugs in terms of sensitivity and reproducibility are presented in Table-1.
Table 1 : Comparision of various techniques used for essay of the drugs (range of parameters in general)
| Method | Linearity range | Sensitivity | %Recovery | Limitations |
| HPLCTRMZPHEDOMDUL
DOB |
400–2400 ng.0.4-2.4μg mL-160-240 μgmL-10.25-4 μgmL-1.
50–2000 ngmL-1
|
0.00111753107.14678590.9994
0.99 |
98 – 100%100.56%101.67%101.2%
98% |
Costly equipment |
| Electrochemical Methods | 0.05-1000 μg | ———- | 98.65-100.76 | Low sensitivity |
| Spectrofluorimetrty | 0.02-30μg mL-1 | ——— | 98.17-99.17 | Rare equipment |
| Direct SpectrophotometryTRMZ
PHE DOM DUL DOB |
4-20μg mL-1
12-60 μg mL-1 5-30 μg mL-1 2.5-25.0 μg mL-1 0.35-2.45 μg mL-1
|
0.0294
0.007 0.0465 0.0523 0.375
|
98.9%-99.7% 99.95-100.64% 99.05% 99.96 ± 0.15 99.33±1.43
|
Involve UV-light |
Thorough survey of literature revealed that simple spectrophotometric methods based on oxidation with NBS are not yet reported for the above drugs. In this communication we present simple, accurate, precise methods for the quantification of above drugs.
Materials and Methods
The pharmaceutical grade drugs were supplied by Aurbindo Pharmaceuticals and Heterodrugs Pvt. Ltd, Hyderabad. IndigoCarmine, HCl were purchased from S.D fine chem. Pvt. Ltd, Mumbai, India. N-Bromosuccinamide (NBS) is purchased from SRL chemicals, Mumbai, India. Whatman filter paper no.42 was used for filtration purpose. All the reagents used were of analytical-reagent grade and distilled water was used throughout the investigation. Tablets were purchased from the local market.
All absorbance measurements were recorded on Elico 210 double beam spectrophotometer, Systronics-117 and ELICO-159 UV-VIS single beam spectrophotometers using quartz cells of 10 mm path length. A high precision Analytical (Dhona 200 single pan electrical) balance was used for weighing the samples
Preparation of Standard stock solutions
N-Bromosuccinamide (NBS): An approximately 0.01M solution was prepared by dissolving 0.1779 g of NBS in 100 ml distilled water. It is diluted to get 124μg mL-1 of NBS.
Indigo Carmine: Stock solution was prepared by dissolving 0.0484g of Indigo Carmine in 100 ml distilled water. From this stock solution, 353μg mL-1 test solution was prepared.
Hydrochloric acid solution: Conc. HCl is diluted appropriately with distilled water to get 1M HCl solution.
Drugs
Standard solutions of drugs were prepared by dissolving accurately weighed powder of the tablets and powder equivalent 50 mg of pure drug in 20ml of water and diluted to the mark in 100 ml calibrated volumetric flasks. The stock solutions of DOB, DOM, DUL, PHE, and TRM were diluted with water to obtain 0.6-4.2 μg mL-1, 0.4-2.8 μg mL-1, 0.3-2.1 μg mL-1 , 0.8-5.6 μg mL-1 and 0.4-2.8μg mL-1respectively.
Method Development
Aliquots of pure drug solution (1.0-7.0ml) were transferred into a series of 10ml calibrated flasks. To each flask 1.0ml of 1M HCl acid was added followed by 1.0ml of NBS solution. The flasks are stoppered and contents were mixed and the flasks are set aside for 15 min under occasional shaking. Finally, 1.0 ml of Indigo Carmine solution was added to each flask and the volume was adjusted to the mark with water and mixed well. The absorbance of each solution was measured at 520nm after 5 min.
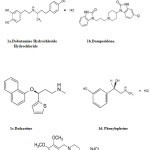 |
Figure 1: Structure of drugs |
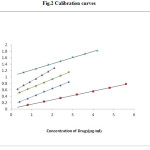 |
Figure 2: Calibration curves |
Construction of calibration curve
Six replicate experiments were performed and the relative response i.e., absorbance / concentration (μg mL-1) was calculated. The points falling between 95% and 105% of average only are considered for the construction of calibration. A standard graph was prepared by plotting the absorbance versus the concentration of drugs (Fig.2). The standard deviation of six residual intercepts of the plots is used for calculating LOD and LOQ. Beer’s Law is obeyed and calibration curves for DOB, DOM, DUL, PHE, and TRM over a concentration range of 0.6-4.2 μg mL-1, 0.4-2.8 μg mL-1, 0.3-2.1 μg mL-1 , 0.8-5.6 μg mL-1 and 0.4-2.8μg mL-1respectively, were plotted. The spectral and statistical characteristics are recorded in Table-2.
Analysis of Drugs in the Pure form for Precision and Accuracy Studies
As mentioned, six replicate experiments were performed to ascertain the precision of the methods. The results differed only in a small range of experimental errors.
The accuracy of the proposed methods was evaluated by percentage recovery studies on the drugs. The %RSD was ≥2, showing high degree of accuracy of the proposed methods. The effect of excipients on the methods developed was also tested and found that excepients do not interfere much. The results of the method lie within the prescribed limits showing that method is free from interference from excipients. The results of the recovery studies together with other statistical parameters are reported in Table-3.
Analysis of commercial Dosage forms
A quantity of finely ground powder of tablet of equivalent to 50 mg of drug DOB(Dobusol), DOM(Domitab), DUL(Dumax), PHE(Dolgen corp) and TRM (Trivedon), were accurately weighed and taken in 60 ml distilled water in 100 ml volumetric flask and left for 10 min for complete dispersion and then filtered through Whatman filter paper. First 10 ml portion of the filtrate was rejected and a convenient aliquot of filtrate was further diluted for the analysis within the limits of Beer’s law.
Four different solutions of each drug were analyzed through recovery studies, using the calibration curves constructed. Excellent recovery was observed Table-4.
Results and Discussion
N-Bromosuccinamide (NBS) has been used widely as a brominating and oxidizing agent for organic compounds. The proposed methods are indirect and are based on the oxidation and bromination reaction between drug and NBS and determination of residual NBS after allowing the reaction between drug and measured amount of NBS to be complete. The amount of NBS reacted corresponds to the drug content in all the methods.
Drug + known excess of NBS ——–» Reaction product of the drug + Unreacted NBS
Unreacted NBS+ Fixed amount of Indigo Carmine ——-» Absorbance measured at 520nm.
Method validation
The proposed methods were validated according to guidelines of International Conference on Harmonization (ICH). Under the described experimental conditions, standard experimental conditions, standard calibration curves for the studied drugs were constructed by plotting absorbance versus concentration. Confirmity with Beer’s law was evident in the concentration range cited in Table-2.The linear regression equations, molar absorptivity, Sandell’s sensitivity, limits of detection (LOD) and limits of quantification (LOQ) were listed in it. Standard deviation, relative standard deviation, variance and standard error were calculated.
Table 2: Analytical parameters for determination of drugs by oxidation with NBS and Indigo Carmine couple as analytical reagent.
| Drug | Taken(µg/ml) | Found(µg/ml) | er(%) | Recovery(%) | RSD (%) | Mean± SD |
| DOB | 2.04.06.0 | 2.003.856.03 | 0.003.750.50 | 100.0096.25100.5 | 2.3484 | 98.91±2.322 |
| DOM | 1.03.04.0 | 0.983.04.06 | 2.000.001.50 | 98.00100.00101.50 | 1.7588 | 99.83±1.755 |
| DUL | 4.55.06.0 | 4.55.136.11 | 0.002.601.83 | 100.00102.60101.83 | 1.3161 | 101.47±1.335 |
| PHE | 2.53.54.5 | 2.53.454.48 | 0.001.420.44 | 100.0098.5899.56 | 0.7314 | 99.38±0.726 |
| TRM | 1.22.03.0 | 1.21.923.01 | 0.004.000.33 | 100.0096.00100.33 | 2.442 | 98.77±2.4103 |
The accuracy of the method was established by analyzing the pure drug at four levels (within working limits) and the precision was ascertained by calculating the relative standard deviation of six replicate determinations on the same solution containing the drug at three levels in Table-3. The analytical results for accuracy and precision showed that the proposed methods have good repeatability and reproducibility.
Table 3: Determination of accuracy and precision, in terms of %recovery and %RSD, of the method developed for each drug using pure drug Samples.
| Property Name of the Drug | DOB | DOM | DUL | PHE | TRM |
|
λ max (nm) |
520 | 520 | 520 | 520 | 520 |
|
Beer’s law limits(µg mL-1 ) |
0.6-4.2 | 0.4-2.8 | 0.3-2.1 | 0.8-5.6 | 0.4-2.8 |
| Molar Absorptivity (L M-1 cm-1) | 1.26×10⁵ | 1.34×10⁵ | 8.10×10⁴ | 2.74×10⁴ | 7.45×10⁴ |
| Sandell Sensitivity(µg cm-2) | 0.0052 | 0.0038 | 0.0027 | 0.0074 | 0.0038 |
|
Slope (a) |
0.191 | 0.261 | 0.362 | 0.135 | 0.260 |
|
Intercept (b) |
0.031 | 0.012 | 0.018 | 0.019 | 0.018 |
|
Correlation coefficient (r) |
0.998 | 0.999 | 0.998 | 0.999 | 0.999 |
| Standard deviation\ of intercept (Sa) | 0.0394 | 0.044 | 0.0844 | 0.0597 | 0.0350 |
|
Limit of detection (µg mL-1 ) |
0.6807 | 0.5563 | 0.7693 | 1.4593 | 0.444 |
| Limit of quantification (µg mL-1 ) | 2.0628 | 1.6858 | 2.3314 | 4.4222 | 1.3461 |
| Regression equation Y=b+ax | 0.031+0.191x | 0.012+0.261x | 0.018+0.362x | 0.019+0.135x | 0.018+0.260x |
Table 4: Results of Assay of drugs in Tablets by the proposed methods (Standard amount of drug is added when the content of drug is very low.)
|
Tablets |
Drug in tablet (μg mL-1) |
Drug added (μg mL-1) |
Total found (μg mL-1) |
er% |
Recovery % |
RSD% |
Reference method mean ±SD |
Proposed method mean ±SD |
Student’s t-test |
f-test |
| DOB(DOBUSOL) | 1.01.02.03.0 | 1.02.00.000.00 | 2.003.011.992.97 | 0.000.330.501.0 | 100.00100.3399.5099.00 | 0.5838 | 99.80±0.66Ref.5 | 99.70±0.582 |
0.7698 (3.18) |
0.3678 (8.94) |
| DOM(DOMITAB) | 1.01.02.03.0 | 0.51.01.01.0 | 1.492.023.023.98 | 0.671.000.660.50 | 99.33101.00100.6699.50 | 0.8305 | 99.40± 0.7Ref.16 | 100.12±0.831 |
0.1423 (2.47) |
1.2275 (4.28) |
| DUL(DUMAX) | 4.05.07.08.0 | 1.001.000.000.00 | 4.986.006.997.99 | 0.400.000.140.12 | 99.60100.0099.8699.88 | 0.1687 | 99.99±0.22Ref.29 | 99.83±0.168 |
0.4012 (0.477) |
0.5826 (4.282) |
| PHE(DOLGEN CORP) | 5101520 | 0.52.01.00.00 | 5.4812.0215.9820.12 | 0.360.160.120.6 | 99.64100.1699.88100.6 | 0.4120 | 100±0..65Ref.39 | 100.07±0.412 |
0.5954 (3.182) |
0.3895 (8.94) |
| TRM(TRIVEDON) | 1.02.03.04.0 | 0.51.00.000.00 | 1.502.993.023.98 | 0.000.330.660.50 | 10099.67100.6699.50 | 0.5125 | 100.23±0.34Ref.49 | 99.95±0.512 |
0.9796 (2.47) |
0.2966 (4.28) |
The percentage recoveries of the drugs in tablet using the proposed methods compared with that given by reference methods are illustrated in Table-4. The validity of the proposed method in literature is evaluated by statistical analysis between the results obtained and that of reference methods. Student’s t-test and variance ratio F-test are chosen for the comparison of the results. Values are within the permissible range reported in literature. The tablet formulations were also analyzed to check the applicability of methods.
Conclusion
The obtained results from the method for the determination of mentioned drugs indicate that method is simple, accurate and precise. The method is economical compared to other sophisticated analytical instruments. Hence this method can be used for routine analysis of commercially available formulations. The method is suitable for the determination of these drugs in tablet formulation without interference from commonly used excipients. The solvents used for the method are inexpensive and simple to prepare, and could be used in a quality control laboratory for routine drug analysis.
Acknowledgements
One of the author M.Sasikala is thankful to Chairman, Princeton group of Institutions, Ramantapur for permission, P.Priyanka is thankful to CSIR for awarding of JRF. We are grateful to Head, Department of Chemistry, Osmania University, for providing facilities.
References
- Haiyan, L.; Zhang,L; Zhou,J.;Hao,Y.; He,P.; Fang,Y. Analytica Chimica Acta,2005, 541, 125– 129.
- Sayed Abdel Fattah,E.; Laila,T,; Anwer,E; Abdel Fattah, M.; Taghreed. Egyptian Journal of Analytical Chemistry.2012, 21, 53-59.
- Nour, E.; Faten A.; Frag, Y. A.; Mohamed, G. Drug Testing and Analysis. 2010, 2(5), 234- 242.
CrossRef - Kanna Rao, K. V.; Ravikumar Rao, B. V. V.; Rao, S. Acta Ciencia Indica,Chemistry 2002, 28(4), 239-241.
- Roopa K.A.; Jayanna B.K.; Nagaraja P.. Int. J. Pharm. Sci. Rev. Res. 2015, 32(1), 55-60.
- Kanna Rao, K. V.; Reddy, M. N. Asian Journal of Chemistry. 2001, 13(4), 1535-1538.
- Ramesh,T.; Nageswara Rao, P.; Nageswara Rao,R.; Saida S: Journal of Pharmaceutical Analysis. 2013, 3(6), 434-439.
CrossRef - Tian, F.S.; Chen,Y.H.; Liang, H.Y. Luminescence. 2014, 29(1), 92-5.
CrossRef - Balamuralikrishna, K.; Syamasundar,B. Asian Journal of Research in Chemistry.2011, 4(2), 304.
- Zhang, Yan. Analytical Letters.2004, 37(10), 2031-2042.
CrossRef - Maria, K.; Kamila, K. Journal of Chromatography B: Biomedical Sciences and Applications. 2000, 744(1), 207–212.
CrossRef - Sivakumar,T.; Manavalan, R.; Valliappan, K. Acta Chromatographic. 2007, 18, 130-142.
- Yamamoto, K.; Hagino,M.; Kotaki,H. Iga,T. Journal of Chromatography B: Biomedical Sciences and Applications. 1998,720 (1-2), 251–255.
CrossRef - Ali,M.S.; Ghori,M.; Khatri,A.R. Journal of Pharmaceutical and Bio Medical Analysis.2006, 41(2), 358–365.
CrossRef - Yoshizatoa,T.; Tsutsumia,K.; Kotegawab,T.; Imaib,H.;Nakanoa,S. Journal of ChromatographyB. 2014, 961, 86–90.
- Trivedi,P.D.; Dilip,G.; Maheshwari,D.G. International Journal of ChemTech Research. 2010, 2 (3), 1598-1605.
- Wang,X.; Qin,F.; Jing,L.; Zhu,Q.; Li,F.; Xiong,Z. Biomedical Chromatography.2013, 27(3), 371–376.
- Pankaj,G.; Rajendra N. G. Electrochimica Acta, 2015, 151(1), 1–7.
- Shahnawaz, S.; Siddiqui, A. W.; Masroor, M. T.; Vandana,A. Chromatography Research International, 2011 (2011), Article ID 404189, 5 pages.
- Lakshmana Prabu, S.; Srinivasan, M.; Thiyagarajan, S.; Marina, Q. International Journal of ChemTech Research, 2010, 2(3), 1441-1444.
- Sinha, V.R.; Anamika,Kumria,R.; Bhinge, J.R. J. Chromatogr. Sci., 2009, 47(7), 589-593.
CrossRef - Battu. P.B. Int. J. ChemTech Research., 2009, 11(3), 602-605.
- Sejal, K.; Patel,N.J.; Patel,K.M.; Patel,P.U.; Patel,B.H. Indian J Pharm Sci., 2008, 70(6), 825-827.
CrossRef - Narasimharaju.C.; Devala Rao,B.; Srinivas,C.; Bhimanadhuni,G. International Current Pharmaceutical Journal, 2012, 1(5), 98-102.
- Navneet Kumar, D. Sangeetha; Balakrishna,P. Pharm Methods, 2011, 2(3), 161–166.
- Srinivasa Reddy,T.; Viplava Prasad,U.; Acharyulu, M. L. N.; Srinivas, B. V.; Sastry C. S. P. Der Pharma Chemica, 2012, 4(6), 2427-2433.
- Vijay Amritha Raj,R.; Ramesh,T.; A. Phani kumar,A. International Journal of Pharma and Bio Sciences, 2011; 2(1),716-720.
- K Susmitha,K.; Venkateswarlu,G. International Journal of ChemTech Research,2011,3(3), 1246-1254.
- Prabhu,S.L.; Shahnawaz,S.; Dinesh Kumar,C.; Shirwaikar,A. Indian Journal of Pharmaceutical Sciences, 2008, 70(4), 502-503.
CrossRef - Wankhede,S.B.; Lad,K.A.; Chitlange,S.S. International Journal of Pharmaceutical Sciences and Drug Research. 2012, 4(3), 222-226.
- Arora,M.; Ritika Sharma, G. S. Inventi Impact: Pharm Analysis & Quality Assurance. 2013, (4), 242-252.
- Vishakha Vijay,D.; Dipmala Dilip,W.; Vassa, Swetal, G.; Kishore N. International Research Journal of Pharmacy 2013, 4(5), 115-119.
- Rohan S.; Hajare, R. A.; Anand,T; Anil, V. International Journal of Research in Pharmacy and Chemistry. 2011,1(4), 812-819.
- Maryam,K; Ansari,M. Iranian Journal of Pharmaceutical Research. 2005, 4(3), 147-153.
- Shama, S. A. Journal of Pharmaceutical and Biomedical Analysis 2002, 30(4), 1385-1392.
CrossRef - Mehul, P.; Bhavna, P.; Shraddha, P., Journal of Spectroscopy. 2013 (2013), Article ID 364750, 5 pages .http://dx.doi.org/10.1155/2013/364750.
CrossRef - Ivana,S.; Goran, N.; Vladimir, B. Macedonian Journal of Chemistry and Chemical Engineering. 2008, 27(2).
- Ahmed,S.; Amin,A.S. J. Molecul. Liq. 2007, 130, 84–87.
CrossRef - A-Shaalan,H.N. Journal of Saudi Chemical Society. 2010, 14(1), 15–21.
- Hamide,C.; Özden,T. Journal of Chromatographic Science. 2002, 40.
- Redasani,V.K.; Gorle,A.P.; Badhan,R.A;.Jain, P.S.; SuranaS.J. Chemical Industry &Chemical Engineering Quarterly. 2013, 19 (1), 57−65.
CrossRef - U.S. Food and Drug Administration, 2nd and Chestnut Sts, Philadelphia, PA 19106, USA.. J AOAC Int. 2006, 89(1), 53-7.
- Osama, H. Abdelmageed. Bull.Pharm.Sci. 2004, 27(2),315-323.
- Du, Song; Zhou, Jun-long; Liu, Mei-feng; Ye, Jian-wen. Zhongguo Y., 2012, 23(9), 834-836.
- Liu, Hairong. Zhongguo Yaoye 2011, 20(7),32-34.
- Abou-Attia, F. M.; Issa, Y. M.; Abdel-Gawad, F. M.; Abdel-Hamid, S. M. Farmaco 2003, 58(8), 573-579.
CrossRef - Issa, Y. M.; Abou-Attia, F. M.; Abdel-Gawad, F. M.; Abdel-Hamid, S. M. Scientia Pharmaceutica. 2002, 0(3),253-269.
- Adriana Aurelia Chis , Felicia Gabriela Gligor. Farmacia, 2010; 58(5).
- Mani Ganesh; Pushparaj H.; Arthanari S.K.; Peng Mei Mei; Hyun Tae Jang. 2011; 6(1), 22-30
- Thoppil,S.O.; Cardoza,R.M.; Amin,P.D. J Pharm Biomed Anal. 2001, 25(1), 15-20.
CrossRef - Ghoneim,M.M.; Khashaba, P.Y.; Beltagi, A.M.. J Pharm Biomed Anal. 2002, 27(1-2), 235-41.
CrossRef - Tianhong,Z.; Ping,M.; Wen,K.; Rongli, M.; Cong,Z.; Yongbin, S. Chromatographia.2010, 71(11-12), 1101-1105.
CrossRef

This work is licensed under a Creative Commons Attribution 4.0 International License.
![]()
A New Edition of Web of Science
Journal Impact Factor
2022: 0.5
Five Year: 0.8
Journal is Indexed in

Cabells Whitelist
![]()


