Sensitive Determination of Epinephrine Using Kinetic Spectrophotometric Method
Atefah Ekhtesasi and Masoud Reza Shishehbore*
Department of Chemistry, Yazd Branch, Islamic AzadUniversity, Yazd, Iran Corresponding Author Email: shishehbor47@iauyazd.ac.ir.
DOI : http://dx.doi.org/10.13005/ojc/320153
Article Received on :
Article Accepted on :
Article Published : 23 Feb 2016
In this study, thionine – bromate as a sensitive reaction system using kinetic spectrophotometric method for the determination of epinephrine is proposed. The method is based on the catalytic effect of epinephrine on the selected reaction system. The change in absorbance was followed spectrophotometrically as a criterion of the oxidation reaction progress. The effective reaction variables were optimized. Under optimized experimental conditions, calibration curve was linear over the range 0.4 – 12.8 mg/l and the detection limit was 0.13 mg/l for five replicate determinations of blank signal. The interfering effect of various species was also investigated. The developed procedure was successfully applied for the determination of diclofenac in pharmaceutical and biological samples satisfactorily.
KEYWORDS:Epinephrine; Thionine; Kinetic; Spectrophotometry
Download this article as:| Copy the following to cite this article: Ekhtesasi A, Shishehbore M. R. Sensitive Determination of Epinephrine Using Kinetic Spectrophotometric Method. Orient J Chem 2016;32(1). |
| Copy the following to cite this URL: Ekhtesasi A, Shishehbore M. R. Sensitive Determination of Epinephrine Using Kinetic Spectrophotometric Method. Orient J Chem 2016;32(1). Available from: http://www.orientjchem.org/?p=14161 |
Introduction
Epinephrine, also known as adrenaline, is a hormone, medication, and neurotransmitter. For the first time, epinephrine contain other cathecolamines was extracted from adrenal gland by Cybulski, a Polish physiologist, in 1985. Japanese chemist and his assistant, Takamine and Uenaka, discovered epinephrine in 19001. In body, the adrenal glands dump epinephrine into the blood stream, which leads to an increase the temperature thereby burning more calories that prepares the body for strenuous activity. In medicine, epinephrine is used chiefly as a stimulant in cardiac arrest, as a vasoconstrictor in shock, and as a bronchodilator and antispasmodic in bronchial asthma. Therefore, it is found in small amounts in the body and is essential for maintaining cardiovascular homeostasis because of its ability to divert blood to tissues under stress. In point of medical usage, it is used to treat a number of conditions including cardiac arrest, anaphylaxis, and superficial bleeding. Epinephrine may be determining in blood, plasma, or serum as a diagnostic aid, to monitor therapeutic administration, or to identify the causative agent in a potential poisoning victim2. Therefore, developed an accurate, sensitive and rapid method for quantitative determination of epinephrine in real samples with different matrices is necessary.
In view of the great importance of quantification of epinephrine, different analytical techniques have been used in different levels and matrices such as electrochemical3,4, chromatographic5 and spectrophotometric6 methods. Based on literature, electrochemical methods are the most common methods in last decade. Hard operation in electrode preparation and low repeatability are the most common disadvantages of the methods. Chromatographic methods were not widely used too. Spectrophotometric methods with attractive characteristics such as high sensitivity, sufficient accuracy, simplicity and the necessity of less expensive apparatus can be used for the determination of trace elements in samples with different matrices such as biological7 and pharmaceutical8 samples. To the best of our knowledge, there was not found any report kinetic spectrophotometric determination of epinephrine.
In continuing of our interest for the determination of biological compounds, thionine-bromate as a sensitive reaction system for quantification of epinephrine was selected. The method is based on the catalytic effect of epinephrine on the thionine-bromate reaction and monitoring of it was followed spectrophotometrically at λmax. The developed procedure has been successfully applied for the determination of epinephrine in real samples.
Experimental
Materials and methods
Redistilled water and analytical-grade chemicals were used. 100 ml of 100.0 mg/l of epinephrine was prepared by dissolving appropriate amount of epinephrine (Sigma, USA) just before each run. Working solution was prepared by serial dilution. A solution of 3.0 × 10⁻⁴ mol/l of thionine was prepared by dissolving 0.1720 g of thionine acetate (Merck, Germany) in water and diluting to 1.0 L. Sulfuric acid solution 4.0 mol/l and 0.05 mol/l of bromate solution was prepared by appropriate dilution of conc. sulfuric acid (Merck, Germany) and potassium bromate.
Instrumentation
A double beam PG instruments UV-Vis spectrophotometer (T80+, UK) with a pair of matched 1-cm glass cell was used for measuring the absorbance-time changes at fixed wavelength. A thermostated water bath (Fater Rizpardaz, Iran) was used to adjust the temperature of working solutions at 25.0 ± 0.1°C as working temperature. A stopwatch was used to record the reaction time.
General procedure
Initial kinetic spectrophotometric studies of the reaction system were done for chosen the reagent concentrations (except the epinephrine) for the analytical procedure. To a series of 10 ml calibrated flasks, 1.0 ml of 4.0 mol/l sulfuric acid solution, 0.7 ml of 3.0 × 10⁻⁴ mol/l thionine solution and 0.1 ml of 50.0 mg/l epinephrine solution were added. Then, 0.3 ml of 0.05 mol/l bromate solution was added. The solution was diluted to the mark with redistilled water and mixed thoroughly. Stopwatch was started after adding the last drop of the bromate solution. A portion of the solution was transferred to the cell, and the change in absorbance was recorded against water at 601 nm (λmax) and 25 °C for fixed times of 420 s with time interval 30 s. Since the reaction was catalyzed by epinephrine, the measurements were repeated in presence of it. The absorbance changes of the unanalyzed and catalyzed reactions that named as the change in absorbance of blank and sample were labeled ∆Ab and ∆As, respectively. The difference in the absorbance (∆A = ∆As – ∆Ab) was considered as the response. Under optimum experimental conditions, calibration curve was constructed by plotting the response against the epinephrine concentration.
Procedure of sample preparation.
The epinephrine injection solution (1 mg/ml) was transferred to a 25 ml volumetric flask and dilution was done to the mark. After serial dilution, an appropriate amount of it was used in each analysis.
Epinephrine was determined in human urine and serum as biological samples. The samples were collected from persons who had not taken the drug. They were spiked with epinephrine and solid phase extraction technique using C18 cartridge (Supelco Inc., 10 ml) was used for purification and pre-concentration of epinephrine from the samples. The purification and pre-concentration procedure was performed as discussed in Ref. 9. Then, using the developed procedure, the extracted epinephrine was determined.
Results and Discussions
Thionine, Lauth’s violet, is a strongly staining metachromatic dye. It is widely used for biological staining as violet dye, in place of Schiff reagent in quantitative Feulgen staining of DNA and mediate electron transfer in microbial fuel cells10. In point of chemical structure, it is a compound in family of amines with featuring of phenothiazine. It was used for the determination of folic acid11, dopamine12 and vanadium13.
Probability of the determination of epinephrine by the reaction system was studied by monitoring the change in absorbance in absence and presence of it. The obtained results were shown that the reaction system was catalyzed by epinephrine at trace levels. The possible mechanism was suggested as follow:
In a cyclic way, thionine was oxidized by bromate in acidic media (reaction 1), bromine generation was done in the following (reaction 2) and finally thionine was oxidized by bromine (reaction 3).
Thionine(Red) + BrO3–+ 6 H+ → Thionine(Ox) + Br– + 3H2O (1)
6 BrO3– + 10 H+ + 12 Br– → 6 Br2 + 6 H2O (2)
Thionine(Red) + Br2 + H+ → Thionine(Ox) +2 Br– (3)
The signal related to the reactions labeled as blank signal (∆Ab).
Since, epinephrine can be oxidized along with the thionine by bromate in acidic media (reaction 4), the rate of bromide generation was increased, and oxidation of thionine by bromine was done faster. Therefore, epinephrine shown catalytic effect. The related signal labeled as sample signal (∆As).
Epinephrine (Red) + Br2 + H+ → 2 Br– + Epinephrine (ox) (4)
where Red and OX are the reduced and oxidized forms of the reactant, respectively.
Since the maximum sensitivity can be obtained under optimum experimental conditions, optimization of effective factors on the reaction rate is necessary. For this purpose, the maximum response was considered to obtain the most sensitive results.
Sulfuric acid concentration was varied in the range 0.32 to 0.48 mol/l and the rate of catalyzed and uncatalyzed reactions was monitored. As can be seen in Fig. 1, the maximum response was obtained at 0.40 mmol/l of sulfuric acid and at higher concentrations the response was decreased. Protonation of thionine at higher concentrations of sulfuric acid can be resulted to disorder. Therefore, 0.40 mol/l of sulfuric acid was used for further study.
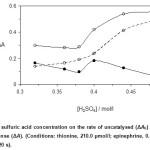 |
Figure 1: Effect of sulfuric acid concentration on the rate of uncatalysed (ΔAb) and catalysed (ΔAs) reactions and response (ΔA). (Conditions: thionine, 210.0 µmol/l; epinephrine, 0.5 mg/l; bromate, 1.5 mmol/l; 25 °C and 420 s). Click here to View figure |
Optimiazation of thionine concentration on the reaction rate was studied over the range 150.0 – 300.0 µmol/l. As it an be seen in Fig. 2, the maximum sensitivity was obtained at 225.0 µmol/l of thionine. Dye aggregation maybe resulted to decrease the reaction rate at higher concentrations. Thus, 225.0 µmol/l of thionine as optimum concentration was selected for further study.
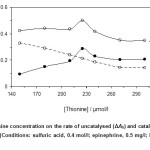 |
Figure 2: Effect of thionine concentration on the rate of uncatalysed (ΔAb) and catalysed (ΔAs) reactions and response (ΔA). (Conditions: sulfuric acid, 0.4 mol/l; epinephrine, 0.5 mg/l; bromate, 1.5 mmol/l; 25 °C and 420 s). Click here to View figure |
The effcet of bromate concentration on the reaction rate was studied in concentration range 1.0 – 2.0 mmol/l. The net reaction rate was increased up to 1.5 mmol/l, while at higher bromate concentration the response was decreased (Fig. 3). Decreasing the thionine concentrations can be attributed to reducing the response.
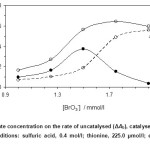 |
Figure 3: Effect of bromate concentration on the rate of uncatalysed (ΔAb), catalysed (ΔAs) reactions and response (ΔA). (Conditions: sulfuric acid, 0.4 mol/l; thionine, 225.0 µmol/l; epinephrine, 0.5 mg/l; 25 °C and 420 s). Click here to View figure |
Under optimum reagents concentration, the temperature effect on the reaction rate was studied over the range of 15 to 40 °C. As can be seen in Fig. 4, increasing the temperature up to 30 °C caused an increase in the sensitivity, whereas at higher temperatures it decreased. Therefore, 30 °C was selected as optimum temperature.
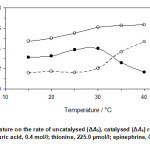 |
Figure 4: Effect of temperature on the rate of uncatalysed (ΔAb), catalysed (ΔAs) reactions and response (ΔA). (Conditions: sulfuric acid, 0.4 mol/l; thionine, 225.0 µmol/l; epinephrine, 0.5 mg/l; 30 °C and 420 s). Click here to View figure |
The optimum time was found by measuring the change in the absorbance up to 540 s with time interval 30 s. The net reaction rate was increased up to 390 s, and in longer times the reaction rate was almost constant. Therefore, 390 s was selected for further study.
Analytical parameters; Linearity, Limit of detection and precision
The main aim of the study was extracting a concentration range of epinephrine that the relation of response versus concentration is linear. Therefore, the effective factors on the reaction rate were optimized. Calibration curve that was constructed by plotting the response versus epinephrine was linear over the range 0.4 – 12.8 mg/l of epinephrine. The regression equation of the calibration curve gave as equations 5.
ΔA = 0.0272[epinephrine] + 0.1032 (R2 = 0.9991) (5)
ΔA is the difference in the response, [epinephrine] is the epinephrine concentration in mg/l and R2 is the correlation coefficient. The limit of detection (3sb/m; sb is the standard deviation of the blank signal and m is the slope of calibration curve) was 0.13 mg/l of epinephrine for eight replicate determinations of blank. The relative standard deviations (n = 8) were 1.25 and 1.05 % for 1.0 and 5.0 mg/l of epinephrine, respectively.
The effect of diverse species
The interfering effect of some compounds and ions that may be co-exist with epinephrine in real samples on the determination of 1.5 mg/l of epinephrine was investigated. The tolerance limit was defined as the concentration of the added species causing an error more than ± 5% on analytical signal. The obtained results that was given in Table 1 show that Fe2+, Cl– and NO2– have seriously interfering effect, whereas not exist in real sample matrix.
Table 1: Tolerance limit for diverse species on the determination of 1.5 mg/l of epinephrine using recommended procedure.
| Foreign species | Tolerance limit (WEpinephrine/WSpecies) |
| Glucose, Fructose | 1000 |
| Ethanole | 980 |
| CH3CO2‑, PO43-, NO3‑ | 1000 |
| CO32‑, | 925 |
| Na+, K+ | 1000 |
| Urea | 680 |
| Uric acid | 575 |
| Fe2+ | 2 |
| NO2‑, Cl‑ | <1 |
Real samples analysis
In oredr to evaluation the analytical applicability of the developed method, it was applied for the determination of epinephrine in real samples with different matrices. Oral injection solution was selected as pharmaceutical sample and sample preparation was done as discussed previously. After sample preparation, an appropriate amount of the samples were analyzed by the deveoped procedure. The results of three replicate determinations were given in Table 2. The precision was evaluated by RSD%. Statistical t test was used to evaluating the reliability of the method. Regaurding to the difference between the experimental and critical t value (4.30, 95% confidence level and two degrees of freedom), confirms the systematic error for the determination of epinephrine in pharmaceutical samples using the developed method is negligible.
Table 2: Determination of epinephrine in epinephrine injection solution using the recommended procedure.
Table 2: Determination of epinephrine in epinephrine injection solution using the recommended procedure. |
|||||
| Sample | Founda | RSD (%) | Labled | Statistical t testb | Pharmaceutical Co/Batch No. |
| 1 | 0.99 ± 0.01 | 1.01 | 1 mg/Amp | 1.73 | Iran Hormon-Iran/0003 |
| 2 | 1.01 ± 0.02 | 1.98 | 1 mg/Amp | 0.87 | Darupakhsh/162 |
| aMean±standard deviation (n=3)bTabulated t-value for two degrees of freedom at P(0.95) is 4.30. | |||||
Serum and urine were used as biological samples and analysed by the recommended procedure. After sample preparation, the samples were spiked with different amounts of epinephrine and analyzed. The results were given in Table 3. The accuracy of the procedure was confirmed by recovery and the values confirm the slight systematic error during the quantitative determination of epinephrine in serum and urine samples. Successive application of developed method for determination of epinephrine in pharmaceutical preparations and biological samples shows the developed method is free from interfering effect of matrix effect and can be used for quantitative determination of epinephrine in different real samples.
Table 3: Determination of epinephrine in serum and urine sample using the recommended procedure.
Table 3: Determination of epinephrine in serum and urine sample using the recommended procedure. |
||||
| Sample | Added(mg/l) | Founda (mg/l) | RSD (%) | Recovery (%) |
| Serum | ||||
| 1 | — | <D.L | — | — |
| 1.0 | 1.04± 0.02 | 1.92 | 104.0 | |
| 5.0 | 4.95 ± 0.05 | 1.01 | 101.0 | |
| 10.0 | 10.13 ± 0.11 | 1.07 | 101.3 | |
| Urine | ||||
| 1 | — | <D.L | — | — |
| 1.0 | 0.95± 0.02 | 2.10 | 104.0 | |
| 5.0 | 4.86± 0.05 | 1.03 | 99.0 | |
| 10.0 | 10.11 ± 0.12 | 1.19 | 102.0 | |
| aMean±standard deviation (n=3) | ||||
Conclusion
In present study, a new reaction system for quantitative determination of epinephrine using kinetic spectrophotometric method was reported. The developed procedure that can be used for the determination of epinephrine in real samples has advantages over the electrochemical methods as common methods in simplicity, repeatability and ease of operation.
Acknowledgment
The athours are thakful to the Islamic Azad University-Yazd Branch for financial assistance of the research.
References
- Bennett, M., Clin. Auton. Res. 1999, 9, 145–59.
CrossRef - Axelrod, J., J. Biolog. Chem. 1992, 237,1657–1660.
- Benzhi, L., Wang, M., Xiao, B., J. Electroanal. Chem., 2015, 757, 198-202.
CrossRef - Wierzbicka, E., Sulka, G. D., Sens. Actuators B, 2016, 222, 270-279.
CrossRef - Fotopoulou, M. A, Loannou, P. C., Anal. Chim. Acta, 2002, 462, 179-185.
CrossRef - Bulatov, A. V., Petrova, A. V., Vishnikin, A. B., Moskvin, A. L., Moskvin, L. N., Talanta, 2012, 96, 62-67
CrossRef - Shishehbore, M. R., Sheibani, A., Mirparizi, E., Chin. Chem. Let., 2012, 23, 611–614.
CrossRef - Shishehbore, M. R., Aghamiri Z., Iran. J. Pharm. Res., 2014, 12, 373-382.
- Bogusz, M. J., Maier, R. D., Kruger, K. D., Kohls, U., J. Anal. Toxicol., 1998, 22, 549-558.
CrossRef - Kiernan, J. A., Biotech. Histochem., 2001, 76, 261–278.
CrossRef - Shishehbore, M. R., Sheibani, A., Haghdost, A., Spectrochim. Acta A, 2011, 81, 304– 307.
CrossRef - Shishehbore, M. R., Asgharpoor, A., Nasirizadeh, N., J. Chem., 2013, 2013, 1-6.
- Bogusz, M. J., Maier, R.-D., Kruger, K.-D., Kohls, U., J. Anal. Toxic., 1998, 22, 549–558.
CrossRef

This work is licensed under a Creative Commons Attribution 4.0 International License.
![]()
A New Edition of Web of Science
Journal Impact Factor
2022: 0.5
Five Year: 0.8
Journal is Indexed in

Cabells Whitelist
![]()


