Purification, Peptide Mapping and Spectroscopic Characterization of Myoglobin from Striped Snake-Head Fish (Ophicephalusstriatus)
Chattrachatchaya Chotichayapong1, Nison Sattayasai2, Nobuyuki Kanzawa3, Toru Tamiya3, Takahide Tsuchiya3 and Saksit Chanthai1*
1Center of Excellence for Innovation in Chemistry, Department of Chemistry, Faculty of Science, KhonKaen University, KhonKaen 40002, Thailand
2Department of Biochemistry, Faculty of Science, KhonKaen University, KhonKaen 40002, Thailand
3Department of Materials and Life Sciences, Faculty of Science and Technology, Sophia University, Tokyo 102-8554, Japan
Corresponding author E-mail: sakcha2@kku.ac.th
DOI : http://dx.doi.org/10.13005/ojc/320119
Article Received on :
Article Accepted on :
Article Published : 05 Mar 2016
Myoglobin (Mb) was isolated from ordinary muscle of striped snake-head fish. The crude extract was fractionated by salting out and separated using both Sephadex G-75 and DEAE-cellulose column chromatography and molecular filtration, giving at least two protein bands on SDS-PAGE with molecular mass of 15 kDaas major band and trace of 20 k Dacompared with those of MALDI-TOF-MS: 15,597.68 Da (major peak) and 23,509.42 Da (trace). Thus, this 15 kDa protein would be the fish Mb which was strongly coupled with other proteins of 23.50 kDa. Spectral characteristics of these purified proteins still exhibited maximum absorption at 280 and 410 nm (the Soret peak). Their tryptophan fluorescence appeared at 330 nm also corresponding with horse heart Mb. The partial peptide sequences of 15 kDa protein obtained from LC-MS/MS with in-gel trypsin digestion were homologous with those of some fish species. In addition, the purified Mb was also determined for its partial peptide sequence by digestion with Lys-C endoproteinase and analysis of amino acid sequence using Edman degradation, resulted in only some amino acid residues are identical to Mb from other fish species. It is noted that differences in their amino acid sequences are attributed among fish Mb species of which playing distinct roles of both structural rigidity and functional property.
KEYWORDS:Myoglobin; Peptide mapping; Edman degradation; Protein purification and characterization
Download this article as:| Copy the following to cite this article: Chotichayapong C, Sattayasai N, Kanzawa N, Tamiya T, Tsuchiya T, Chanthai S. Purification, Peptide Mapping and Spectroscopic Characterization of Myoglobin from Striped Snake-Head Fish (Ophicephalusstriatus). Orient J Chem 2016;32(1). |
| Copy the following to cite this URL: Chotichayapong C, Sattayasai N, Kanzawa N, Tamiya T, Tsuchiya T, Chanthai S. Purification, Peptide Mapping and Spectroscopic Characterization of Myoglobin from Striped Snake-Head Fish (Ophicephalusstriatus). Orient J Chem 2016;32(1). Available from: http://www.orientjchem.org/?p=14736 |
Introduction
Striped snake-head fish (Ophicephalusstriatus) is well known economic freshwater fish which is widely habitat distributing in Thailand. This fish is among the very few aquatic vertebrates that are able to tolerate periods of severe environmental hypoxia, both diurnally and for prolonged periods. Particularly, it is a kind of fish which is tolerant of water lacking in dissolved oxygen and can survive without water environment such as mud for a number of mouths as long as the skin and breathing apparatus are kept moist1. Myoglobin (Mb), a protein which is closely related of hypoxic tolerance of the fish, may have some interesting characteristic and their physicochemical properties.It is generally considered as important intracellular oxygen binding hemoprotein found in skeletal and cardiac muscle tissue. The protein exists in a wide variety of species such as diving mammals2,3and also found in amphibians4, teleosts5,chondrichthid fish6,7and some lower species8,9. Structurally, it is a compact and globular protein whose backbone structure consists of eight-helical segments designed A through H and the heme as prosthetic group10. The heme is positioned in a hydrophobic heme pocket and binds directly to the imidazole group of proximal histidine through oxygen coordinate binding11. The primary structure of Mb is the order in which its 146-153 amino acids are joined depending on species. Itposses its functional property preliminarily as a temporary storing of excess oxygen for metabolic respiration in order to delay and prevent the onset of anoxia by releasing of oxygen when perfusion levels of oxygen in mitochondria fall to critical low values or high oxygen demand11. It also plays a role in facilitating oxygen transport into tissues from by diffusion from sercolemma to the mitochondria of heart and red muscle cells12. Their biological functions depend critically on the chemical equilibrium of oxygen binding to the iron that is chelated to the heme group within the protein. Moreover, it is the most important determinant for the characteristic color of muscle depending on its redox state and concentration13. Thus, different kind of animals living in the different habitat shows a difference in their properties.
As far as fish Mb is concerned, it is present in most fishes, but its amount varies widely. Mb content is correlated with species capacities for sustained aerobic exercise and also depends on breed, sex and age of animal, training and nature of nutrition, oxygen availability, blood circulation and muscle type14-16. Thus, the protein of fish species is interesting to study because it provides an excellent system in which to study the natural variation of its function, and to understand the interrelationship between structure and function. As well known, all function of Mb is related with their structure. The variation in their amino acid sequences influences bothchemical and thermal stability17-21.The striped snake-head fish is mostly found as the hypoxic tolerant fish. Therefore, itsstructural property is thought to have interesting characteristic and relatively high stability. Based on functional aspect including structure and stability relationship, this fish Mb is, however, no report yet at the present. This research study is then aimed to investigate structural properties related to folding stability. Herein, Mb of the striped snake-head fish is isolated and purified from its muscle. Their structural properties including molecular mass, isoelectric point, spectral properties and primary structure are described.
Therefore, the objectives of this study were to isolate and purify Mb from the striped snake-head fish muscle by column chromatography and molecular filtration. Analysis of partial peptide sequences of the fish Mb were also done by LC-MS/MS andan automated Edman degradation sequencing. Characterization of their spectroscopic properties was then carried outby absorptionand fluorescence spectrophotometry,and mass spectrometry.
Materials and Methods
Extraction and isolation by salting out
Striped snake-head fish (Ophicephalusstriatus) was obtained as flesh fish from a public market in KhonKaen, Thailand. Fresh ordinary muscle from striped-snake head fishwas dissected free of gross fat and connective tissue. It was chopped coarsely and soaked in 10 mMTris-HCl buffer, pH 6.8 (1:2 w/v) for 1.5 h and leave to settle for at least 5 min, the red supernatant containing some soluble Mb was collected. The remaining muscle was extracted with the same buffer by homogenization in a blender at low speed and leave to settle for at least 10 min. Then, the suspension was filtered through fine nylon mesh. All steps above were done at 4oC. The insoluble material was removed by centrifugation at about 10,000 ×g, 20 min at 4oC. The protein extract solution obtained from both extraction processes were combined and then subjected to salting out using ammonium sulfate precipitation.
The fractionation of Mb was subsequently carried out at 4oC, by adding 45-75% (w/v) ammonium sulfate. The voluminous precipitate of the 45% and 55% salt saturation was discarded after centrifugation at 10,000 ×g for 20 min. Ammonium sulfate was added to the supernatant to obtain 75% salt precipitate. After centrifugation at 10,000 ×g for 20 min, the precipitate was collected and dissolved in a small volume of 2 mMTris-HCl buffer pH 6.8. The crude Mb was then dialyzed overnight against the same buffer and the outer buffer was changed three times during dialysis. The insoluble materials which sometime occurred in the dialysis bag were removed by centrifugation. After determining the protein composition by sodium dodecyl sulfate polyacrylamide gel electrophoresis (SDS-PAGE, 15% gel) using horse heart Mb as reference, the crude Mb solution was concentrated using CentriconYm10 filtration unit and stored for purification.
Purification of myoglobin
After the extraction and isolation steps, the concentrated crude Mb solution was obtained. The purification of myoglobin by column chromatography and molecular filtration was performed. Column chromatography was generally used for purification of Mb from complex sample matrices. In addition molecular filtration with various molecular weight cut-off was also applied to use for Mb purification.
Gel filtration chromatography
The purification of Mb was firstly achieved by gel filtration. The concentrated Mb was fractionated on a column of Sephadex G-75 (100 × 1.9 cm i.d.) equilibrated with 20 mMTris-HCl buffer pH 6.8.About 4 mL of the Crude Mb extract solution was applied onto the column and developed by the same Tris-HCl buffer solution at a flow rate of 0.7 mL/min. Four mL of eluate solution were collected by fraction collector.The Mb-containing fractions were examined by the absorbance at 280 and 413 nm and by SDS-PAGE for its purity. These fractions which had high absorbance ratio of 408/280 nm were pooled and further purified by molecular filtration technique with molecular weight cut-off at 30 kDa and 10 kDa, respectively.
Molecular filtration
The next purification step is achieved by molecular separation on molecular filtration unit with molecular weight cut-off (MWCO) at 30 kDa and 10 kDa. The Mb-containing fraction obtained from 5.1 was then introduced to CentriconYm 30 filtration unit (MWCO; 30 kDa, Amicon, Germany). After centrifugation at 7500 ×g, 10°C for 10 min, The protein with smaller than membrane pore size (<30 kDa) will be passed through the membrane pore. The retainate protein solution was kept to be tested for their composition and for further purification. The pooled filtrate which filtered through CentriconYm 30 was subject to aCentriconYm 10 filtration unit(MWCO; 10 kDa)and then centrifuged at 7,500 ×g for 10min.The retainate was collected for further purification.
Ion exchange chromatography
The retainate fractions from CentriconYm 30 and CentriconYm 10 filtration unitwere separately chromatographed on a DEAE-cellulose column (20 × 2.5 cm i.d.)which was equilibrated with 20 mMTris-HCl buffer pH 6.8containing 1 M NaCl. The Mb was eluted with an isocratic elution using the same buffer at a flow rate of 0.7 mL/min. Each of 2 mL fractions was collected and subsequently concentrated in aCentriconYm 10 filtration unit. The purity of purified Mb was determined using UV-visible spectrophotometry and SDS-PAGE.The other fishMbswere extracted, and purified by the same manner.
Purity of fish myoglobin
From the purification step, the purified fish Mb from column chromatography were assayed for its purity by SDS-PAGE according to Laemmli (1970)22(5% stacking gel and 15% separating gel) compared to horse heart Mb and low molecular mass marker mixture includingphosphorylase b (97 kDa), bovine serum albumin (66 kDa), ovalbumin (45 kDa), carbonic anhydrase (30 kDa), trypsin inhibitor (20 kDa) and alpha-lactalbumin(14.4 kDa). The purity is also confirmed by using absorption ratio at aromatic region (260-280 nm) and at the Soret peak (407-415nm) monitored by UV-Vis spectrophotometer.
Determination of protein concentration
The total protein concentration was determined spectrophotometrically at 595 nmby the method of Bradford (1976)23withbovine serum albumin (BSA) as the standard protein. The standard curve of absorbance versus concentration of the standards was plotted and the total protein concentration was interpolated from the curve.
Identification and characterization of fish myoglobin
The characterization and identification of fish Mb was investigated including molecular weight, isoelectric point, molecular absorption and fluorescence, and partial amino acid sequence.
Determination of molecular mass
An accurate molecular mass of the purified striped snake-head Mb was determined by matrix assisted laser desorption ionization time of flight mass spectrometry (MALDI-TOF-MS) with 3,5-dimethoxy-4-hydroxycinamic acid (Sigma-Aldrich) as a matrix. The spectrum was recorded in linear mode with an acceleration voltage of 377 mV. To prepare sample for mass spectrometry, 1 µL of matrix solution was spotted on the MALDI plate. The purified Mb solution (1 µL) was then spot quickly onto a drop of the matrix solution and then air dried at room temperature to allow sample crystallization prior to insertion into the instrument24.
Molecular absorption
The molecular absorption measurement of the crude Mb solution and the purified fish Mb were carried out using UV-Vis spectrophotometer. About 300 µL the Mb solutions was transferred to a quartz cell. The UV (252 to 280 nm) and Soret peaks (408 to 413 nm) of the Mb were recorded.
Fluorescence spectrum
Fluorescence measurement was performed with a spectrofluorophotometer. About 3 ml of purified fish Mb was approximately used in a 1.0 cm path length cell. Excitation (280 nm) wavelength for tryptophan fluorescence intensity was used. Both the relative fluorescence intensity and the maximum emission wavelength of the purified fish Mb were recorded.
Amino acid sequence analysis
Partial amino acid sequence analysisby in-gel tryptic digestion and liquidchromatography coupled with tandem mass spectrometry (LC-MS/MS):
The purified Mb band obtained from SDS-PAGE with Coomassie Brilliant blue staining was excised from the gel. The excised band was washed twice with 100 µl of 50 mMambic/ 50% methanol, dehydrated in 100 µl of 75% acetonitrile (ACN) for 20 min and then dried. Plug was then rehydrated in 20 mMambic and digested with 10 µl of trypsin solution at 37°C for 60 min. Peptides were extracted twice with 60 µl of 50% ACN/0.1%trifluoroacetic acid (TFA) for 20 min and with 40 µl of the same mixture solution for 20 min. Then the two extracts were pooled and dried. Peptides were resuspended in 3µl of 50% ACN/0.1%TFA, mixed with equal volumes of a-cyano-4-hydroxycinnamic acid in 50% ACN/0.1%TFA and 2% w/v ammonium citrate and then analyzed by LTQ Linear Ion Trap Mass Spectrometer (ThermoFinnigan, San Jose, USA). Based on the LC-MS/MS results, a search in nr.FASTA by BioworkTM 3.1 SR1 (ThermoFinnigan) was performed to identify the protein band. The in-gel tryptic digestion, LC-MS/MS and database search were done at the Bioservice Unit, National Science and Technology Development Agency, Bangkok, Thailand.
N-Terminal amino acid sequence analysisof Lys-C-digested peptides using Edman degradation:
The purified Mb solution was digested with Lysine-C endopepsidase (Lys-C) according to Strader et al. (2006)25 with slightly modification. Briefly, A 40 µL of Mb solution was taken a place in a microcentrifuge tube (Appendorf) and 10 µL of 50 mM sodium bicarbonate was added to the tube to adjust the pH of Mb solution. To reduce protein disulfide bond, the mixing solution was treated with 4 µL of 200 m Mdithiothreitol and incubated at 37 °C for 1 hour. The reduced protein was then alkylated with 4 µL of 200 mMiodoacetamidein the darkto block the free sulfhydryl group and incubated for 15 min at room temperature Lys-C endoproteinasewas added at the ratio 1:50 v/v and the reaction was carried out at 37 °C for 4 hour. To inhibit further enzyme activity, 2 mL of the mixing of 4% acetonitrile and 0.2% TFA in H2O was added to the digested protein. The resulting solution was stored at -80 °C for determination of peptide sequence.
The Lys-C-digested peptides solution was pretreated with 0.1% TFA and separated by a Gilson Model 712 reversed-phase HPLC a on 8 x 0.62 cm, i.d C8 column (5 mm particle size;, Dupont). Eluent A consists of 0.1% TFA in acetonitrile and eluent B was 0.1% TFA in water. The peptide fragments were eluted with two gradient steps from 0 to 30% eluent A in 6 min, then from 30 to 70% eluent A in 16 min with a flow rate of 0.5 mL/min. Peptides elution was monitored at 214 nm and collected using fraction collector. Fractions containing peptides were dried using speed-vacuum centrifugation system. N-terminal amino acid sequence of each Lys-C-digested peptide fragments were determined by Automated Edman degradation usingPreciseÔprotein sequencer equipped with on-line PTH analyzer.
Determination of isoelectric point
The theoretical isoelectric point of purified striped snake-head fish Mb was calculated from the complete amino acid composition using the online calculator provided by the ExPASy Molecular Biology server.
Results and Discussion
Extraction and isolation of myoglobin
Mb was extracted twice from ordinary muscle of striped snake-head fish (Ophicepharusstriatus). The chopped fish muscle was soaked and stirred in Tris-HCl buffer, pH 6.8 to release oxyMb into the buffer because the soaking and stirring can help Mb remain in oxy-form which can soluble in water or buffer solution greater than other forms. The resulting solution showed a bright red color indicating the soluble Mb and Hb in the buffer solution. After the solution was collected, the muscle was homogenized with the same buffer solution to extract muscle-bound Mb. The resulting solution also had a bright red color. The extract solutions from both steps were pooled and then subjected to salt fractionation. Most of Mb was co-precipitated with other proteins in the range of 45-75% (w/v) ammonium sulfate. The 75% precipitate was dissolved in small amount of Tris-HCl buffer, pH 6.8; this was so-called crude Mb extract. Fish Mb obtained from each step of the preparation was assayed for its composition by SDS-PAGE. It was found that many protein bands with molecular mass of £ 14.4 kDa to ³ 94 kDa were obtained as shown in Fig.1(a). The UV-Vis absorption spectrum of the crude Mb extract which is exerted by tryptophan and tyrosine appeared in the range of 220- 280 nm and the Soret maximum peak of this fish Mb was found at 410 nm. In addition, the UV-Vis spectrum pattern of fish Mb was also found similar to the corresponding oxy-form of Mb. The charge transfer peaks were shown at 570 nm (α peak) and 530 nm (β peak) as illustrated in Fig. 1(b).
Since the precipitate of 75% (w/v) salting out had protein impurities less than that of 55% (w/v) salting out. Therefore, the 75% precipitate was concentrated using CentriconYm 10 filtration unit (MWCO, 10 kDa) and subjected to further purification.
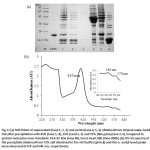 |
Figure 1: (a) SDS-PAGE of supernatant (lane 1, 2, 3) and pellet (lane 4, 5, 6) obtained from striped snake-head fish after precipitation with 45% (lane 1, 4), 55% (land 2, 5) and 75% (NH4)2SO4 (lane 3, 6) compared to protein molecular mass standards 14.4-93 kDa (lane M), horse heart Mb (lane HMb). (b) UV-Vis spectra of the precipitate obtained from 75% salt dissolved in Tris-HCl buffer (pH 6.8) and the α- and β-band peaks were observed at 570 and 540 nm, respectively. Click here to View figure |
Purification of myoglobin
The concentrated crude Mb extract obtained from previous section was further purified to separate Mb from other proteins by various techniques. Firstly, the purification of Mbs was performed by using column chromatography including gel filtration and ion-exchange chromatography. In case of gel filtration chromatography, Sephadex was chosen because it is widely used in many laboratories and readily available. Moreover, this material is making large-scale purification more affordable, very stable and can be regenerated to use several times. In this study, different types of Sephadex gel were used in order to obtain and ensure the suitable gel filtration packing for purification of this fish Mb.
The protein precipitate of 75 %(w/v) ammonium sulfate salting out was separated on Sephadex G-50, G-75 and G-100 columns which molecular mass fractionation range of 15-30 kDa, 30-80 kDa and 40-150 kDa, respectively. The elution profiles of the crude Mb extract obtained from each column, which exhibiting absorption at 280 and 408 nm were shown in Fig. 2 (a), (b) and (c).
The elution profile from Sephadex G-50 column showed four peaks which is very poor resolution. Therefore, the crude Mb extract could not resolved by this column (Fig. 2 (a)). For Sephadex G-75 column, the elution profile showed two peaks, the latter peak probably contained high amount of Mb judging from its brown color and its Soret absorptivity at 408 nm which was higher than the front peak. Thus, this column could separate some Mb from other proteins (Fig. 2 (b)). According to Sephadex G-100 column, the elution profile showed two peaks similar to Sephadex G-75 elution profile. However, the protein peaks obtained from Sephadex G-100 had not been shown high intensity of the Soret peak (Fig. 2 (c)). These results demonstrated that Sephadex G-75 was suitable for purification of the fish Mb.
Although, a relative molecular mass of Mb is usually 14-18 kDa, depending on animal species and Sephadex G-50 can fractionate the protein with molecular mass 15-30 kDa, Sephadex G-50 could not purify this fish Mb. It could be suggested that the striped snake-head fish Mb may associated with other proteins.
To reduce analysis time, we selected protein fractions from Sephadex G-75 to determine protein compositions using SDS-PAGE as shown in Fig. 3. The fractions from the front peak of Sephadex G-75 elution profile probably belonged to high molecular mass proteins (Fig. 3; lane 6-8). Although the later peak showed high UV-Visible absorption ratio of 408/280 nm, the fractions No. 11-14 of the later peak still contained many protein impurities. Further purifications of the fractions (No. 11-14) were required.
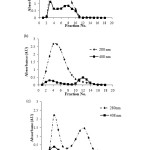 |
Figure 2: Elution patterns of the crude extract of Mb from striped snake-head fish obtained from (a) Sephadex G-50, (b) Sephadex G-75 and (c) Sephadex G-100 columns. The eluates were measured at 280 and 408 nm Click here to View figure |
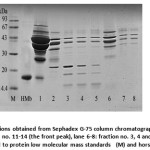 |
Figure 3: SDS-PAGE of fractions obtained from Sephadex G-75 column chromatography; lane 1: the crude Mb extract, lane 2-5: fraction no. 11-14 (the front peak), lane 6-8: fraction no. 3, 4 and 8, respectively (the latter peak), compared to protein low molecular mass standards (M) and horse heart Mb (HMb) |
To further purify Mb, the fractions No. 11-14 were pooled and subjected to molecular filtration units with a 30 kDa MWCO membrane in order to remove the proteins which had molecular mass of 30 kDa or higher. Both obtained retainate and filtrate showed the brown color. Subsequently, the filtrate which considered containing Mb was concentrated using a 10 kDa MWCO membrane. The protein fractions separated by molecular filtration were then analyzed using SDS-PAGE (Fig. 4). The 30 kDaretainate showed many protein bands with molecular mass of ³14.4 kDa to £ 94 kDa. The 10 kDaretainate showed two major bands with molecular mass of less than 30 kDa and of 15 kDa. These two bands were also found in the 30 kDaretainate. It could be possible that the fish Mb may be composed of two forms of Mb. One of the two forms might be in the form of free molecule. The other one might be weakly associated with other proteins which could not be filtrated through 30 kDa MWCO membrane.
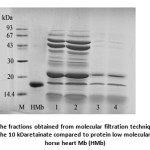 |
Figure 4: SDS-PAGE of the fractions obtained from molecular filtration technique; lane 1, 2: the 30 kDaretainate, lane 3, 4: the 10 kDaretainate compared to protein low molecular mass standards (M) and horse heart Mb (HMb) |
In order to confirm the hypothesis, the 30 kDa and 10 kDaretainate was then applied to DEAE-cellulose column, the elution profile of the 30 kDaretainate showed two peaks (Fig. 5 (a)). The fraction No. 11 and 12 which had high Soret absorption at 408 nm and showed brown color were analyzed on SDS-PAGE (Fig. 5 (b)). These fractions contained two bands, the major band was found at >14.4 kDa which expected to be fish Mb and the minor band was found at 20 kDa. Moreover, the elution profile of the 10 kDaretainate obtained from DEAE-cellulose column also showed two peaks (Fig. 6 (a)). The fractions which exhibited brown color and high Soret absorption (fraction No. 9 and 10) were determined by SDS-PAGE (Fig. 6 (b)). It contained two bands similar to the fractions of 30 kDaretainate.
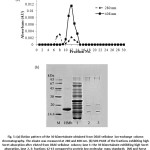 |
Figure 5: (a) Elution pattern of the 30 kDaretainate obtained from DEAE-cellulose ion-exchange column chromatography. The eluate was measured at 280 and 408 nm. (b) SDS-PAGE of the fractions exhibiting high Soret absorption after eluted from DEAE-cellulose column; lane 1: the 30 kDaretainate exhibiting high Soret absorption, lane 2, 3: fractions 12-13 compared to protein low molecular mass standards (M) and horse heart Mb (HMb) |
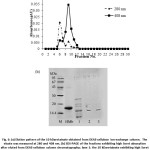 |
Figure 6: (a) Elution pattern of the 10 kDaretainate obtained from DEAE-cellulose ion-exchange column. The eluate was measured at 280 and 408 nm. (b) SDS-PAGE of the fractions exhibiting high Soret absorption after eluted from DEAE-cellulose column chromatography; lane 1: the 10 kDaretainate exhibiting high Soret absorption, lane 2, 3: fractions 9-10 compared to protein low molecular mass standards (M) and horse heart Mb (HMb) |
From the results, it could be indicated that the striped snake-head Mb may be presented in two-forms. One of them is free Mb molecule and the other is protein bound Mb. Moreover, each form of Mb showed two bands which both bands were probably fish Mb.In addition, the fractions containing Mb of both 30 kDa and 10 kDaretainates obtained from DEAE-cellulose column were separately pooled and concentrated. Each of the pooled fractions was subjected to determine its spectrum by UV-Vis spectrophotometry. Both spectra showed high intensity of the Soret band at 410 nm and showed high UV-Visible absorption ratio of 408/280 nm (Fig.7 (a) and (b)). These results also confirmed that both of the purified protein is fish Mb. It could be concluded that the Mb of the striped snake-head fish could be successfully purified by column chromatography combined with molecular filtration technique. The yield of the striped snake-head fish Mb was 0.95 mg/g wet weight of muscle.
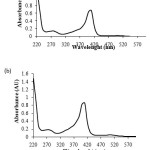 |
Figure 7: UV-Visible spectra of the purified Mb obtained from DEAE-cellulose column of (a) the 30 kDaretainate (b) the 10 kDaretainate |
Identification and characterization of myoglobin
Identification and characterization of fish Mb are required to prove whether the purified proteins were expected to be Mbs. This study was performed by using gel electrophoresis, UV-Visible spectrophotometry, spectrofluorophotometry, MALDI-TOF-MS, and LC-MS/MS.
Spectral properties of fish Mb
The purified Mb was characterized in terms of absorption properties and tryptophan fluorescence quenching using UV-Visible spectrophotometer and spectrofluorophotometer, respectively. Although, the purified protein obtained from DEAE-cellulose column of the 30 kDa and 10 kDaretainate showed two bands, the major band of both purified protein had an apparent molecular mass of about 15 kDa (Fig. 5 (b) and 6 (b)) The UV-Vis spectra of the purified protein exhibited maximum absorption at 280 and 410 nm which the later is the Soret peak of Mb (Fig. 7). Moreover, both purified proteins gave very high ratio of 408/280 nm of 4.77 and 4.79, respectively. In general, the ratio of the Soret absorbance to protein absorbance of highly purified Mb is higher than 4-fold26,27. Thus, these absorbance ratio data indicated that these purified proteins should be Mb.
The intrinsic tryptophan fluorescence of the purified proteins was measured. The protein fluorescence was excited at 280 nm and observed at 330 nm. Most of an emission is due to the excitation of tryptophan residues and with a few emissions due to tyrosine and phenylalanine. Mb, the heme containing protein, has been demonstrated to quench the tryptophan fluorescence. Fig.8 shows that the fluorescence of the purified proteins at 330 nm gave low intensity similar to that of horse heart Mb and the intensity is also lower than that of BSA. It is proposed that the purified proteins have the heme pocket. Therefore, both of the purified proteins should be the striped-snake-head fish Mb.
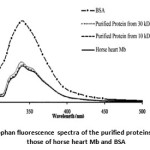 |
Figure 8: Tryptophan fluorescence spectra of the purified proteins compared to those of horse heart Mb and BSA |
Molecular mass of fish Mb
From SDS-PAGE of the purified striped snake-head fish Mb obtained from both 30 and 10 kDaretainate, the relative molecular mass of the fish Mbs was estimated by interpolation using a standard plot of log molecular mass versus relative migration distance. The purified fish Mbs exhibited their molecular mass of about 15.0 kDa and 21.0 kDa for a major and a minor band, respectively. Their molecular mass was then confirmed using MALDI-TOF-MS analysis. The molecular mass of the fish Mb obtained by this method was 15,597.68 Da. The mass spectrum also showed a very small peak at m/z of 23,509.42 (Fig. 9). The MS result corresponds to the protein bands which appeared on SDS-PAGE. The molecular mass of the striped snake-head fish Mb was quite similar to Mbs from the tolerant fish, Asian swamp eels28. Also, the molecular mass of the fish Mb was closed to some marine fishes such as mackerel, sardines, and tuna species24,29-33.
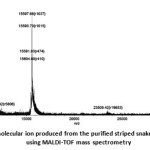 |
Figure 9: The molecular ion produced from the purified striped snake-head fish Mb using MALDI-TOF mass spectrometry |
Partial amino acid sequence of striped snake-head fish Mb
Amino acid sequence analysis by in-gel tryptic digestion and LC-MS/MS
In order to confirm that the purified protein is fish Mb, the partial amino acid sequence has been identified. The purified major protein band with molecular mass of about 15.0 kDa obtained from SDS-PAGE with Coomassie Brilliant blue staining was excised from the gel. The excised band was digested with trypsin and analyzed for the peptide fragments by LC-MS/MS performed at the Genome Institute, BIOTEC, Pathumthani, Thailand.
The obtained peptide fragment was sequenced by de novo sequencing method. The de novo sequencing method refers to the process of deriving the sequence without the use of databases by assuming the existence of peaks of all amino acids which contained in MS-MS spectrum. The de novo peptide-sequencing approaches use only the peak interval of mass-to-charge ratio (m/z) in the MS-MS spectrum; this spectrum consists of 2D values of m/z and ion intensity and amino acid cleavage intensity ratio34.
Two peptide sequence tags of the purified protein obtained from LC-MS/MS are “RDAAGQQALR”and “RYGSLVLTR”. The MS-MS spectra of both tags are shown in Fig. 10. These sequence tags obtained from de novo sequencing were subjected to a homology search using BLAST. The results showed that the two peptide sequences were identical to parts of Mb from some marine fishes; South Georgia icefish (Pseudochaenichthysgeorgianus), spotted green pufferfish (Tetraodonnigroviridis) and Pacific bonito (Sardachiliensis) (Table 1). Therefore, it was certainly found that this purified protein was the striped snake-head fish Mb.
 |
Figure 10: MS/MS spectrum for peptide of the striped snake-head fish Mb (a) RDAAGQQALR and (b) RYGSLVLTR |
Table 1: Comparisons of the two sequence tags of the 15.0 kDa purified protein with full amino acid sequences of fish Mbs by using database search (ExPASy Proteomics Server). All residues corresponding to
| Mb source | Amino acid sequence |
| South Georgia icefish (Pseudochaenichthysgeorgianus) Spotted green pufferfish (Tetraodonnigroviridis)
Pacific bonito (Sardachiliensis) |
MADFDMVLKC WGLVEADYAT YGSLVLTRLF TEHPETLKLF PKFAGIAHGD LAGDAGVSAHGATVLNKLGD LLKARGGHAA LLKPLSSSHA TKHKIPIINF KLIAEVIGKV MEEKAGLDAAGQTALRNVMA VIIADMEADY KELGFTE
MGDFDMVLKF WGPVEADYSA HGGMVLTRLF TENPETQQLF PKFVGIAQSE LAGNAAVSAH GATVLKKLGE LLKAKGNHAA ILQPLANSHA TKHKIPIKNF KLIAEVIGKV MAEKAGLDTA GQQALRNIMA TIIADIDATY KELGFS
MADFDAVLKF WGPVEADYTS HGGLVLTRLF KEHPETQKLF PKFTGIAQAD MAGNAAISAH GATVLKKLGE LLKAKGNHAA ILKPMANSHA TKHKIPINNF KLISEIIVKV MQEKAGMDAG GQQALRNVMA AVIADLEANY KELGFSG
|
Accession number of cited sequence as follows: South Georgia icefish; Q9DEP1.3; spotted green pufferfish, Q701N9.4; Pacific bonito, Q9DGJ0
Degradation
Because the LC-MS/MS method with trypsin digestion gave only two peptide sequences of the fish Mb, the other amino acid sequencing method was used to generate other amino acid sequence tags for getting more structural information. To increase possibility for obtaining different protein sequence tags, we use Lys-C endoproteinase which cut peptide chain at the site different from trypsin. Trypsin hydrolyzes peptide bond at the carboxyl side of lysine or arginine while Lys-C endoproteinase hydrolyzes specifically at the carboxyl side of lysine. Therefore, the purified striped snake-head Mb solution was subjected to Lys-C endoproteinase digestion, to form a set of peptides and then sequenced.
The peptides were then separated by reversed-phase HPLC and collected for analysis of their sequence. The separation of eleven digested peptides is shown in Fig. 11.The amino acid sequence of each isolated peptide fragments was then determined by N-terminal amino acid sequence analysis using automated Edman degradation. Only four fragments (fraction No. 1, 5, 10 and 11) can be sequenced by this method. Their amino acid sequences of Lys-C digested peptide are shown in Table 2.
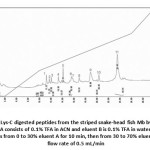 |
Figure 11: Separation of Lys-C digested peptides from the striped snake-head fish Mb by HPLC on 8 x 0.62 cm, i.d. C8 column. Eluent A consists of 0.1% TFA in ACN and eluent B is 0.1% TFA in water. Elution was obtained by two gradient steps from 0 to 30% eluent A for 10 min, then from 30 to 70% eluent A for 16 min with a flow rate of 0.5 mL/min |
Table 2: Amino acid sequence of Lys-C digested peptide from the purified fish Mb using automated Edman degration
|
Fragment No. |
Sequence |
|
1 5 10 11 |
HNIPAYGSHASKILFVSIPLADAGKKMTRK |
According to BLAST searching, the peptide sequences of the fish Mb obtained from Edman degradation showed that only some of amino acid residues identical to part of amino acid sequences of Mb from other animals. It is probably suggested that the amino acid sequence of the striped snake-head fish Mb might be different from other Mbs. Therefore, in order to solve and confirm that these amino acid residues obtained from Edman degradation are correct, the complete amino acids sequences of the striped snake-head fish Mb is further determined from its cDNA.
Conclusion
Myoglobin (Mb) was isolated from ordinary muscle of stripped snake-head fish. The crude extract was fractionated by salting out and separated using both Sephadex G-75 and DEAE-cellulose column chromatography, and by molecular size membrane filtration, giving two bands with molecular mass of 15 kDa as the major band and 20 kDa as minor band on SDS-PAGE, similar to the mass spectrum data that obtained from MALDI-TOF-MS (15.58 and 23.50 kDa). UV-visible spectra of both purified proteins exhibited maximum absorption at 280 and 410 nm corresponding with Mb characteristics. Their tryptophan fluorescence appeared at 330 nm also corresponding with horse heart Mb. The partial peptide sequences of 15 kDa protein band expected to be the fish Mb, were obtained from LC-MS/MS with in-gel trypsin digestion. It was found that the peptide sequences were homologous with those of some fish. From the results, it considerably reflects that the 15 kDa protein should be a novel fish Mb which might be present as two-type Mbs. One type of the Mb might be free form while another type is either Mb binding with other proteins or the 20 kDa protein isoforms. In addition, the purified Mb was also determined for its partial peptide sequence by digestion with Lys-C endoproteinase and analysis of amino acid sequence using Edman degradation. The amino acid sequences of Lys-C-digested peptide gave only some of amino acid residues that are identical to Mb from other fish species. It is possible that the amino acid sequence of this fish Mb may be different from that of other fish Mbs.
Acknowledgements
The research funding supported by Center of Excellence for Innovation in Chemistry (PERCH-CIC), Commission on Higher Education, Ministry of Education,and Ratchamangakala University of Technology Isan, KhonKaen, Thailand was gratefully acknowledged.
References
- Boonyaratparin, M.; Mccoy, E.W.; Chittapalapong, T. Snake head culture and its socio-economics in Thailand. Food and Agricultural Organization of the United Nations Project reports, Fisheries department, Thailand, 1985.
- Jones, N.B.; Wang, C.C.; Dwulet, E.F.; Lehman, D.L.; Meuth, L.J.; Bogardt, A.R.; Gurd R.N.F. Biochi. Biophys. Acta – Protein structure1979, 577, 454-463.
CrossRef - Kooyman, G.L.; Ponganis. P.J. Annu. Rev. Physiol.1998, 60, 19-32.
CrossRef - Maeda, N.; Fitch, W.M. J. Biol. Chem.1982, 257, 2806-2815.
- Peter, W.M.; Michael, J.B.; Michael, E.V.; Robert, E.C. Comp. Biochem. Physiol. B 2004, 137(3), 341-350.
CrossRef - Birnbaum, G.I.; Evans, S.V.; Przybylska, M.; Rose, D,.R. ActaCryst. 1994, D50, 283-289.
- Chaijan, M.; Benjakul, S.; Visessanguan, W.; Faustman, C. Food Chem. 2007, 100, 156–164.
CrossRef - Steers, Jr.E.; Davis, Jr.R.H. Comp. Biochemi. Physiol. B 1979, 62(4), 393-402.
CrossRef - Tsubamoto, Y.; Matsuoka, A.; Yusa, K.; Shimaka, K. Eur. J. Biochem. 1990, 193, 55-59.
CrossRef - Kendrew, J.C.; Dickerson, R.E.; Strandberg, B.E.; Hart, R.G.; Davies, D.R.; Phillips, D.C.; Shore, V.C. Nature 1960, 185, 422-427.
CrossRef - Phillips, S.E.V.; Schoenborn, B.P. Nature1981, 292, 81-82.
CrossRef - Wittenberg, B.A.; Wittenberg, J.B. Proc. Natl. Acad. Sci. USA. 1987, 84, 7503-7507.
CrossRef - Edmunson, A.B. Nature1965, 205, 883-887.
CrossRef - Gidding, G.G. Crit. Rev. Food Sci. Techno.1973, 35, 117-140.
- Postnikova, G.B.; Tselikova, S.V.; Kolaeva, S.G.; Solomonov, N.G. Comp. Biochem. Physiol. B1999, 124(1), 35-37.
CrossRef - Livingston, D.J.; Brown, W.D. Food Technol.1981, 35(5), 244-252.
- Fosmire, G.J., Brown, W.D. Comp. Biochem. Physiol.1976, 55B: 293-299.
- Chen, H.H. J. Food. Sci.2003, 68, 1416-1419.
CrossRef - Chen, L.C.; Lin, S.B.; Chen, H.H. Fish. Sci.2004, 70, 293-298.
CrossRef - Chow, C.J.; Wu, J.C.; Lee, P.F.; Ochiai, Y. Comp. Biochem. Physio. B2009, 154, 274-281.
CrossRef - Chanthai, S.; Ogawa, M.; Tamiya, T.; Tsuchiya, T. Fish. Sci.1996, 62, 927–932.
CrossRef - Laemmli, U.K. Nature1970, 227, 680-685.
CrossRef - Bradford, M. Anal. Biochem.1976, 72, 248-254.
CrossRef - Beavis, R.C.; Chait, B.T. Anal. Chem.1990, 62, 1836–1840.
CrossRef - Strader, M.B.; Tabb, D.L.; Hervey, W.J.; Pan, C.L.; Hurst, G.B. Anal. Chem.2006, 78,125–134.
CrossRef - Maclendon, G.; Murphy, P. J. Biochem.1979, 225, 4035-4090.
- Helbe, S.; Fago, A. Am. J. Physiol. Regul. Integr. Comp. Physiol.2011, 300, R101- R108.
CrossRef - Chotichayapong, C.; Wiengsamut ,K.; Chanthai, C.; Sattayasai, N.; Tamiya, T., Kanzawa, N.; Tsuchaya, T. Fish Physiol. Biochem.2012, 38, 1533-1543.
CrossRef - Watts, D.A.; Rice, R.H.; Brown, W.B. J. Biol. Chem.1980, 255, 10916–10924.
- Wen, L.C.; Chau, J.C. J. Food Biochem. 2001, 25, 157–174.
CrossRef - Ueki, N.; Chaujen, C.; Ochiai, Y. J. Agric. Food Chem. 2005, 53, 4968-4975.
CrossRef - Ochiai, Y.; Watanabe, Y.; Ozawa, H.; Ikegami. S.; Uchida. N.; Watanabe, S. Biosci. Biotechnol. Biochem. 2010, 74, 1673-1679.
CrossRef - Liong, E.C.; Dou, Y.; Scott, E.E.; Olson, J.S.; Phillips, G.N. Jr. J. Biol. Chem. 2001, 276, 9093-9100.
CrossRef - Kapp, E.A.; Schüz, F.; Reid, G.E.; Eddes, J.S.; Moritz, R.; O’Hair, R.A.; Speed, T.P.; Simpsom, R.J. Anal. Chem.2003, 75, 6251–6264.
CrossRef

This work is licensed under a Creative Commons Attribution 4.0 International License.
![]()
A New Edition of Web of Science
Journal Impact Factor
2022: 0.5
Five Year: 0.8
Journal is Indexed in

Cabells Whitelist
![]()


