Phosphorus removal and recovery from high phosphorus wastewater by the HAP crystallization process
Yu Menglin1, Yin Danyang2, Shi Jing1*, Song Duanmei1 and Xu Zhengwen2
1School of Engineering, China Pharmaceutical University, China
2Department of Environmental Science and Engineering, Nanjing University of Information Science and Technology, China
Corresponding author E-mail: shijing_cpu@163.com
DOI : http://dx.doi.org/10.13005/ojc/320125
Article Received on :
Article Accepted on :
Article Published : 03 Mar 2016
In the experiment, the crystallization process was compared with the chemical precipitate process for phosphorus removal efficiency. Calcites were used as seeds to remove and recover phosphorus from synthetic phosphorite wastewater. The results indicated that under the same wastewater compositions, the crystallization process showed better phosphorus removal performance. At the initial stage, the corresponding removed Ca/P ratio (DCa/DP) was 1.43:1. When the phosphorus concentration was low, phosphorus could be removed further in the crystallization system, whereas the chemical precipitation stopped. During the reaction, calcium concentration firstly decreased because of precipitation or crystallization. Then it slightly increased, which possibly resulted from the transformation of HAP precursor or the dissolution of calcite seeds. The effects of pH, initial phosphorus concentration and Ca/P ratio were investigated. Phosphorus removal and recovery efficiency increased with the increment of the above three factors. In addition, the Response Surface Methodology was used to optimize the related factors. A significant quadratic model was obtained. From the optimization results, it could be found that when pH value was 9.0, molar ratio was 1.07 and reaction time was 36 h, the phosphorus removal rate could reach 96.1%.
KEYWORDS:calcite; hydroxyapatite; phosphorus recovery; phosphorus wastewater
Download this article as:| Copy the following to cite this article: Menglin Y, Danyang Y, Jing S, Duanmei S, Zhengwen X. Phosphorus removal and recovery from high phosphorus wastewater by the HAP crystallization process. Orient J Chem 2016;32(1). |
| Copy the following to cite this URL: Menglin Y, Danyang Y, Jing S, Duanmei S, Zhengwen X. Phosphorus removal and recovery from high phosphorus wastewater by the HAP crystallization process. Orient J Chem 2016;32(1). Available from: http://www.orientjchem.org/?p=14553 |
Introduction
Phosphorus is one of the limiting elements for eutrophication1. An excessive discharged phosphorus in water bodies leads to algal blooms, resulting in the reduction of available oxygen and the deterioration of the water quality2. The amounts of phosphorus in some types of wastewater are considerable, such as industrial wastewater3, swine wastewater4, agricultural wastewater5, pharmaceutical wastewater6and phosphorite wastewater7-8.
On the other hand, phosphorus is a nonrenewable resource and becoming rarer. And it has no substitute in the nature9. However the demand for phosphate rock is continually growing. According to the statistics from United States Geological Survey, the phosphorus rock production in 2009 around the world was 166 million tons, which were 181 million tons in 2010 and 198 million tons in 201110-12. Consequently, much attention has been paid to phosphorus recovery from wastewater to realize the sustainable utilization of phosphorus. Struvite (MAP, MgNH4PO4) and hydroxyapatite (HAP, Ca5(PO4)3 OH) crystallization processes are the main methods. In the above process, crystals of MAP or HAP are formed by the following reactions.
Mg2+ + PO43- + NH4+ + 6H2O → MgNH4PO4·6H2O (1)
10Ca2+ + 6PO43- + 2OH– → Ca10 (PO4)6(OH)2 (2)
By the above methods, some researchers have recycled phosphorus from various kinds of wastewaters, using different materials as seeds. Chen utilized xonotlite as the seed to recover phosphorus from the supernatant of concentrated sludge. The removal efficiency reached 91.3% after 24 h reaction13. Powdered converter slag was used as a seed material to recover phosphorus in the membrane-filtrate wastewater by Eung-Ho Kim14. High concentration of phosphorus was deposited on the surfaces of seed particles in the form of HAP. In this study, calcites were used as the seeds to remove and recover phosphorus from synthetic phosphorite wastewater.
As stated above, the phosphorus concentration in phosphorite wastewater is high. In order to recover phosphorus, in this experiment chemical precipitate process was compared with crystallization process for the same synthetic phosphorite wastewater. Due to the low ammonia concentration, HAP was considered as the suitable recovery crystallization process. As the main factors, the effect of initial phosphorus concentration, pH value, molar ratio of calcium and phosphorus and reaction time on the removal efficiency were investigated. Furthermore, Design Expert software was used to optimize the related factors.
Materials and Methods
Synthetic phosphorite wastewater
The phosphate concentration of the water samples was from 30 to 120 mg/L, and COD was about 100 mg/L. The wastewater was prepared by potassium dihydrogen phosphate (KH2PO4) and acetic acid (CH3COOH). pH was adjusted with the solution of hydrochloric acid (HCl), sodium hydroxide (NaOH). Calcite was used as the seed.
Experimental procedure
The experiments were carried out in a constant-temperature air-bathing shaker at 25 ℃ with the rotational speed 120 r/min. The other parameters were listed in Table 1. The water samples were filtrated by 0.45µm membranes before analysis at different time intervals.
Table 1: The parameters in the experiments
|
Factor |
Phosphorus concentration / mg·L-1 |
Ca/P* |
pH value |
|
pH value |
60 |
0.9 |
5,7,9 |
|
Ca/P* |
60 |
0.6, 0.9, 1.2, 1,5, 1.8 |
9 |
|
Phosphorus concentration |
30,60,90,120 |
0.9 |
9 |
*: mole ratio.
Analytical Methods
pH was instrumentally measured by Sartorius PB-10 pH meter. Phosphorus was determined in accordance with ammonium molybdate spectrophotometric method15. And calcium ions were determined by an atomic absorption spectrometry (AAS) spectrometer. TOC was measured via a TOC analyzer (TOC-L-CPH, Shimadzu, Japan). The analyses of Response Surface Methodology (RSM) were used for parameter optimization by Design expert software.
Results and Discussion
Comparison of induced crystallization and chemical precipitation
As shown in Fig.1, compared to chemical precipitation, crystallization obtained better phosphorus removal efficiency. At the initial stage, the two systems showed similar performance. After 6 hours, when the phosphorus concentration in the solution was low, in the crystallization system phosphorus could be removed continuously, whereas the removal was stopped in the precipitation system. The interface energy could be reduced by the calcite seeds, so phosphate and calcium were retained in the form of crystallization on seed surface. Moreover, in comparison with precipitation system, the product achieved by crystallization had less water content, which was easier to be separated and reused as fertilizer16-17. It is additional advantage of crystallization.
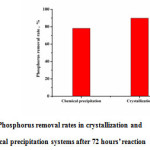 |
Figure 1: Phosphorus removal rates in crystallization and chemical precipitation systems after 72 hours’ reaction |
Variations of calcium and phosphorus in the induced crystallization system
In the induced crystallization system, the content of soluble phosphate decreased rapidly in 12h (Fig.2), declined with the reaction time and tended to a balance. Phosphorus removal efficiency reached almost 100%. The initial phosphorus concentration was 60 mg/L, but after calcium was added the concentration it immediately dropped to 30 mg/L. Inevitably, calcium phosphorus precipitation was formed because of the supersaturation. About 30 mg/L phosphorus and 58 mg/L calcium were removed from the solution immediately after mixing, and the corresponding removed Ca/P ratio (DCa/DP) was 1.43:1. Consequently, it could be inferred that the possible formation of precipitate was Ca3(PO4)2, with the Ca/P ratio of 1.5. When the phosphorus concentration was low, phosphorus could be removed further, which indicated that the induced crystallization could still occur whereas the chemical precipitation was stopped. At the low phosphorus and calcium concentrations, the interfacial energy was reduced by the calcite seed, so the phosphate crystals deposited on the surfaces of calcite. HAP could grow on under metastable state by the seed in the crystallization13.
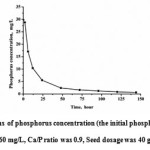 |
Figure 2: The variations of phosphorus concentration (the initial phosphorus concentration was 60 mg/L, Ca/P ratio was 0.9, Seed dosage was 40 g/L, pH value was 9) Click here to View figure |
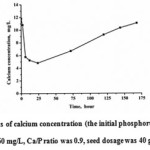 |
Figure 3: The variations of calcium concentration (the initial phosphorus concentration was 60 mg/L, Ca/P ratio was 0.9, seed dosage was 40 g/L, pH value was 9) Click here to View figure |
Within 24 h, the average DCa/DP ratio was 1:5, much less than the DCa/DP ratio at the initial stage. In addition, the calcium had a slight increase after 24h. There were two possible reasons for this phenomenon. Firstly, the main form of calcite seed was calcium carbonate, which could provide calcium ions. Secondly, the precursor of HAP was transformed, making the Ca/P ratio change, and consequently partial of the calcium dissolved. The increased calcium ions were beneficial to restrain the phosphorus concentration in the solution.
The effect of pH on the recovery of phosphorus crystallization
It could be observed from Fig.4 that the efficiency of phosphate removal was improved at higher pH value. Furthermore, as shown in Fig.5, the removal processes was in accordance with pseudo-second-order kinetics equation during 0~48 h. The reaction rate constant increased with the increase of pH values. However, this did not mean that the higher pH could improve the crystallization quality. When pH was higher than 9, the bicarbonate ion would transform into carbonate ion, resulting in the calcium carbonate precipitate, mixed with the calcium phosphorus product13.
From Fig.6, it could be seen that when the pH was higher than 7, the calcium concentration reduced during 0~24 h, indicating the precipitation or crystallization occurred. But, at pH 5 the calcium increased due to the dissolution of the calcite seeds at weak-acid condition. After 24 h, the concentration of calcium increased slightly with the time. The concentration of TOC in the process of the whole reaction basically remained unchanged, indicating that no organic matter was adsorbed on the seed surface, so the presence of organic matter would not affect the crystallization.
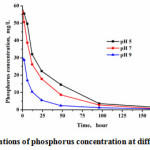 |
Figure 4: The variations of phosphorus concentration at different pH values Click here to View figure |
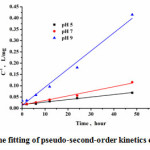 |
Figure 5: The fitting of pseudo-second-order kinetics equation |
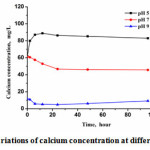 |
Figure 6: The variations of calcium concentration at different pH values Click here to View figure |
Effect of Ca/P ratio on the recovery of phosphorus crystallization
It can be seen from the Fig.7 that the Ca/P ratio had an impact on the recovery of crystallization. When the Ca/P ratio was 0.6, the removal rate of phosphorus was less than 90% within 96 h, which was significantly lower than the results of other Ca/P ratios. Although the better removal rate was achieved at higher Ca/P ratio, it was uneconomical to add excessive calcium for recovering phosphorus. High calcium dosage also resulted in the supersaturation, therefore the dominated reaction was calcium phosphorus precipitation, even though the phosphorus removal efficiency increased. When the Ca/P ratio was 1.8, phosphorus was removed about 90% immediately after mixing, demonstrating that chemical precipitation was the main reason for the phosphorus removal. From an economical point of view, it is better to choose 0.9 as the Ca/P ratio. When the Ca/P ratio was 0.9, the recovery rate of phosphate can reached 96% within 48 h.
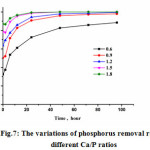 |
Figure 7: The variations of phosphorus removal rate at different Ca/P ratios |
Effect of initial phosphorus concentration
It was indicated from the Fig.8 that under different initial concentrations of phosphorus, the phosphorus decreased rapid in the initial stage and leveled off over 48 h. pH values also changed during the reaction. Judging from the reaction mechanism, at the initial period, phosphorus was mainly removed with homogeneous precipitate. The higher concentration of phosphorus in the solution, the more homogeneous precipitate occurred and the higher phosphorus removal rate was obtained. Then, the pH value increased, which possibly resulted from the transformation of HAP precursor and calcium carbonate coprecipation. With the decrease of phosphorus concentration, the heterogeneous crystallization dominated gradually. As mentioned before, after 12 h, the concentration of calcium ion slightly increased, probably due to the dissolution from calcite seed. From this point, if more phosphorus wastewater were added, the phosphorus removal could continue.
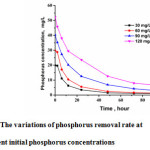 |
Figure 8: The variations of phosphorus removal rate at different initial phosphorus concentrations |
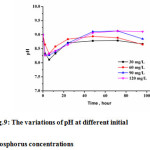 |
Figure 9: The variations of pH at different initial phosphorus concentrations Click here to View figure |
Optimization by the response surface method
The process was optimized for the important parameters like pH, time, and Ca/P ratio. The removal rate of phosphorus was considered as the foundation to ascertain the best optimized factor which was directed by using Box-Behnken design. Box-Behnken design which belongs to the response surface methodology (RSM) was used in order to demonstrate the nature of the response and to clarify the optimum states of the most important independent variables18. Three major variables were time, pH and Ca/P ratio. These factors were tested at three different levels (low, basal, high) as shown in Table 2. According to the Box-Behnken design for three variables, a significant quadratic model (P-value < 0.0001) was obtained by using analysis of variance (ANOVA), which was listed as follows. The phosphorus removal rate= -283.89255 +40.50968 (pH) + 221.17606 (Ca/P ratio) + 3.69905 (time) – 2.94167 (pH)×(Ca/P ratio) -0.21958 (pH)×(time) -0.71806 (Ca/P ratio)×(time) -1.49864 (pH)2 – 79.26263 (Ca/P ratio)2 – 0.011692 (time)2.
Table 2: The actual and predicted values of phosphorus removal rates
|
Standard order |
pH |
Ca/P |
Time |
Actual Value |
Predicted Value |
|
1 |
7 |
0.6 |
12 |
36.5 |
37.2 |
|
2 |
9 |
0.6 |
12 |
61.1 |
61.4 |
|
3 |
7 |
1.2 |
12 |
67.2 |
66.7 |
|
4 |
9 |
1.2 |
12 |
85.9 |
87.5 |
|
5 |
7 |
0.6 |
36 |
67.0 |
65.2 |
|
6 |
9 |
0.6 |
36 |
78.6 |
79.0 |
|
7 |
7 |
1.2 |
36 |
84.9 |
84.5 |
|
8 |
9 |
1.2 |
36 |
95.5 |
94.7 |
|
9 |
7 |
0.9 |
24 |
70.3 |
72.2 |
|
10 |
9 |
0.9 |
24 |
90.8 |
89.4 |
|
11 |
8 |
0.6 |
24 |
63.4 |
63.9 |
|
12 |
8 |
1.2 |
24 |
86.4 |
86.5 |
|
13 |
8 |
0.9 |
12 |
73.9 |
71.8 |
|
14 |
8 |
0.9 |
36 |
86.8 |
89.5 |
|
15 |
8 |
0.9 |
24 |
80.8 |
82.3 |
|
16 |
8 |
0.9 |
24 |
81.0 |
82.3 |
|
17 |
8 |
0.9 |
24 |
87.1 |
82.3 |
|
18 |
8 |
0.9 |
24 |
81.8 |
82.3 |
|
19 |
8 |
0.9 |
24 |
82.8 |
82.3 |
|
20 |
8 |
0.9 |
24 |
81.8 |
82.3 |
The corresponding analysis of variance (ANOVA) showed the variables that were extremely significant were the square term of Ca/P ratio. Furthermore, the linear effect of pH, and Ca/P ratio and time were significant at the level of p-value<0.001. The 3D plots for the relation between two variables were illustrated in Fig.10. From the optimization results, when pH value was 9.00, Ca/P ratio was 1.07 and reaction time was 36 h, the phosphorus removal rate can reach 96.1%.
 |
Figure 10: 3D surface plots of the removal rate of phosphorus as a function: (a)Ca/P ratio and pH, (b) time and pH, (c) time and Ca/P ratio. |
Conclusion
In the experiment, the crystallization process was compared with the chemical precipitate process for phosphorus removal efficiency. Under the same wastewater compositions, the crystallization process showed better phosphorus removal performance. During the crystallization reaction, calcium concentration firstly decreased because of precipitation or crystallization. Then it slightly increased, which possibly resulted from the transformation of HAP precursor or the dissolution of calcite seeds. Phosphorus removal and recovery efficiency increased with the increment of the pH, initial phosphorus concentration and Ca/P ratio. Moreover, a significant quadratic model was obtained by the Response Surface Methodology. The optimization results showed that when pH value was 9.0, molar ratio was 1.07 and reaction time was 36 h, the phosphorus removal rate could reach 96.1%.
Acknowledges
This research has been supported by the National Natural Science Foundation of China (51408612), the Natural Science Foundation of Jiangsu Province (BK20140660) and the Fundamental Research Funds for the Central Universities (2015PT002).
Reference
- Oladoja, N. A.; Ololade, I. A.; Adesina, A.O.; Adelagun,R. O. A.; Sani,Y. M. Chem. Eng. Res. Des. 2013, 91, 810-818
CrossRef
- Lürling, M.; Oosterhout, F.V. Water. Res. 2013, 47, 6527-6537}
CrossRef - Huang, Y H; Shih, Y. J.; Chang, C. C.; Chuang, S. H. Desalin. Water Treat. 2011, 32, 351-356
CrossRef - Suzuki, K.; Tanaka,Y.; Kuroda, K.; Hanajima, D.; Fukumoto, Y. Bioresour. Technol. 2005, 96, 1544-1550
CrossRef - Yi, W. G.; Lo, K. V. J. Environ. Sci. Health., Part B. 2003, 38, 501-509
CrossRef - Qiu, G. L.; Song, Y. H.; Zeng, P.; Xiao, S.; Duan, L. Chemosphere. 2011, 84, 241-246
CrossRef - Xu, C. W.; Gao, H. L. Environ. Technol. 2004, 4, 25-28
- Lu, Y. Research on Treatment and Reuse Technic of Phosphorite Processing wastewater. PhD thesis, Wuhan University of Technology, Wuhan, 2010.
- Shu, L.; Schneider, P.; Jegatheesan, V.; Johnson, J. Bioresour Technol. 2006, 97, 2211-2216
CrossRef - U.S. Geological Survey. Mineral Commodity Summaries 2011. U.S. Government Printing Office, Washington, 2011.
- U.S. Geological Survey. Mineral Commodity Summaries 2012. U.S. Government Printing Office, Washington, 2012.
- U.S. Geological Survey. Mineral Commodity Summaries 2013. Washington U.S. Government Printing Office, Washington, 2013.
- Chen, X. C.; Kong, H. N.; Wu, D. Y.; Wang, X. Z.; Lin, Y.Y. J. Environ. Sci. 2009, 21, 575-580
CrossRef - Kim, E. H.; Yim, S. B.; Jung, H. C.; Lee, E. J. J. Hazard. Mater. 2006, 136, 690-697
CrossRef - American Public Health Association, American Water Works Association and Water Environment Federation. Standard Methods for the Examination of Water and Wastewater. American Standard, 2006.
- Mañas, A.; Biscans, B.; Spérandio, M. Water. Res.2011, 45, 3776-3786
CrossRef - De-Bashan, L. E.; Bashan, Y. Water. Res. 2004, 38, 4222-4246
CrossRef - Box, G. E.; Wilson, K. B. J. R. Statist.Soc.1951, 13, 1-45

This work is licensed under a Creative Commons Attribution 4.0 International License.
![]()
A New Edition of Web of Science
Journal Impact Factor
2022: 0.5
Five Year: 0.8
Journal is Indexed in

Cabells Whitelist
![]()


