Chemically stabilized δ-Bi2O3 phase: Raman scattering and X-ray diffraction studies
2European Comission, Joint research center, Institute for Transuranium Elements (ITU), Postfach 2340, 76125 Karlsruhe, Germany.
3Departamento de Fisica de la Materia Condensada, Universidad del Pais Vasco, P.O.Box 644, Bilbao 48080, Spain.
4CIC Energigune, Parque Tecnológico, C/ Albert Einstein, 48, 01510 Miñano (Álava), Spain.
*Corresponding author E-mail: leila.loubbidi@gmail.com
DOI : http://dx.doi.org/10.13005/ojc/320105
Download this article as:
![]()
Thanks to its peculiar structural properties, the high temperature δ-phase of Bi2O3 is considered as the best oxide ion conductor. Many efforts to stabilize this structure at room temperature have been deployed. In the present study, we have successfully stabilized the δ-phase by chemically introducing tetra- Te4+ and pentavalent Ta5+ cations into the structure. A series of compounds with different percentage of Te4+/ Ta5+ were obtained. Their structural and vibrational properties were investigated. From the Rietveld refinement of X Ray diffraction pattern we show that the composition x = 0.2 crystallizes in the cubic symmetry, space group Fmm (ITA No. 225) with a lattice parameter a =5.49 Å. The reliability factors are: RF =2.151 % and RBragg=2.545 % confirm the goodness of the refinement. From the evolution of Raman bands, we confirm the existence of the solid solution features. Furthermore, comparing the spectra of δ-Bi2O3 with the alpha phase, we comfortably suggest that the decrease of the number of Raman bands is a consequence of an increase in the lattice symmetry. Similarly to other fluorite compounds, we show that the structure presents oxygen defects clearly identified in the Raman spectra.
KEYWORDS:Bi2O3; Ta2O5; TeO2; X-Ray diffraction; Raman spectroscopy;Bi2O3
Introduction
Although the importance of Bi2O3 in several industrial applications i.e, catalysis [1], multiferroics [2], ferroelectrics [3], fuel cells [4, 5], it is only recently that this compound has become under the close scrutiny of solid-states physicists and chemists. Much of the increased interest concerns a striking atomic-ordering transition in Bi2O3 during the heating and cooling cycle. It has been shown that Bi2O3 exists under various isomorphous phases that are: α-, β-, ɣ- and δ-Bi2O3 [6-8]. At room temperature and up to 730°C, Bi2O3 exists in a monoclinic α-phase
[1-3]. Above this temperature, Bi2O3 turns into a δ-phase and melts at approximately 825°C. During the cooling process, it transforms into tetragonal β- or ɣ- cubic phases between 630°C and 650°C depending on the experimental conditions. At about 550°C, it usually transforms back into α-phase. If the sample is not heated over 748°C, it will revert back into α-phase directly after a hysteresis at about 700°C [6].Interestingly, the high temperature cubic polymorph δ-phase of Bi2O3 presents peculiar conductive properties. It has the highest ionic conductivity among all the studied oxygen ion conductors [9]. This exceptional high conductivity is due to the hypo-stoichiometry of this material. The stoichiometry of the material requires 25% of the oxygen sublattice to be vacant [9, 10].
Aliovalent and isovalent doping are not only used to increase the ionic conductivity of a system, but in the case of Bi2O3 it is used to stabilize the high temperature δ-Bi2O3 phase, as shown by Takahashi et al: [9,10]. The δ-Bi2O3 can be obtained at room temperature by doping with some transition metal (Nb, Ta, V and W) and rare earth (Sm-Lu). It is also possible to use combination of oxides, so called double doping [11].
Recently, we have been aware of an original and a very sophisticated work [12], which aims of stabilizing the δ-Bi2O3 using highly coherent interfaces of alternating layers of Er2O3-stabilized δ-Bi2O3 and Gd2O3-doped CeO2. The authors in Ref. [12] demonstrate that the obtained layered material shows an exceptional high chemical stability in reducing conditions and redox cycles at high temperature, usually unattainable for Bi2O3-based materials. This suggests a need of pursuing research in this topic and exploring new designed materials that could be good candidates as the δ-Bi2O3.
Here, by introducing Ta5+/ Te4+ ions we have successfully stabilized the δ-Bi2O3 phase at room temperature. We have shown that this structure is also stable even with pentavalent-tetravalent cations. We provided for the first time a complete Raman spectroscopy study and combined it X-Ray diffraction. Thus, concrete structural information about the nature of the atomic ordering and the oxygen defect structure is obtained.
Experimental Procedur
Powder synthesis
The powder samples were prepared using high purity commercial materials Bi2O3, TeO2 and Ta2O5 of analytical grade MERCK, SCHARLAU and ALFA AESAR 99 % respectively. The batches of suitable proportions of starting products were mixed in an agate mortar and then heated at successively higher temperatures (700, 800 and 850°C for 24h each treatment) in air with several intermediate grindings and followed by quenching. All of them are quenched to room temperature. The positions of the chemical compositions under study inside the system Bi2O3-Ta2O5-TeO2 are shown in Fig. 1.
X-ray diffraction
The final products have been monitored by X-ray powder diffraction (XRD) using a Philips XPert PRO diffractometer and CuKα=1.5406 Å radiation. The structural refinements were undertaken from the powder data [13]. The patterns were scanned through steps of 0.02° (2θ), between 10° and 100° (2θ) with a fixed time counting of 100s. The study of the structure is conducted by analyzing the profile of X-ray diffraction diagrams of powder with the program Full prof [14] using the pseudo-Voigt function.
Raman spectroscopy
The Raman measurements were performed on Jobin Yvon T 64000 spectrometer; coupled with an optical microscope (x100 objective) and a CCD detector in a back scattering geometry. The λ = 532.5 nm line was used as excitation source. Rejection of the elastic peak was achieved using a holographic notchlter, which resulted in a cutting of the scattered signal below 100 cm-1. The laser power was maintained at 3 mW on the sample surface. The acquisition time was 30 s (3 accumulations).
Results And Discussions
Crystal structure analysis of Bi0.8Ta0.1Te0.1O1.65 composition, type δ-Bi2O3
The delta phase of bismuth oxide δ-Bi2O3 regarded as an anion deficient fluorite structure, where bismuth occupies the fcc sites, having a defect oxygen sublattice [11]. The structure of this oxygen sublattice has caused controversy.
In Ref [15], Sillen reported on a primitive cubic phase, space group Pmm, obtained by quenching Bi2O3. This cubic structure is related to the fluorite structure but has ordered defects in the oxygen sublattice in the [111] direction. Each Bi3+ ion has six oxygen neighbours arranged at six corners of a cube; two oxygens at diagonally opposite corners of the cube are missing [15]. The study by Gattow and Schröder into the δ-Bi2O3 system supposed that the cations occupied the 4a site and the oxygen atoms the 8c site with an average occupancy of 75% and a random distribution of vacancies [16]. The high oxide ion conductivity exhibited by δ-Bi2O3 is consistent with a structural model in which the oxide ion sites are 75% occupied in a statistical fashion [11, 16]. Willis also proposed a model where the six oxygen atoms are randomly distributed along four of the [111] directions from the regular tetrahedral sites towards the central octahedral vacant site, 32f, of the Fmm space group [17].
From analysis of neutron diffraction, Boyapati et al: concluded that the vacancies in doped Bi2O3 order [111] and [110] direction [18]. They showed that the oxygen atoms are displaced from 8c to the 32f sites. All three models are inconsistent with the observed experimental results, and consequently need modification to explain the complex structural changes.
Studies performed by Battle et al: [19] show the anion sublattice is a combination of the Gattow and Willis models (i.e., occupancy of both the 8c and 32f sites) and suggest the tendency for vacant oxygen sites to be arranged in the direction [111] configuration around the Bi atoms, as the formation of vacancy string is a well known feature of anion deficient fluorite materials. Based on neutron data, this latter is the consistent result (O(1) and O(2) occupied the sites 8c and 32f respectively) that we have adopted in our study for the structural resolution.
The doping of Bi2O3 by 5% Ta2O5 and 5% TeO2 (A: x=0.1) then by 10% TeO2 and 10% Ta2O5 (B: x=0.2) allowed us to stabilize the delta phase of bismuth oxide δ-Bi2O3. Indexing of X-ray powder diffraction pattern for the composition B was performed by means of the computer program DICVOL [20] and TREOR [21]. These computations give rather satisfactory results, showing that the XRD patterns can be fully indexed in a cubic system, Fmm (ITA No. 225) space group, with lattice parameter a=5.4853(1) Å, V = 165.05(1) Å3.
The X-ray diffraction spectra of the composition C(x=0.3) reveals that it’s a biphasic mixtures of the δ-Bi2O3 and Bi3TaO7 (Fig. 2). While the compositions D(x=0.6) (Fig. 3) and E(x=0.9) (Fig. 4) show the existence of the same mixture, Ta2Te2O9, Ta6Te7O29 and BiTaO4.
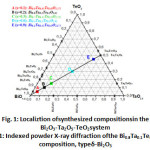 |
Figure 1: Localiztion ofsynthesized compositionsin the Bi2O3-Ta2O5-TeO2system |
Table 1: Indexed powder X-ray diffraction of the Bi0.8Ta0.1Te0.1O1.65 composition, type δ–Bi2O3
|
hkl |
Θ(°) |
dhkl (Å) (observed) |
dhkl (Å) (calculated) |
% |
|
111 |
14.06 |
3.170 |
3.167 |
100 |
|
200 |
16.29 |
2.746 |
2.743 |
40 |
|
220 |
23.38 |
1.940 |
1.939 |
34 |
|
311 |
27.74 |
1.655 |
1.654 |
32 |
|
222 |
29.09 |
1.584 |
1.583 |
8 |
|
400 |
34.15 |
1.3718 |
1.3713 |
4 |
|
331 |
37.72 |
1.2589 |
1.2584 |
9 |
|
420 |
38.88 |
1.2269 |
1.2266 |
7 |
|
422 |
43.45 |
1.1200 |
1.1197 |
4 |
|
511 |
46.85 |
1.0558 |
1.0556 |
4 |
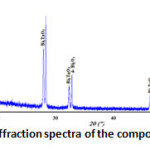 |
Figure 2: X-ray diffraction spectra of the composition C(x=0.3) |
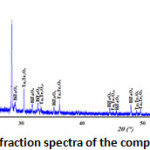 |
Figure 3: X-ray diffraction spectra of the composition D(x=0.6) |
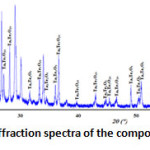 |
Figure 4: X-ray diffraction spectra of the composition E(x=0.9) |
The structural refinement of the composition B (x=0.2) was carried out by means of the Rietveld method using the Full prof program [14] integrated in WinPlotr pack, in a field angle 10≤2≤99.99° with a step of 0.01°/min. All the structural parameters and the vesting conditions are summarized in Table 2. Rietveld refinements of X-ray powder diffraction data indicate that the atomics positions are: Bi, Ta and Te in (4a). O occupied the sites 8c and 32f respectively. The reliability factors are: Rf =2.27%, RBragg=3.03% and Rwp=18.8%.
The calculation of the sum of the bond-valence (BVS) appears to indicate that the atoms (Bi, Ta, Te) occupying the same site (4a) are 8 coordinated.
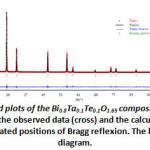 |
Figure 5: Final Rietveld plots of the Bi0.8Ta0.1Te0.1O1.65 composition, typeδ–Bi2O3. The upper symbols illustrate the observed data (cross) and the calculated pattern (solid line). The vertical markers show calculated positions of Bragg reflexion. The lower curve is the difference diagram. |
The variation with the addition of small amount of Ta2O5 and TeO2 in the matrix (BiO1,5)1-x(TaO2,5)x/2(TeO2)x/2 (x=0, x=0.1, x=0.2) shows a decrease of the lattice parameter a (Fig. 6). These results are justified by the difference of size between the ions Bi3+ (1.03 Å) Te4+ (0.97 Å) and Ta5+ (0.74 Å).
Table 2: Experimental details and crystallographic data for Bi0.8Ta0.1Te0.1O1.65 composition, type δ–Bi2O3
|
GE |
a (Å) |
angular range |
Step of measure |
Number of refined parameters |
Rp |
Rwp |
Rexp |
RB (%) |
X2 (%) |
RF (%) |
|
Fm-3m
|
5.4854 (2) |
10°<2θ< 99.99° |
0.01°/ min |
91 |
19.4 |
18.8 |
15.83 |
3.033 |
1.38 |
2.275 |
Table 3: Atomic positions and thermal factors agitation of the Bi0.8Ta0.1Te0.1O1.65 composition, type δ–Bi2O3
|
Atome |
Symmetry |
x |
Y |
z |
Biso |
Occ |
|
Bi |
4a |
0.00000 |
0.00000 |
0.00000 |
2.9823 (3) |
0.700(3) |
|
Ta |
4a |
0.00000 |
0.00000 |
0.00000 |
2.9823 (3) |
0.02500 |
|
Te |
4a |
0.00000 |
0.00000 |
0.00000 |
2.9823 (3) |
0.02500 |
|
O1 |
8c |
0.25000 |
0.25000 |
0.25000 |
0.20000 |
0.25000 |
|
O2 |
32f |
0.3290(2) |
0.3290 (2) |
0.3290 (2) |
0.20000 |
0.25000 |
Table4: Main interatomic distances (Å), angles (°) and bond valences in the Bi0.8Ta0.1Te0.1O1.65 composition, type δ–Bi2O3
|
Bi/Ta/Te |
O1(1) |
O2(1) |
O3(1) |
O4(1) |
O5(1) |
O6(1) |
O7(1) |
O8(1) |
Valence |
|
O1(1) |
2.37527 (3) |
3.87880 (5) |
3.87880 (5) |
3.87880(5) |
4.75054 (5) |
2.74273 (5) |
2.74273(5) |
2.74273 (5) |
0.468 |
|
O2(1) |
109.471 (2) |
2.37527 (3) |
3.87880 (5) |
3.87880(5) |
2.74273 (5) |
4.75054 (5) |
2.74273(5) |
2.74273 (5) |
0.468 |
|
O3(1) |
109.471 (2) |
109.471 (2) |
2.37527 (3) |
3.87880(5) |
2.74273 (5) |
2.74273 (5) |
4.75054(5) |
2.74273 (5) |
0.468 |
|
O4(1) |
109.471 (2) |
109.471 (2) |
109.471 (2) |
2.37527 (3) |
2.74273 (5) |
2.74273 (5) |
2.74273(5) |
4.75054 (5) |
0.468 |
|
O5(1) |
180.000 (3) |
70.5288 (16) |
70.5288 (2) |
70.5288 (2) |
2.37527 (3) |
3.87880 (5) |
3.87880(5) |
3.87880 (5) |
0.468 |
|
O6(1) |
70.5288 (2) |
180.000 (3) |
70.5288 (2) |
70.5288 (2) |
109.471 (2) |
2.37527 (3) |
3.87880(5) |
3.87880 (5) |
0.468 |
|
O7(1) |
70.5288 (2) |
70.5288 (2) |
180.000 (3) |
70.5288 (2) |
109.471 (2) |
109.471 (2) |
2.37527 (3) |
3.87880 (5) |
0.468 |
|
O8(1) |
70.5288 (2) |
70.5288 (2) |
70.5288 (16) |
180.000 (3) |
109.471 (2) |
109.471 (2) |
109.471 (2) |
2.37527 (3) |
0.468 |
| ΣVij | 3.744 |
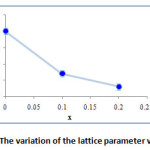 |
Figure 6: The variation of the lattice parameter versus x |
The atoms of bismuth, tantalum and tellurium are surrounded by eight oxygen atoms type 1 at a distance of 2.38 Å (Fig. 7), forming a regular cubic environment (Fig. 8). This distance is close to the sum of the radii (1.42+1.17) Å proposed by Shannon [22]. The oxygen atoms (O2) are displaced from ideal (8c) wyckoff position to 32f.
To maintain the stoichiometry only six oxygen anions (Bi2O3: Z=2) are present, there are also two vacancies per sub-unit. The presence of different Wyckoff positions for the same ionic species is due the differing displacements from the positions that ions would have in the fluorite structure. These displacements arise to accommodate the crystallo-chemical imbalance resulting from the unoccupied sites (vacancies).
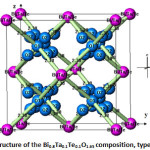 |
Figure 7: Structure of the Bi0.8Ta0.1Te0.1O1.65 composition, typeδ–Bi2O3 |
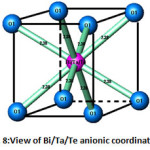 |
Figure 8: View of Bi/Ta/Te anionic coordination |
Raman spectroscopy
Prior to compare the Raman spectra of different compositions, we would like to draw a couple of remarks concerning the room temperature alpha-phase. The δ-Bi2O3 crystal structure has P21/c space group with two Bi atoms located at two independent 4e Wyckoff sites and three O atoms located at three independent 4e Wyckoff sites [23]. The Bi has two different coordination numbers: Bi1 has five-fold coordination and Bi2 has six-fold coordination. The Bi1 polyhedron is a distorted pyramid with Bi-O bond lengths varying from 2.07 to 2.63Å, while the Bi2 polyhedron is much distorted octahedron with Bi-O bonds varying from 2.13 to 2.79Å. The factor group analysis predicts that δ-Bi2O3 crystal with four molecules per unit cell has 57 optical vibrations at the centre of the Brillouin zone (k=0).
Г(q = 0) = 15Ag + 15Bg + 15Au + 15Bu (1)
With A and B are non-degenerate modes, the subscripts g and u represent the symmetric and antisymmetric modes with respect to the centre of inversion. Symmetry exclusion rules predicts that there are thirty Raman-active modes (15Ag+15Bg), twenty-seven infrared-active (IR) modes (14Au+13Bu) and three acoustic modes (Au+2Bu).
As it can be observed in Fig. 9, the Raman spectrum is characterized by two different vibrational modes, narrow below 200 cm-1 and broad above 200 cm-1. The origin of this broadening is a matter of a longue debate [24, 25]. It was attributed by Betsch and White to atomic disorder resulting from the random orientation of the lone-pair orbitals of Bi atoms [24]; on the other hand, Denisov et al commented that this could be due to strong anharmonic coupling related to O atoms [25]. In the absence of an anharmonic model to account for the phonon-phonon interaction and the temperature phonon life-time in the above Raman scattering, one would suggest that observed broadening is very likely due to the former hypothesis. This does not exclude the anharmonic contribution to the phonon broadening, but at this temperature we suggest that this effect is very weak comparable to the positional disorder. Consequently, the hopelessness to perform polarized Raman on the crystalline powder of δ-Bi2O3 and the overlapping of different modes that are caused mainly by high frequency broadening, explain the drop of the permitted Raman bands from 30 to 18 observed modes.
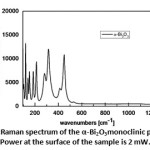 |
Figure 9: Raman spectrum of the α-Bi2O3monoclinic phase. Power at the surface of the sample is 2 mW. |
A sum of Lorentzian band profile was applied to recalculate the Raman spectrum of δ-Bi2O3, with ω (cm-1), ɣ (cm-1), stands for phonon frequencies, and damping coefficient, respectively. Frequencies and damping coefficient, compared to those calculated from ref [26] respectively with their attribution are regrouped in Table 5. It is worth to notice that reconstituting the spectra with a sum of Voigt (combination of Lorentz and Gaussian) bands, with a fixed Gaussian band-width that take into account the experimental broadening, do not bring further information on the spectral profiles and the vibrational properties of the phonon. As shown in table 5, our data agreed well with those reported in literature. Moreover, as one can see, the coupling of the experimental results from powder and crystal to the calculated one obtained by molecular dynamics, all of the 30 Raman active modes can be observed.
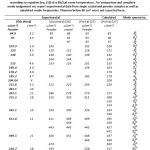 |
Table 5: Experimental Raman mode frequencies and damping coefficient obtained from fit according to equation (eq. (1)) of α-Bi2O3 at room temperature. For comparison and complete mode assignment we report experimental data from single crystal and powder samples as well as calculated mode frequencies. Phonons below 80 cm-1 were not reported here. Click here to View table |
As predicted with the factor group analysis, all of the allowed Raman modes belong either to Ag or Bg symmetry. Whereas, the atomic displacement for each mode is very complex to describe. One can suggest that the low frequency modes probably describe the translational and vibrational motion of the Bi atoms, while those at high frequency could reflect the displacement of O atoms. Authors in Ref [27] found that the total density of states obtained from inelastic scattering measurements contains intense signatures at 59, 218, 344, 424, and 532 (cm-1), and weak shoulders at 102, 123, 165, and 195 (cm-1). Comparing these results to those obtained in Ref [25] from calculation based on interatomic potential in rigid ion model, contribution of Bi and O atoms to the Raman scattering can be successfully approached. The Bi atoms participate mainly in vibrations below 120 (cm-1) mainly translational modes, while modes above 150 (cm-1) are due to displacements of the O atoms and can thus be attributed to bending modes. Modes in the range 120-150 (cm-1) are defined by the displacements of both Bi and O atoms and accordingly we attribute them to Bi-O stretching vibration in both coordination polyhedra. Very likely those between 200 and 400 (cm-1) correspond to stretching vibration in six fold coordination while those above 400 (cm-1) correspond to internal vibration in five-fold coordination. Fig. 10 shows Raman spectra of the compositions (x=0, 0.1, 0.2 and 0.3) recorded at room temperature.
 |
Figure 10: Raman spectra of the chemically doped x(Ta/Te)-Bi2O3 compositions(x=0, 0.1, 0.2 and 0.3). Power at the surface of the sample is 2 mW. |
The spectra are displayed in same the spectral range from 95 to 1000 cm-1 where most of the first order Raman active modes are present. Spectra show tremendous changes and differences upon the addition of Te4+ and Ta5+ ions. All the spectra show similar profile characterized with bands at 131, 328, 594, 719, 826 cm-1. The intense low and high frequency peaks characterizing the α-Bi2O3 disappear and only one intense band is present at low wavenumber with four other weak and large bands in the high frequency side of the Raman spectrum.
Furthermore, the decrease of the number of Raman bands is a strong hint for a smoothing out of vibrational modes. This latter is a consequence of an increase in the lattice symmetry. Concretely, the spectra present a wavenumber dependence on the dopant content. The intense band at 131cm-1 is slightly blue shifting marking a well-defined shoulder at x= 0.3. The strong and asymmetric signal at 100 cm-1 is non-Raman and it is a result of the filter cut-off. Also the mode at 719 cm-1 for x=0.1 shifts to higher wavenumber and its amplitude increases significantly with the x concentration. The same increase in intensity is present in the large band centered at 328cm-1 (x=0). Fluorescence at low wavenumber is also observed to persist with increasing the amount of Te4+ and Ta5+. In the absence of an absorption spectrum of this compound, it is difficult to come up with an absorption mechanism that describes this fluorescence. But, one could speculate two possible scenarios that could lead to fluorescence in the Raman spectrum. First, concerns the existence of defects in the structure and second, could rise from a reduction of the energy band gap, i.e; as the laser excitation energy is constant (2.54 eV), the addition of Te4+ and Ta5+ could somehow reduce the energy gap between the electronic ground state (E0) and the first electronic excited state (E*). Consequently, the incident line excite the molecule from E0àE* and upon desexcitation it release a photon in the same probed energy range. Increase of Te4+ and Ta5+ amount shift the fluorescence to higher wavenumber.
Structural refinement based on X-ray diffraction data (presented above) shows that the lattice symmetry adopts a cubic δ-Bi2O3 type structure. Applying the group theory analysis by taking into account the space group and the occupied site symmetries, the fundamental modes in the Г point are distributed in terms of the irreducible representations of the factor group as:
Г (q = 0) = A1g + A2u + Eu + Eg + T2u + 3T2g + 4T1u + T1g (2)
Where T1u is acoustic mode, 3 T1u are Infrared active and vibrations belonging to A1g + Eg + 3T2g are Raman active modes. A2u + Eu + T2u + 3T1u are Hyper-Raman active modes.
Raman active vibrations per set of ions are:
Bi, Te, Ta: none
O(8c): T2g
Bi/Ta/Te(4a): no modes
O(32f): A1g + Eg + 3T2g
We can see from the group theory analysis made in this paper that the cations do not contribute to the allowed fundamental transition, so doping with Te4+/Ta5+ ions on the Bi3+ site will not directly influence the Raman spectra. Only the oxygen sublattice is contributing to the Raman spectrum and the high energy part of Density of states DOS spectrum is dominated by the oxygen density of states. Accordingly, an increase or a decrease of the intensity of a couple of bands reflects a change in the order-disorder of the oxygen sub-lattice.
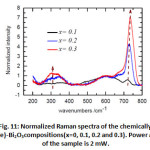 |
Figure 11: Normalized Raman spectra of the chemically doped x(Ta/Te)-Bi2O3compositions(x=0, 0.1, 0.2 and 0.3). Power at the surface of the sample is 2 mW. |
In order to get a comparative view on the evolution of the vibrational signature of the oxygen sub-lattice, first all the spectra have their intensity corrected.
Correction was made by subtracting a second order polynomial _t to the base- line for the high wavenumber region [850-1000 cm-1] where no Raman signatures are observed and extrapolating it to the low wavenumber region. This method guarantees reproducible spectra with low uncertainty on the Raman intensities and assume that fluorescence is mostly originated from electronic transition [28]. Second, Raman spectra were normalized to the band at 635 cm-1 (Fig. 11). In Fig. 11, besides the Raman shift of bands at 265, 502, and 719 cm-1, the relative Raman intensity increases from x= 0.1-0.3 for the large bands at 250-400 cm-1 and the mode at 719 cm-1 while it decreases for the one at 502 cm-1.This gives a clear evidence of the oxygen sublattice change after doping with x= 0.1-0.3. It is worth to notice that Raman frequencies of the doped Bi2O3 are slightly higher than those of the high temperature δ-Bi2O3. As the lattice expands with temperature, the bonds loosened and induce a red Raman shift. Thus, the Raman shift difference observed for the doped and undoped Bi2O3 originates very likely from a temperature effect.
In the absence of a real simulation of oxygen sub-lattice vibration, assignment of all the above modes seems to be impossible; although some observation can be made. The temperature Raman spectra of the α à δ transition, shows clearly the persistence of the A1g mode at 450 cm-1 with temperature in δ-Bi2O3. This mode is observed as a large band in δ-Bi2O3 at a frequency 510 cm-1. Since temperature induces a red shift of the Raman spectrum, we argue that the large band at 594 cm-1 presents the same A1g symmetry. The high temperature δ-Bi2O3 shows the absence of the peak 719 cm-1. We observed that the intensity of this peak relative to the one at 600 cm-1 increases significantly with x. We suggest that this mode at 719 cm-1 is related to oxygen defects in the structure. Similar behavior has been observed in fluorite structure having punctual defects [29-31], i.e. interstitial oxygens as in case of UO2+x [31] or oxygen vacancies as in UO2 doped trivalent metals [29, 30].
Conclusion
The δ-Bi2O3 is a stable polymorph of bismuth sesquioxide only at high T. Here we have successfully stabilized this structure at room temperature through a chemical doping process. In addition to what is suggested in literature we show that this structure is not only stable in presence of trivalent metals but also with tetra- and pentavalent metals. The crystal structure was determined by means of the X-ray diffraction and micro-Raman scattering. The cations Bi3+ / Ta5+ / Te4+ occupy the same site (4a), while Oxygens occupied the sites 8c and 32f, respectively. The results of Raman spectroscopy analysis confirms the existence of the solid solution (BiO1.5)1-x(TaO2.5)x/2( TeO2)x/2 (with 0<x<0.2), type δ-Bi2O3. Comparing the spectra of δ-Bi2O3 with the alpha phase, we comfortably suggest that the decrease of the number of Raman bands is a strong hint for a smoothing out of vibrational modes. This latter is a consequence of an increase in the lattice symmetry. Equally to other fluorite compounds, we show that the structure presents oxygen defects clearly identified in the Raman spectra.
References
- Gurunathan, K.; Int. J. Hydrog. Energy. 2003, 29, 933-940.
CrossRef - Wang, J.; Neaton, J. B.; Zheng, H.; Nagarajan, V.; Ogale, S. B.; Liu, B.; Viehland, D.; Vaithyanathan, V.; Schlom, D. G.; Waghmare, U. V.; Spaldin, N. A.; Rabe, K. M.; Wuttig, M.; Ramesh, R. Science. 2003, 299, 1719-1722.
CrossRef - Park, B. H.; Kang, B. S.; Bu, S. D.; Noh, T. W.; Lee, J.; Jo, W. Nature. 1999, 401, 682-684.
CrossRef - Wachsman, E. D., Lee, K. T. Science. 2011, 334, 935-939
CrossRef - Azad, A. M.; Larose, S.; Akbar, S. A. J. Mater. Sci. 1994, 29, 4135-4151.
CrossRef - Levin, E.M.; and Roth, R.S. J. Res. Nat. Bur. Stand.-A Phys. Chem. 1964, 68A, 189-206.
CrossRef - Harwig H.A.; and Gerards, A.G. J. Solid State Chem. 1978, 26, 265-274.
CrossRef - Gattow, G.; and Schröder, H. Z. Anorg. Allg. Chemie. 1962, 318, 176-189.
CrossRef - Takahashi, T.; Iwahara, H.; Nagai, Y. J. Applied Electrochem. 1972, 2, 97-104.
CrossRef - Takahashi, T.; Iwahara, H.; Arao, T. J. Applied Electrochem. 1975, 5, 187-194.
CrossRef - Harwig, H. A. Z. Anorg. Chem. 1978, 444, 151-166.
- Sanna, S.; Esposito, V.; Andreasen, J.W.; Hjelm. J.; Zhang, W.; Kasama, T.; Simonsen S.B.; Christensen, M.; Linderoth S.; Pryds N. Nature Mat. 2015, 14, 500-504.
CrossRef - Yashima, M.; Ishimura, D. Chemical Physics Letters. 2003, 378, 395-399.
CrossRef - Programme Full Prof.2k (Version 5.30 – Mar2012-ILL JRC).
- Sillen, L. G. Ark. Kemi Mineral. Geol. 1937, 12A, 1-15.
- Gattow, G.; Schutze, D. Z. Anorg. Allg. Chem. 1964, 328, 44-68.
CrossRef - Willis, B. T. M. Acta. Cryst. 1965, 18, 75-76.
CrossRef - Boyapati, S.; Wachsman, E. D.; and Chakoumakos, B. C. Solid State Ionics, 2001, 138, 293-304.
CrossRef - Battle, P. D.; Catlow, C. R. A.; Drennan, J.; Murray, A. D. J. Phys. C, 1983, 16, L561-L566.
- Programme DICVOL04, BOULTIF, A. LOUER, D. J. APPL. CRYST. 2004, 37, 724-731.
- Programme TREOR90, Université de STOCKHOLM (SWEDEN). 1990.
- Shannon, R.D.; Acta Crystallogr, 1976, A32, 751-767.
CrossRef - Malmros, G.; Acta Chemica Scandinavica 1970, 24, 384-396.
CrossRef - Betsch, R. J.; and White, W. B. Spectrochimica Acta Part A, 1978, 34, 505-514.
CrossRef - Denisov, V N.; Ivlev A N.; Lipin A S.; Mavrin, B N.; and Orlov V G. 1997 J. Phys.: Condens. Matter, 9, 4967-4978.
CrossRef - Chouinard, C.; and Desgreniers, S.; 2000 Solid State Commun, 113, 125-129.
CrossRef - Pereira, A L J.; Gomis, O.; Sans, J A.; Pellicer-Porres, J.; Manjón, F J.; Beltran, A.; Rodríguez-Hernández, P.; and A Muoz. J. Phys.: Condens. Matter. 2014, 26, 225401 (15pp).
- Naji, M.; Piazza, F. ; Guimbretière, G. ; Canizarès, A.; Vaills, Y. J. Phys. Chem. B, 2013, 117, 5757-5764.
CrossRef - Talip, Z.; Wiss, T.; Raison, P. E.; Paillier, J.; Manara, D.; Somers, J.; and Konings, R. J.M. Journal of the American Ceramic Society, 2015, 98, 2278–2285.
CrossRef - Naji, M.; Colle, J-Y.; Beneš, O.; Sierig, M.; Rautio, J.; Lajarge, P.; and Manara, D. J. Raman Spectrosc. 2015, 46, 750–756.
CrossRef - Desgranges, L.; Baldinozzi, G.; Simon, P.; Guimbretière, G.; and Canizares, A. 2012, J. Raman Spectrosc. 43, 455-458.
CrossRef


![]()


