cDNA Sequence Analysis and Structural Phylogenetic Tree of Novel Myoglobin from Striped Snake-Head Fish (Ophicephalusstriatus)
Chatrachatchaya Chotichayapong1, Saksit Chanthai1*, Nison Sattayasai2, Nobuyuki Kanzawa3, Toru Tamiya3 and Takahide Tsuchiya3
1Center of Excellence for Innovation in Chemistry, Department of Chemistry, Faculty of Science, KhonKaen University, KhonKaen 40002, Thailand
2Department of Biochemistry, Faculty of Science, KhonKaen University, KhonKaen 40002, Thailand
3Department of Materials and Life Sciences, Faculty of Science and Technology, Sophia University, Tokyo 102-8554, Japan
Corresponding Author Email: sakcha2@kku.ac.th
DOI : http://dx.doi.org/10.13005/ojc/320102
Article Received on :
Article Accepted on :
Article Published : 08 Mar 2016
Primary structure of myoglobin (Mb) from ordinary muscle of striped snake-head fish (Ophicephalusstriatus) was studied. Sequence analysis of cloned cDNA revealed two lengths of nucleotide sequences different in 3´ untranslated regions,MbIgene and MbII gene. In accordance to amino acid coding region, both genes encodedprotein with 145 amino acid residues which were different in two amino acid residues at position 114 and 117, indicating Mb isoforms. They are very close to those of various species of fish Mbsand very identical to some marine Mbs. There are amino acid differences among thefish Mbs and other Mbs that occur in the highly conserved regions infish species. The replacement of alanine with serine 59in fish species, adjacent tohistidine 60 may contribute to the reversible binding of oxygen. Lysine was replaced by asparagine at position 93 which directly binds to the heme. The fish Mbs contain two cysteine residues.One of cysteine residue locates at the terminal of the polypeptide chain which may possibly contribute to internal disulfide interaction and thus forms tightly folded structure. It is implied that the fish Mb might be a novel protein with strong intramolecular bonding.
KEYWORDS:Myoglobin; Striped snake-head fish; cDNA sequence; Phylogenetic tree; Oxygen binding
Download this article as:| Copy the following to cite this article: Chotichayapong C, Chanthai S, Sattayasai N, Kanzawa N, Tamiya T, Tsuchiya T. cDNA Sequence Analysis and Structural Phylogenetic Tree of Novel Myoglobin from Striped Snake-Head Fish (Ophicephalusstriatus). Orient J Chem 2016;32(1). |
| Copy the following to cite this URL: Chotichayapong C, Chanthai S, Sattayasai N, Kanzawa N, Tamiya T, Tsuchiya T. cDNA Sequence Analysis and Structural Phylogenetic Tree of Novel Myoglobin from Striped Snake-Head Fish (Ophicephalusstriatus). Orient J Chem 2016;32(1). Available from: http://www.orientjchem.org/?p=14770 |
Introduction
Striped snake-head fish (Ophicephalusstriatus) is well-known freshwater fish which is widely habitat distributing in Thailand and other tropical areas. This fish is among the very few aquatic vertebrates that are able to tolerate periods of severe environmental hypoxia, both diurnally and for prolonged periods. Particularly, it is a kind of fish which is tolerant of water lacking in dissolved oxygen and can survive without water environment such as mud for a number of mouths as long as the skin and breathing apparatus are kept moist1. Myoglobin (Mb), a protein which is closely related of hypoxic tolerance of the fish, may have some interesting characteristic and their physicochemical properties.Mb is generally considered as an important intracellular oxygen binding hemoprotein found in skeletal and cardiac muscle tissues. It exists in a wide variety of species such as diving mammals2-4 and also found in amphibians5, teleosts6,chondrichthid fish7,8 and some lower species9,10. Structurally, it is a compact and globular protein whose backbone structure consists of eight-helical segments designed A through H and the heme as a prosthetic group11. The heme is positioned in a hydrophobic heme pocket and binds directly to the imidazole group of proximal histidine through oxygen coordinate binding12,13. The primary structure of Mb is the order in which its 146-153 amino acids are joined depending on species. Itposses its functional property preliminarily as a temporary storing of excess oxygen for metabolic respiration in order to delay and prevent the onset of anoxia by releasing of oxygen when perfusion levels of oxygen in mitochondria fall to critical low values or high oxygen demand12. It also plays a role in facilitating oxygen transport into tissues by diffusion from sercolemma to the mitochondria of heart and red muscle cells. The biological functions of Mb depend critically on the chemical equilibrium of oxygen binding to the iron that is chelated to the heme group within the protein14,15. Moreover, it is the most important determinant for the characteristic color of muscle tissue depending on its redox state and concentration16. Thus, different kind of animals living in the different habitat shows a difference in their properties17-23.
As far as fish Mb is concerned, it is present in most fishes, but its amount varies widely. Mb content is correlated with species capacities for sustained aerobic exercise and also depends on breed, sex and age of animal, training and nature of nutrition, oxygen availability, blood circulation and muscle type8,24-27. Thus, the protein of fish species is interesting to study because it provides an excellent system in which to study the natural variation of Mb function, and to understand the interrelationship between structure and function28-32. As well known, all function of Mb is related with their structure. The variation in amino acid sequences of Mb influences their chemical and thermal stability21,25,31-33.The striped snake-head fish is mostly found as the hypoxic tolerant fish. Therefore, its structural property is thought to have interesting characteristic and relatively high stability. Based on functional aspect including structure and stability relationship, this fish Mb is, however, no report yet at the present. This research study is then aimed to investigate structural properties related to folding stability.
Therefore, this study was aimed to determine primary structure of the fish protein via cDNA sequencing through an extraction of total RNA from the frozen fish muscle and studying of primers designation for the fish Mb cDNA synthesis by reversed translated partial peptide sequences obtained from the striped snake-head Mb and conserved regions of the published sequences from other fish species. We first synthesized and amplifiedthe fish Mb cDNA using OneStep RT-PCR kit.The complete nucleotide sequence was done using the SMART RACE cDNA amplification kit, resulting in its complete amino acids sequence by deduction from the nucleotide sequence to understand the evolution of the fish by its construction of the phylogenic tree.
Materials and Methods
Nucleotide sequence analysis
Primer design
Specific oligonucleotide primers were designed by deduction from nucleotide sequences of conserved regions of published sequences from various fish Mbs34,35. Three partial peptide sequences obtained by N-terminal sequence analysis were used to design degenerate primers. Primer sequences used for the experiment are listed in Table 1.The primer pairs used for amplification of the striped snake-head fish Mb DNA are shown in Table 2.
Table 1: Primer sequences used for determination of nucleotide sequence
| Primer name | Sequences (5´→3´) |
| RT-PCR and Cloning primers | |
| Myg_f1Myg_r1Myg_f2
Myg_r2* Myg_r2nested* Myg_f3* Myg_f3nested* Myg_r3* Myg_r3nested* |
ATCACACAGGACATTTTACTACTCTCGGCAAAACTTTGTGAATCTGCAGATAATGGCTGACTTTGACATG
TTYTTDATNGGDATRTTRTG TTDATNGGDATRTTRTGYTT TTYGTNWSNATHCCNYTNGC GTNWSNATHCCNYTNGCNGA GCNGCRTGNSWNCCRTANGC GCRTGNSWNCCRTANGCYTT |
| 3´– and 5´-RACE primersSMARTer II A primersAAGCAGTGGTATCAACGCAGAGTACXXXXX3´-CDS primer A AAGCAGTGGTATCAACGCAGAGTAC(T)30VN | |
| Myg_3RMyg_3Rnested | AAGCCACGGTGCCACGGTGCTGAATAAACTAGCCACGGTGCCACGGTGCTGAATAAACTA |
| 5´-CDS primer A (T)25VN | |
| Myg_5RMyg_5Rnested | TTACTGCCAGAGGTTTGACGGATGGAAGCGTTACTGCCAGAGGTTTGAGGATGGAAGCGTG |
*The degenerated primers
N = A, C, G, or T; V=A, G, or C; Y= C or T; W = A or T; S = C or G; D = A, G or T
X = undisclosed base in the proprietary SMARTeroligo sequence
Table 2: Primer pairs used for amplification of striped snake-head fish DNA. F and R strand for forward and reward primers, respectively.
|
Primer pairs |
Primer names |
Primer sequence (5→3´) |
| P1P2
P3
P4
P1-1
P1-2
P2-2
P3-2
P4-2 |
Myg_f1Myg_r1Myg_f2
Myg_r1 Myg_f3 Myg_r2 Myg_f3 Myg_r3 Myg_f2 Myg_r1 Myg_f2 Myg_r2 Myg_f2 Myg_r2 Myg_f3nested Myg_r2nested Myg_f3nested Myg_r3nested |
F- ATCACACAGGACATTTTACTACTCR- TCGGCAAAACTTTGTGAATCTGF- CAGATAATGGCTGACTTTGACATG
R- TCGGCAAAACTTTGTGAATCTG F- TTYGTNWSNATHCCNYTNGC R- TTYTTDATNGGDATRTTRTG F- TTYGTNWSNATHCCNYTNGC R- GCNGCRTGNSWNCCRTANGC F- CAGATAATGGCTGACTTTGACATG R- TCGGCAAAACTTTGTGAATCTG F- CAGATAATGGCTGACTTTGACATG R- TTYTTDATNGGDATRTTRTG F- CAGATAATGGCTGACTTTGACATG R- TTYTTDATNGGDATRTTRTG F- GTNWSNATHCCNYTNGCNGA R- TTDATNGGDATRTTRTGYTT F- GTNWSNATHCCNYTNGCNGA R- GCRTGNSWNCCRTANGCYTT |
Extraction of RNA and cDNA synthesis
Ordinary muscle of striped snake-head fish were excised and placed in sterile, RNase free microcentrifuge tubes, then frozen immediately in liquid nitrogen. Total RNA was extracted from approximately 50-100 mg using TRIZOL reagent (Invitrogent) according to manufacturer’s instruction. Total RNA was determined for its concentration by measuring absorbance at 260 nm using Hitachi UV2000A spectrophotometer and checked for the quality by electrophoresis on 1.5% denaturing formaldehyde agarose gel.
Cloning and DNA sequencing of the fish Mb
cDNA of the protein was synthesized and amplified using the One Step® RT-PCR kit. Reverse transcription and PCR were carried out sequentially in the same tube on a thermo cycler. The 4 pairs of specific primer including P1, P2, P3or P4 were separately used for making a first strand cDNA. The reverse transcriptase reaction was carried out at 50 °C for 30 min to performed cDNA then followed by 95°C for 15 min to inactivate reverse transcriptase and simultaneously to hot-start Tag DNA polymerase for amplification ofcDNA. The PCR amplification was performed for 30 cycles at 94°C for 30 s, primer annealing at 55°C for 30 s, and primer extension at 72°C for 1 min. The products were analyzed by 1.5% agarose gel electrophoresis.
Each of PCR products from the first amplification referred as P1, P2, P3or P4 was re-amplified with the same condition using the specific internal primers. The P1 product was separately amplified using2 specific primer pairs, P1-1andP1-2.
The P2, P3 and P4products were amplified using P2-2, P3-2 andP4-2, respectively. The position of the predicted region obtained from amplification using each primer pair is shown in Fig.1.
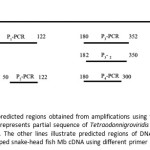 |
Figure 1: Positions of predicted regions obtained from amplifications using the designed primer pairs. The top line represents partial sequence of Tetraodonnigroviridis Mb DNA (Accession number: AJ628044). The other lines illustrate predicted regions of DNA obtained from the amplification of striped snake-head fish Mb cDNA using different primer pairs. Click here to View figure |
The second PCR products were separated on from 1.5% agarose gel.The DNA band was excised from the gel and purified by Qiaex II protocol (Qiagen) and cloned into a pGEM-T Easy vector. The ligation of the targetDNA with the T-vector was achieved with a DNA ligation kit. The resulting ligation solution was used to transform to E. coli strain DH5 a competent cells. Plasmid DNA was extracted from positive cloned and the cDNA insert was amplified using Big Dye Terminator Cycle Sequencing kit and sequenced on a DNA Sequencer.
The cloning of full-length cDNA of striped snake-head fish Mb was performed by using two methods; the 5′-and 3′- rapid amplification of cDNA ends (RACE) PCR methods using the SMARTTMRACEcDNA amplification kit and the typical PCR using gene specific primers for analysis of 5′-end of the fish Mb cDNA. In accordance of 5′-and3′-RACE PCRreaction, the first-strand cDNA s were synthesized using the following primer pairs; 3′- RACE cDNA synthesis primer (3′-CDS) and SMART II A oligonucleotide for synthesis of 3′- RACE-Ready cDNA and the5′-RACE cDNA synthesis primer (5′-CDS) and SMART II A oligonucleotide for synthesis of 5′-RACE-Ready cDNA.
To amplify the 5′- and 3′- ends of the stripped-snake head fish Mb cDNA, the gene specific primers; Myg-3R, Myg-3R-nest, Myg-5R and Myg-5R-nest (Table1) were designed based on an internal sequence of fish Mb cDNAfragment which is obtained from above experiment (Fig. 1). In 3′-RACE, PCR was performed with 3′-RACE-Ready cDNA as template with primers Myg-3R and universal primer A mix. The PCR was carried out for 30 cycles of denaturation at 93°C for 1 min, annealing at 60°C for 1 min, and extension at 72°C for 1.5 min. Subsequently, the 3′-end RACEPCR products were re-amplified by nested PCR reaction, using primers Myg_3R-nest and nested universal primer A mix. The nested PCR reaction was carried out with the same condition of 3′-RACE PCR.
For determination of 5′-end of stripped-snake head fish Mb cDNA,the5′-RACE-Ready cDNA of Mb gene was used as the template and PCR was carried out with primers Myg-5R and universal primer A mix at 30 cycles of denaturation at 93°C for 1 min, annealing at 60°C for 1 min, and extension at 72°C for 1.5 min. Subsequently, the 5′-end RACE PCR products were re-amplified by nested PCR reaction, using primers Myg_5R-nest and nested universal primer A mixwith the same condition of 5′-RACE. In addition, the 5′-end of striped-snake head fish MbcDNAwas performed using the typical PCR reaction. The 3′-RACE-Ready cDNA of stripped snake-head Mb geneobtained from above step was used as the template and the PCR was conducted with Myg_f1 and Myg_r2 primers (Table1) by the following condition of 3′-RACE. The primary PCR product was subject to nested amplification with Myg_f2nested and Myg_r2nested.
Both PCR products of 5′- and 3′-ends cDNA were separated on from 1.5% agarose gel.The DNA bands was excised from the gel, purifiedand cloned into a pGEM-T Easy vector. The resulting ligation solution wasused to transform to E. colicompetent cells. Plasmid DNA was extracted from positive cloned and the cDNA insert was amplified using BigDye Terminator Cycle Sequencing kit and sequenced on a DNA Sequencer. A full-length cDNA was constructed by assembly of two cDNA-end clones using Vector NTI Advance 10 software. Based on the obtained nucleotide sequence of stripped snake-head fish Mb cDNA, the amino acid sequence was deduced using Vector NTI Advance 10 software and Bioedit program.
Molecular modeling of the fish Mb
The Mb structure of the striped snake-head fish was generated with SWISS-MODEL Workspace, a web-based environment for protein structure homology modeling using the X-Ray structure of black fin tuna Mb (Protein Data Bank (PDB) code 2nrl)36 as a template with a sequence identity of 73.24%. The SWISS-MODEL method was used in combination with the Deep View 4.0.4 program and Vector NTI Advance 10 software.
Phylogenetic comparison of Mb sequence
Phylogenetic tree was constructed based on the amino acid sequence of striped snake-head fish Mb and the other species. The amino acid sequence was used to conduct a search of Protein knowledgebase (UniprotKB; http://www.uniprot.org) with the BLASTW algorithm. The Mb from some fishes, mammalians, avians and reptiles were selected for construction of unrooted tree by CLUSTALW, PHYLIP and Treeviewprogram,using chicken (Gallus gallusdomesticus) as the out group. The analysis included Mb sequences fromfish species:yellowfin tuna (Thunnus albacore), unicorn icefish (Channichthysrhinoceratus), Atlantic blue marlin (Makairanigricans), Atlantic chub mackerel (Scombercolias), port jackson shark (Heterodontusportusjacksoni), tope shark (Galeorhinusgaleus),zebrafish (Daniorario), goldfish (Carassiusauratus) and common carp (Cyprinuscarpio), mammalian species: sperm whale (Physetermacrophalus), bridled dolphin (Stenella attenuate), grey seal (Halichoerusgrypus), Asiatic elephant (Elephasmaximas), water buffalo (Babalusbubalis), horse (Equuscaballus), weasel lemur (Lepilemurmustelinus) and emperor penguin (Aptenodytesforsteri), avian species: whiskered auklet (Aethiapygmaea), spotbill duck (Anaspoecilorhynca), shag phalacroco (Phalacrocoraxaristoteris) and ostrich (Struthiocamelus), reptile species: green sea turtle (Cheloniamydas), map turtle (Grapemusgeographica), logger head sea turtle (Carettacaretta) and lace monitor (Varanusvarias).
Determination of sequence similarity
The amino acid sequence of striped snake-head fish Mb was used to determine the homology with Mbs from other fishes (yellow fin tuna Thunnus albacore, blue marlin Makairanigricans, chub mackerel Scombercolias, common carp Cyprinuscarpio, goldfish Carasssiusanratus and zebrafish Daniorerio) using Bioedit sequence alignment program and Vector NTI Advance 10 software and Bioedit program.
Results and Discussion
The deduced amino acid sequence
Total RNA was extracted from frozen striped snake-head fish muscle using TRIZOLmethod. cDNA was then synthesized and amplified using One-step reversed transcription polymerase chain reaction (One-step RT-PCR). The first PCR products of fish Mb cDNA resulting from One-step PCR using the 4 pairs of primers including P1, P2, P3 and P4 under the conditions described are shown in Fig.2. There was no evidence of an amplified PCR band in all of P1, P2, P3 and P4 samples. While the PCR product which used β-actin specific cDNA primers as the reference control could be observed. Therefore, all first PCR products were re-amplified by the same PCR conditions using the predicted internal primer pairs to amplify the specific DNA fragment located within the first PCR products and to provide better amplification of the desired DNA.
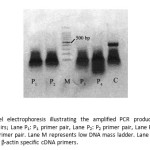 |
Figure 2: Agarose gel electrophoresis illustrating the amplified PCR product with different specific primer pairs; Lane P1: P1 primer pair, Lane P2: P2 primer pair, Lane P3: P3 primer pair and Lane P4: P4 primer pair. Lane M represents low DNA mass ladder. Lane C represents the PCR product with β-actin specific cDNA primers. Click here to View figure |
The second round for PCR products which were analyzed on agarose gel are shown in Fig.3. The PCR products of P1 with internal primer pairs of P1-1 and P1-2 were referred as P1-1 and P1-2, respectively. The PCR products of P2, P3 or P4 with internal primer pairs of P2-2, P3-2 or P4-2 were also referred as P2-2, P3-2 and P4-2, respectively.Gel analysis of the P3-2 PCR product showed the band at around 200 bp corresponding to the predicted region obtained from DNA sequence of T. nigroviridis Mb DNA. Thus, the P3-2 desired band was excised from agarose gel. The excised cDNA band was extracted and purified. The cDNA fragment was ligated and cloned, and then subjected to DNA sequencing using the dideoxy chain termination method. A cDNA insert had a length of 167 bp (Fig.4) and encoded a protein of 51 amino acid residues except for 4 amino acid residues could not be uncoded. The deduced amino acids sequence was found to be consistent with Mbs of some fishes.
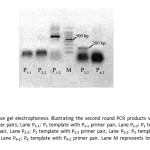 |
Figure 3: Agarose gel electrophoresis illustrating the second round PCR products with different specific primer pairs; Lane P1-1: P1 template with P1-1 primer pair, Lane P1-2: P1 template with P1-2 primer pair, Lane P2-2: P2 template with P2-2 primer pair, Lane P3-2: P3 template with P3-2 primer pair, Lane P4-2: P4 template with P4-2 primer pair. Lane M represents low DNA mass ladder. Click here to View figure |
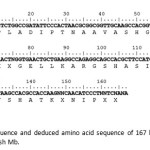 |
Figure 4: Nucleotide sequence and deduced amino acid sequence of 167 bpcDNA encoding the striped snake-head fish Mb. Click here to View figure |
Rapid amplification of cDNA ends and nucleotide sequence analysis
The complete Mb cDNA of the striped snake-head fish was determined by rapid amplification of cDNA ends (RACE) PCR. The obtained nucleotide fragment of 167 bpcDNA (P3-2 PCR product) was used to design gene specific primers (Myg-3R, Myg-3R- nested, Myg-5R, Myg-5R-nested).3´-RACE- Ready cDNA was synthesized from mRNA using RT-PCR with oligo(dT) primer and 3′-CDS and amplified using Myg-3R and universal primer A mix. The subsequent PCR using a nested gene specific primer (Myg-3R-nest) and the nested universal primer mix results in the specific amplification cDNA ends. The 3´RACE products show three bands on agarose gel at around 1500, 700 and 400 referred as 3R-1, 3R-2 and 3R-3, respectively (Fig.5). All three bands were excised from the gel and the 3´RACE products were extracted and purified. The cDNA fragment was ligated to pGEM-T Easy vector, then cloned in E. coli strain DH5a competent cells and subjected to DNA sequencing. The result showed that the 3R-2 and 3R-3 fragments had nucleotide length of 450 and 696 bp, respectively (Fig. 6 and7) while the 3R-1 could not be analyzed its sequence.
Interestingly, the 696 bp fragment contains two stop codon and duplicated poly (A) site (ATAAAA) which caused by Mb gene mutation.
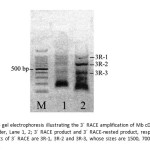 |
Figure 5: Agarose gel electrophoresis illustrating the 3´ RACE amplification of Mb cDNA; Lane M: low DNA ladder, Lane 1, 2; 3´ RACE product and 3´ RACE-nested product, respectively. The three products of 3´ RACE are 3R-1, 3R-2 and 3R-3, whose sizes are 1500, 700 and 400 bp, respectivetly. Click here to View figure |
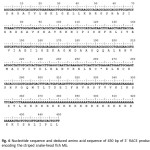 |
Figure 6: Nucleotide sequence and deduced amino acid sequence of 450 bp of 3´ RACE product encoding the striped snake-head fish Mb. Click here to View figure |
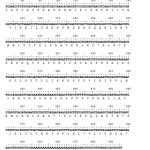 |
Figure 7: Nucleotide sequence and deduced amino acid sequence of 696 bpof 3´ RACE product encoding the striped snake-head fish Mb. Click here to View figure |
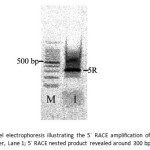 |
Figure 8: Agarose gel electrophoresis illustrating the 5´ RACE amplification of Mb cDNA; Lane M: low DNA ladder, Lane 1; 5´ RACE nested product revealed around 300 bp. Click here to View figure |
According to 5´RACE amplification, no bands were observed in 5´ RACE reaction because the 5´-RACE-Ready cDNA could not be synthesized. The typical PCR reaction was used for amplification of 5´cDNA ends using the 3′-RACE-Ready cDNA as the template with primers Myg_f1 and Myg_r2. The obtained PCR products were subject to the nested PCR using with Myg_r2-nested and the mix of two primers; Myg_f1-nested and Myg_f1-nested. The products showed single band at around 300 bp on agarose gel (Fig.8). The obtained nucleotide sequence of 5´ RACE product revealed 321 bp (Fig.9).
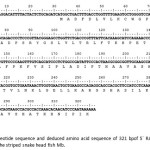 |
Figure 9: Nucleotide sequence and deduced amino acid sequence of 321 bpof 5´ RACE product encoding the striped snake head fish Mb. Click here to View figure |
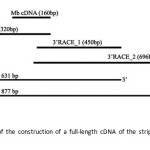 |
Figure 10: Schematic of the construction of a full-length cDNA of the striped snake- head fish Mb. Click here to View figure |
 |
Figure 11: Complete nucleotide sequence with 164 bp non-coding region and the deduced amino acid sequence of the striped snake head fish Mb (MbII). Click here to View figure |
The complete nucleotide sequence of the striped snake-head fish Mb was constructed by joining overlapping region of the 5´ ends and 3´ ends cDNA and two lengths of nucleotide sequences were obtained (Fig.10). Sequence analysis showed two sequences with different lengths in 3´ untranslated regions 3´ UTR, referred as MbI gene and MbII gene. Both sequences revealed that the 5´untranslated region (5´ UTR) of both MbI gene and Mb II gene contained 30 nucleotides and the amino acid-coding region of both Mbs contained 450 nucleotides. However, MbI gene and MbII gene showed the different length of 3´ UTR with 164 nucleotides and 410 nucleotides, respectively. In accordance to amino acid coding region, both genes encoded protein with 145 amino acid residues. Both cDNA sequences of the striped snake-head Mb and its deduced amino acid sequence are shown in Fig. 11 and 12.
In addition to the sequence identity in the overlapped region, both MbI and MbII showed a high conservation within the region except for some uncoded residues, confirming that MbI gene and MbII gene was obtained from the correct cDNA clones. However, there is only one different coded residue in the overlap region between 5´ends product and 3´RACE fragments of both Mb genes. The coded residue is Lys (K) at nucleotide position 323-325 in 5´ RACE fragment (Fig.9) while, both 321 bp and 696 bp of 3´ RACE fragments at nucleotide position 118-120 were Ser (S) instead. The corrected residues at this position within the overlapped region should be Ser because both two nucleotide sequences of 3´ RACE fragments was sequenced separately but both of them revealed Ser.
 |
Figure 12: Complete nucleotide sequence with 410 bp non-coding region and the deduced amino acid sequence of the striped snake head fish Mb (MbI). Click here to View figure |
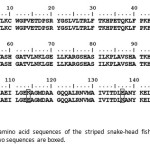 |
Figure 13: Deduced amino acid sequences of the striped snake-head fish Mb. The different residues among two sequences are boxed. Click here to View figure |
As mentioned above, Mb of the stripped snake-head fish has two types; MbI gene and MbII gene. The amino acid coding region of both MbI and MbII DNA sequences have an equal length. But both sequences are different in the lengths of the 3´ UTR. Moreover, the 3´ UTR of Mb II contained two stop codons and duplicated poly (A) site (Fig.12). The two types of the fish Mb and the presence of two stop codons and duplicated poly (A) in 3´ UTR of Mb II might be explained to two possible distinct mechanisms. Firstly, we suggest that the fish Mb may consist of several components, some of which are self-associated into two polymeric globins. Secondly, it is noted by which the gene mutation or gene duplication of the protein occurred. This gene duplication is possibly found in Mb of some heat tolerant fishes which is known to possess two Mb paralogs37,38. Gene duplication is considered to play very important roles in the organism evolution39,40. If a gene is duplicated, the selective constraint becomes less for the extra copy, and it may have a different function, while the original function of the genes is kept in the other copy. Thus, gene duplication with subsequent diversification is one of the simplest ways to acquire a new function and is thought to employ many times during evolution. In case of globin family containing several genes, it is coded for different types of Mb molecule in vertebrates41. The different polypeptides that make up Mb appear to have evolved by gene duplication from a single, original Mb-like gene. Presently in the hypoxia-tolerant common carp and goldfish, there are several types of Mb molecules produced that are essential for development and survival of fish because they are produced specifically in different tissues and at different stages of the development37,38.From the results of both purification and characterization of the striped snake-head fish Mb, it might be concluded that the fish composed of at least two types of Mbs which may act different functions. This can be concluded for the tolerant behavior of this fish under hypoxia.
Determination of primary structure of the fish Mb
The primary structure of this fish Mb which is deduced from two lengths of Mb DNA sequence, referred as MbI and MbII, contains 145 amino acid residues as shown in Fig.13. Both MbI and MbII have almost similar amino acid sequence except in the position of 114 and 137. At these positions, there are replacements between Lys and Asn residues among these Mb structures. By comparison with LC-MS/MS results (unpublished data), there is only one incorrect amino acid residue in an assignment of the sequence at position of 117. Thus, the LC-MS/MS with tryptic digestion de novo sequencing is reliable method and the deduced amino acid sequence of the Mb is correct.
Since trypsin is specific to C-terminal side of Lys and Arg, the position of 117 for both MbI and MbII should be Arg. Interestingly, at this position was replaced by Met instead of Arg. This result could indicate that the fish Mb was possibly expressed as two isoforms. Moreover, this information is useful that the Mb may consist of several components, not only two types of the globin.
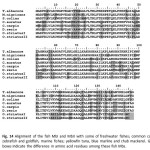 |
Figure 14: Alignment of the fish MbI and MbII with some of freshwater fishes; common carp, zebrafish and goldfish, marine fishes; yellowfin tuna, blue marline and chub mackerel. Gray boxes indicate the difference in amino acid residues among these fish Mbs. Click here to View figure |
Interestingly, the fish Mb structure contained two cysteine residues at position 14 and 145. While the Mb of other fishes contained only one cysteine residue. The cysteine leads to disulfide bridge formation in molecule which plays very important role in stabilization of protein structure in high level. In the case of cysteine that is not involved in the disulfide bridge formation can also help stabilize α-helix. Therefore, this Mb structure tends to have higher stability than other fishes. This suggestion may support the living habitat of this fish in tolerance to low oxygen demand. Moreover, because the fish Mb contains two cysteine residues to form disulfide bond, it can covalently anchor within the tertiary structure to form a functional multimeric protein. This reason may confirm that the fish Mb is a novel Mb which present as at least two-type of Mb components. Each component might either be associated with other proteins or self-associated into any isomeric protein.
Table 3 showed the amino acid composition of the fish MbI and MbII. The high content of the acid residues is hydrophobic amino acids including leucine, isoleucine and valine. The molecular mass of the fish Mb which calculated from amino acid residue was found to be 15,700 Da (SDS-PAGE). This theoretical molecular mass is higher than that of MALDI-TOF-MS (15,597.68 Da).
Table 3: Amino acid compositions of the fish Mb
| Amino acid |
Number |
|
|
MbI |
MbII |
|
| Ala, ACys, CAsp, D
Glu, E Phe, F Gly, G His, H Ile, I Lys, K Leu, L Met, M Asn, N Pro, P Gln, Q Arg, R Ser, S Thr, T Val, V Trp, W Tyr, Y |
17 2 6 8 5 8 5 10 11 18 3 7 8 3 4 8 9 10 1 2 |
17 2 6 8 5 8 5 10 11 18 3 7 8 3 4 8 9 10 1 2 |
The theoretical isoelectric point (pI) of the fish Mb was found to be 7.82. This pI value is close to that of horse Mb (7.65) more than that of Asian swamp eel Mb, the tolerant freshwater fish, which has previously been studied (6.40 and 7.1242. By comparison, the pI value of the fish Mb is found higher than those of some fish species, for examples, pI values of mackerel and sardine Mbs are 5.8 and 5.9, respectively 43and pI of carp Mb is 5.344. It could be suggested that the striped snake-head fish Mb may have some structural characteristics similar to Mb of other vertebrate species. 
Phylogenetic tree of the deduced amino acid sequence
The alignments for primary structures of the striped snake-head fish MbI and MbII with some of fish Mbs are shown in Fig.14. The sequences of the fish Mb are slightly two residues shorter than those of the other fishes. At the position 59 which is in the closed neighbor of the distal histidine (His60), the other fish Mbs showed homologous amino acid residues (Ala59). An Arg at position 59 of other fish Mbs was replaced by Ser in the striped snake-head Mb. Because the Ser structure contains hydroxyl group, it might be suggested that this position can help the distal histidine to serve strong stability for the binding of the ferrous iron in heme to oxygen molecule.
The primary structure of the striped snake-head fish MbI was identical to that of yellowfin tuna, Atlantic blue marlin, chub mackerel, goldfish, carp and zebrafish with the amino acid sequence identity of 70.74, 66.67, 64.62, 63.26, 60.54 and 57.14 %, respectively. On the other hand, the striped snake-head MbII gave higher homologous amino acids to other Mbs than its MbI with the amino acid sequence identity of 72.10, 68.02, 65.31, 63.94, 61.22 and 57.82 %, since the amino acid residues at position of 114 and 137 of MbII amino acid sequence are identical to the other Mbs. Whereas these residues at the two positions of 114 and 137 in the MbI sequence are different. Interestingly, the amino acid sequences of this fish Mb showed higher homologous identity to those of marine fish than freshwater fish. These data indicated that this fish species is quite different from another typical freshwater fish.
An evolutionary tree which was drawn based on amino acid sequences of the striped snake-head fish Mb is depicted in Fig.15. An unrooted phylogenic tree was constructed to get simple comparisons of the sequences of the Mbs from various species including fishes, mammals, reptiles and avians. Mb of fish species branched into two groups in the phylogenetic tree; marine fish and freshwater fish. Those of group formed a cluster and found to be closely related to each other. Surprisingly, the analysis presented here is consistent with an interpretation that the striped snake-head fish MbI and MbII, the freshwater fish, is not fixed at the same cluster of either marine fishes or freshwater fishes but it is still a member of the same clad. The striped snake-head fish Mb was found to be a close evolutionary with Atlantic blue marlin, yellowfin tuna and chub mackerel rather than some heat tolerant freshwater fish such as common carp. In addition, the phylogenetic tree was also constructed by the neighbor-joining method using the PHYLIP program. The neighbor-joining tree of the striped snake-head fish Mb showed the similar evolution as a result of the unrooted phylogenetic tree (Fig.16). The striped snake-head fish Mb is found in the same group of the fish species but locates in the vicinity of marine fishes. 
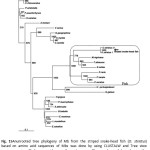 |
Figure 15: Anunrooted tree phylogeny of Mb from the striped snake-head fish (O. striatus) based on amino acid sequences of Mbs was done by using CLUSTALW and Tree view program, using Phalacrocoracidae as the out group. The numbers of branch are the confidence levels calculated from 1000 replicate analyses. Click here to View figure |
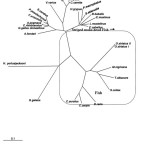 |
Figure 16: Phylogenic tree of Mbs from the striped snake-head fish (O. striatus) based on amino acid sequences of Mbsby the neighbor-joining method. Click here to View figure |
Atlantic blue marlin, chub mackerel and yellowfin tuna are probably one of the most active and high energetic fish. This behavior correlates with Mb concentration in their muscle45. Moreover, these fish can maintain maximal function of the oxidative locomotor muscles when the water temperature changes to be high46. This is also supported by high levels of Mb found in these fishes which serve to maintain contractility and facilitate an oxygen diffusion period rather than keep oxygen storing during low ambient oxygen. From phylogeny results, it might be implied that one role of either MbI or MbII in the stripped snake-head fish muscle is the oxygen carrier as same as Atlantic blue marlin, yellowfin tuna and mackerel.
Three-dimensional structure of the fish Mb
In order to insight understand the structural organization of the striped snake-head Mb and its structural-functional relationship, three-dimensional structure of the fish Mbs was constructed by using SWISS-MODEL, a homology modeling server, combined with Deep view program47. The ribbon structure of striped snake-head fish Mb, as shown in Fig.17 (a), indicates the characteristic of teleost Mb which the absent D-helix and the present of the random coil loop instead. While that of mammalian Mb contains D-helix (Fig.17 (b)). This structural change of the D-helix may be a major contributing factor to the oxygen dissociation kinetics differences observed between teleost and mammalian Mb11,48.
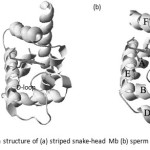 |
Figure 17: Ribbon structure of (a) striped snake-head Mb (b) sperm whale Mb Click here to View figure |
The 0.91 Å resolution three-dimensional structures of the striped snake-head fish Mb which showed amino acid residues not in helices is shown in Fig.18. This fish Mb maintains the characteristic tertiary globin fold found in other vertebrate Mbs along with the conserved architecture and environment of active site found in other species49, but difference in some residues which both forming in helical structure and not in helical one.
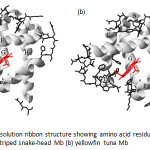 |
Figure 18: The 0.91 Å resolution ribbon structure showing amino acid residues not in helices and its side chain of (a) striped snake-head Mb (b) yellowfin tuna Mb Click here to View figure |
Typically, teleost Mbs have sets of two groups sharing a set of the conserved residues, particularly involved in oxygen-binding pocket and the interactions with the heme group. Also, the striped snake-head fish Mb contains these conserved residues at proximal histidine (His60) and distal histidine (His93) but difference in the amino acids located closed to them. Moreover, in some conserved area among the close evolution fish Mb, the amino acid residues of Mb in the striped snake-head fish differ from those of Mbs. Fig.19 shows three dimensional structure of the striped snake-head fish Mb which showed both different amino acid residues in the conserved area and amino acid residues not in helices.
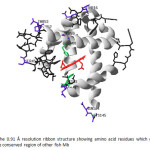 |
Figure 19: The 0.91 Å resolution ribbon structure showing amino acid residues which different from the conserved region of other fish Mb Click here to View figure |
The amino acid residues in the fish Mb sequence which differ from the conserved area of other fish Mb are Thr16, Ser45, Pro52, Thr53, Ser59, Asn94, Met107, Glu109, Asn144 and Cys145. Most of the residues have hydroxyl group in the molecule but the amino acid residues at the same position in the conserved region of other fishes are non-polar residues50. The hydrophilic and hydrophobic residues in Mb structure of the striped snake-head fish are shown in Fig.20. The modeling structure confirms that the outside of the Mb compact structure contains many hydrophilic residues which can form H-bonding to other which help stabilize the structure of the fish Mb. Therefore, the striped snake-head fish Mb may have a high stability. These suggestions may support the living habitat as either higher tolerance to hypoxia condition or high temperature water of the striped snake-head fish than other fishes.\
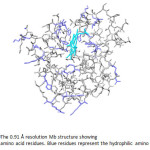 |
Figure 20: The 0.91 Å resolution Mb structure showing entire amino acid residues. Blue residues represent the hydrophilic amino acids. Click here to View figure |
Moreover, the distance between the distal His, the proximal His and Fe atom in the hemepocket was investigated by using 3D molecule viewer exists in Vector NTI program. The distances between distal His-Fe atom and between proximal His -Fe atom are found to be 4.36 Å and 5.61 Å, respectively (Fig.21).
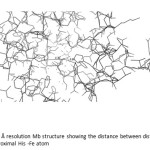 |
Figure 21: The 0.91 Å resolution Mb structure showing the distance between distal His -Fe atom and between proximal His -Fe atom Click here to View figure |
By comparison with some mammalian Mbs and other fish Mbs, the distance between distal His and Fe atom in the hemepocket of the striped snake-head fish Mb is shorter than that of sperm whale Mb and yellowfin tuna Mb (Table 4). Because the distal His has known to help stabilize the binding of O2 in Mb molecule, therefore the Mb structure of the striped snake-head Mb might serve strong binding of O2 molecule resulting in the tolerance in low O2 conditions of the fish. According to the distance between proximal His-Fe atom, the striped snake-head fish Mb gave shorter distance than yellowfin tuna Mb but longer distance than sperm whale Mb. The result indicates that the fish Mb is easily unfolded compared to the mammalian Mb51. Because the proximal His binds directly the Fe atom in the heme group with covalent bonding, the longer distance between these groups means the weaker interactions resulted less stability of the Mb structure. However, by comparing with that of yellowfin tuna, this fish Mb would exhibit higher stability.
Table 4: Distance between distal His, proximal His and Fe atom in the heme pocket of striped snake-head fish Mb compared withsperm whale and yellowfin tuna Mbs
|
Distance between His and Fe atom (Å) |
|||
|
Sperm whale |
Striped snake -head fish |
Yellowfin tuna |
|
| Distal His-Fe distanceProximal His-Fe distance |
4.5 2.2 |
4.36 5.61 |
4.40 5.71 |
Conclusion
The isolation and sequence analysis of cloned cDNA for Mb from striped snake-head fish revealed two lengths of nucleotide sequences different in 3´ untranslated regions (MbI and MbII genes), probably the results of gene duplication. In accordance to amino acid coding region, both genes encoded protein with 145 amino acid residues which were different in two amino acid residues at position 114 and 117. The results may indicate that Mbs are expressed to be Mb isoforms. The deduced amino acid sequences of the fish Mbs were very close to those of various fish species. Comparing with some freshwater fish Mbs, these amino acid sequences are identical to goldfish, common carp and zebra fish. Moreover, they are slightly two residues shorter than other fish Mbs which had closely amino acid sequences. There are amino acid differences among the fish Mbs and other Mbs that occur in the highly conserved regions in fish species. Interestingly, the evolution of this fish Mb reveals that this novel Mb was very close to the active behavior of Atlantic blue marlin, yellowfin tuna and chub mackerel which have very high content of Mb, but was not close to other freshwater fish. These evolution data corresponded to the highly active behavior of striped snake-head fish. This result may demonstrate that the facilitating of O2 diffusion may functional in the same manner as that of those sea fishes. Three-dimensional structure of the fish Mb reveals many hydrophilic residues located at the outside of molecule which can form H-bond to other and thus held stabilizing the fish Mb structure. Furthermore, the distance between Fe atom and distal histidine at position 60 which is known for O2 binding stability of Mb is 4.36 Å. This distance in the fish Mb is shorter than that of both sperm whale Mb and yellowfin tuna Mb. This is possible that the fish Mb might be served in strong binding of O2.
Acknowledgements
The research funding supported by Center of Excellence for Innovation in Chemistry (PERCH-CIC), Commission on Higher Education, Ministry of Education,and Ratchamangakala University of Technology Isan, KhonKaen, Thailand was gratefully acknowledged.
References
- Boonyaratparin, M.; Mccoy, E.W.; Chittapalapong, T. Food and agricultural organization of the United Nations. Project reports, Thailand. 1985.
- Brown, W.D.; Martinez, M.; Johnstone, M.; Olcoyy, H.S. J. Biol. Chem.1962,237, 81-84.
- Kooyman, G.L.; Ponganis. P.J. Annu. Rev. Physiol. 1998, 60, 19-32.
- Maeda, N.; Fitch, W.M. J. Biol. Chem. 1982, 257, 2806-2815.
- Peter, W.M.; Michael, J.B.; Michael, E.V.; Robert, E.C. Comp. Biochem. Physiol. B2004, 137(3), 341-350.
- Birnbaum, G.I.; Evans, S.V.; Przybylska, M.; Rose, D.R. Acta. Cryst.1994, D50, 283-289.
- Chaijan, M.; Benjakul, S.; Visessanguan, W.; Faustman, C. Food. Chem.2007, 100, 156-164.
- Jones, N.B.; Wang, C.C.; Dwulet, E.F.; Lehman, D.L.; Meuth, L.J.;Bogardt, A.R.;Gurd, R.N.F. Biochim. Biophys. Acta-Protein structure1979, 577, 454-463.
- Steers, Jr. E.; Davis, Jr. R.H. Comp. Biochemi. Physiol B1979, 62(4), 393-402.
- Tsubamoto, Y.; Matsuoka, A.; Yusa, K.; Shimaka, K. Eur. J. Biochem.1990, 193, 55-59.
- Kendrew, J.C.; Dickerson, R.E.; Strandberg, B.E.; Hart, R.G.; Davies, D.R.; Phillips, D.C.; Shore, V.C. Nature1960, 185, 422-427.
- Phillips, S.E.V.; Schoenborn, B.P. Nature1981, 292, 81-82.
- Marcinek, D.J.; Bonaventura, J.; Wittenberg, J.B.; Block, B.A. Am. J. Physiol. Reg. Integr. Comp. Physiol. 2001, 280, 1123-1133.
- Wittenberg, B.A.; Wittenberg, J.B. J. Biol. Chem.1975, 250, 9038-9043.
- Wittenberg J. B.; Wittenberg, B. A. Annu. Rev. Biochem.1981, 51, 857-878.
- Edmunson, A. B. Nature1965, 205, 883-887.
- Oord Van den, A.H.A.; Wesdorp, J.J.; Van dem, A.F.; Verheij, J.A. Euro. J. Biochem.1969, 10, 140-145.
- Awad, E.S.; Kotite, L. Biochem. J.1966, 98, 909-914.
- Maeda, N.; Fitch, W.M. J. Biol. Chem.1981, 256, 4293-4300.
- Dosi, R.; Maro, D.A.; Chambery, A.; Colonna, G.; Costantini, S.; Geraci, G.; Parente, A. Comp. Biochem. Physio. Part B2006, 145, 230-238.
- Chow, C-J.; Wu, J-C.; Lee, P.-F.; Ochiai, Y.Comp. Biochem. Physiol. B 2009, 154, 274-281.
- Ochiai, Y.; Watanabe, Y.; Ozawa, H.; Ikegami. S.; Uchida. N.; Watanabe, S. Biosci. Biotechnol. Biochem. 2010, 74, 1673-1679.
- Ochiai, Y. WASET2011, 74, 731-735.
- Gidding, G.G. Crit. Rev. Food Sci. Techno.1973, 35, 117-140.
- Livingston, D.J.; Brown, W.D. Food Technol.1981, 35(5), 244-252.
- Postnikova, G.B.; Tselikova, S.V.; Kolaeva, S.G.; Solomonov, N.G. Comp. Biochem. Physiol. B 1999, 124(1), 35-37.
- Roesner, A.; Mitz, S.A.; Hankeln, T.; Burmester, T. FEBS. J.2008, 275, 3633-3643.
- Chow, C.J. J. Agric. Food. Chem.1991, 39, 22-26.
- Ueki, N.; Ochiai, Y. Fish. Sci.2004, 70, 875-884.
- Stewart, J.M.; Blakely, J.A.; Karpowicz, P.A.; Kalanxhi, E.; Thatcher, B.J.; Martin, B.M. Comp. Biochem. Physiol. B2004, 137, 401-412.
- Fosmire, G.J.; Brown, W.D. Comp. Biochem. Physiol.1976, 55B: 293-299.
- Ueki, N.; Chaujen, C.; Ochiai, Y. J. Agric. Food. Chem.2005, 53, 4968-4975.
- Chen, L.C.; Lin, S.B.; Chen, H.H. Fish. Sci.2004, 70, 293-298.
- Dewilde, S.; Winnepennincks, B.; Arndt, M.H.L.; Nascimento, D.G.; Santoro, M.M.; Miller, A.N.; Kerlavage, R.A.; Geoghagen, N.; Marck, E.V.; Liu, L.X.; Weber, R.E.; Moens, L. J. Biol. Chem.1998, 273, 13583-13592.
- Delmotte, N.; Mayr, B.; Leinenbach, R. K.; Kohbacher, O.; Klein, C.; Huber, C. J. Proteome Res. 2006, 414-421.
- Schreiter, E.R.; RodrGuez, M.M.; Weichsel, A.; Montfort. W.R.; Bonaventura, J. J. Biol. Chem. 2007, 282, 19773-19780.
- Cossins, A.R.; Williams, D.R.; Foulkes, N.S.; Berenbrink, M.; Kipar, A. J. Exp. Biol.2009, 212, 627-638.
- Helbo, S.; Dewilde, S.; Williams, D.R.; Berghmans, H.; Berenbrink, M.; Cossins, A.R.; Fago, A. Am. J. Physiol. Reg. Integr. Comp. Physiol.2012, 302, 693-701.
- Ohno, S. Evolution by Gene Duplication. Springer Verlag, Berlin, 1970.
- Wu, J.T.; Pleper, R.K.; Wu, L.H.; Peters, J.L.Adv. Clin. Chem.1989, 35(55), 778-782.
- Tachida, H.; Kuboyama, T. The Genetics Society of America1998, 149, 2147-2158.
- Chotichayapong, C.; Wiengsamut, K.; Chanthai, S.; Sattayasai, N.; Tamiya, T.; Kanzawa, N.; Tsuchiya, T. Fish Physiol. Biochem.2012, 38(5): 1533-1543.
- Shiraki, K.; Kudou, M.; Fujiwara, S.; Imanakab, T.; Takagi, M. J. Biochem.2002, 132, 591-595.
- Hamoir, G.; Konosu ,S. Biochem. J.1965, 96, 85-96.
- Gibb, A.C.; Dickson, K.A. Integr. Comp. Biol.2002, 42, 199-207.
- Dickson, K.A.; Donley, J.M.; Sepulveda, C.; Bhoopat, L. J. Exp. Biol.2002, 205, 969-980.
- Arnold, K.; Bordoli, L.; Kopp, J.; Schwede, T. Bioinformatics 2006, 22,195-201.
- Madden, P.W.; Babcock, M.J.; Vayda, M.E.; Cashon, R.E. Comp. Biochem. Physiol. B2004, 137, 341-350.
- Philips, S.E. J. Mol. Biol. 1989, 142, 531-554.
- Macgregor, R.B.; Weber, G. Nature 1986, 319(6048), 70-73.
- Chanthai, S.; Ogawa, M.; Tamiya, T.; Tsuchiya, T. Fish. Sci.1996, 62, 927–932.

This work is licensed under a Creative Commons Attribution 4.0 International License.
![]()
A New Edition of Web of Science
Journal Impact Factor
2022: 0.5
Five Year: 0.8
Journal is Indexed in

Cabells Whitelist
![]()


