Bioanalytical Method Development and Validation for Simultaneous Estimation of Paracetamol and Cefixime by using RP-HPLC in
1A.K.R.G. College of Pharmacy, Nallajerla - 534112, India.
2*V.V. Institute of Pharmaceutical Sciences, Gudlavalleru - 521356, India.
3Bharat School of Pharmacy, Mangalpalli - 501510, India.
Corresponding Author Email: dralrao@gmail.com
DOI : http://dx.doi.org/10.13005/ojc/320178
Download this article as:
![]()
A novel approach was used to develop and validate a bioanalytical RP-HPLC method for the simultaneous estimation of Paracetamol and Cefixime in rabbit plasma using Cefaclor as internal standard. Evaluation of the content of drugs were done by employing a mixture of Phosphate buffer (pH 6.4) and Acetonitrile (80:20, v/v) as the mobile phase and measure the absorbance at 245nm for Paracetamol and Cefixime. Retention time was established to be 3.618min for Cefaclor, 4.608min for Paracetamol and 5.914min for Cefixime. The results shown that the analytical technique furnished here establishes acceptable accuracy and precision, shorter and easy sample preparation, reduced the complications for equipment on satisfactory analysis time.
KEYWORDS:Paracetamol; Cefixime, Bioanalytical; Simultaneous; Development
Introduction
Paracetamol (Figure 1) is chemically N-(4-hydoxyphenyl) ethanamide and it was a non-steroidal anti-inflammatory drug having potent antipyretic, analgesic and anti-inflammatory action1-2. Paracetamol was used for the pains and high temperature fevers3. Paracetamol acts by selectively inhibiting the prostaglandin biosynthesis. The bioavailability of the Paracetamol was 80% 4.
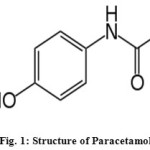 |
Figure 1: Structure of Paracetamol |
Cefixime (Figure 2) is chemically (6R,7R)-7-((2-(2-amino-1,3-thiazol-4-yl)-2-(carboxymethoxyimino)acetyl)amino)-3-ethenyl-8-oxo-5-thia-1-azabicyclo(4.2.0)octo-2-ene-2-carboxylic acid and it was a third generation cephalosporin antibiotic used for the several bacterial infections5-6. Cefixime acts by binding to specific penicillin binding protein leads to inhibiting bacterial cell wall synthesis and the bioavailability was 40% to 50%7.
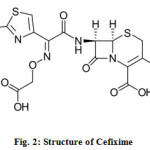 |
Figure 2: Structure of Cefixime |
Cefaclor (Figure 3) is chemically 3-chloro-7-D-(2-phenylglycinamido)-3-cephem-4-carboxylic acid monohydrate and it was a semisynthetic cephalosporin antibiotic for oral administration. Cefaclor is used to reduce the development of drug-resistant bacteria.
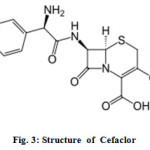 |
Figure 3: Structure of Cefaclor |
Literature survey revealed that few analytical methods have been reported for estimation of Paracetamol and Cefixime individually or in combination with other drugs. The reported methods are Spectrophotometric8-10, HPLC11-14, HPTLC15-16 and LC-MS17-18. Although no method was reported for the simultaneous estimation of Paracetamol and Cefixime in combined pharmaceutical formulations.
The present study was aimed to develop a simple, sensitive, rapid, precise and accurate and validated the bionalytical method19 for simultaneous estimation of Paracetamol and Cefixime according to ICH guidelines20 by using high performance liquid chromatography in rabbit plasma.
Experimental
Chemicals, reagents, standards and samples
Blank rabbit plasma, pure samples of drugs like Paracetamol, Cefixime and Cefaclor was obtained from Spectrum Pharma Research Solutions, Hyderabad, India. Analytical grade of Orthophosporic acid was obtained from SD Fine Chemicals Ltd., Mumbai, India. HPLC grade of Acetonitrile and Water was obtained from Qualigens Fine Chemicals, Mumbai, India.
Instrumentation
The analysis was performed by using a chromatographic system Water 2695 series HPLC comprised of vacuum degas, auto injector, dual gradient pump with photo diode array detector. The HPLC system was equipped with Empower 2 software.
Chromatographic conditions
Paracetamol and Cefixime was analysed in ODS C18 column (250mmx4.6mm, 5µm particle size) for the chromatographic separation. The mobile phase was composed of Phosphate buffer (pH 6.4) and Acetonitrile (80:20, v/v) and was used as diluent. Filtered through 0.45µm nylon membrane filter under vacuum filtration and pumped at a temperature of 300C, at flow rate of 1ml/min with UV detection wavelength at 245nm. Injection volume was 10μl. The run time was 8min and the retention time of Paracetamol and Cefixime was found to be 4.608min and 5.914 min respectvily.
Preparation of stock solutions
Primary stock solutions of Paracetamol and Cefixime were prepared individually by dissolving 10mg of each in 25ml volumetric flask in diluent. Series of working solutions of Paracetamol and Cefixime were prepared by the suitable dilution of the stock solutions with same diluent to achieve the concentration range of 10-100μg/ml for Paracetamol and 5-50μg/ml for Cefixime.
Procedure
The standard solutions were prepared by dilution of the stock solution with diluent to obtain a concentration range 10-100μg/ml for Paracetamol and 5-50μg/ml for Cefixime. Triplicate of 10μl injections were prepared for each concentration and chromatographed under the conditions reported above. The peak area of each concentration was plotted against the corresponding concentration for getting the calibration curve and the regression equation was computed.
Preparation of spiked plasma sample
250µl of rabbit plasma, 50µl of internal standard, 10µl of Paracetamol and 10µl of Cefixime were pipetted into 10ml centrifuge tube and to it 2ml of Acetonitrile was added. The mixture was mixed shortly, standing for 5min at room temperature, then vortex for 3 min, finally the mixture was centrifuged at 3200rpm for 10min. After the centrifugation, 10 μl of the supernantant layer was collected and injected into HPLC.
Calibration and linearity
Calibration curves were plotted in the concentration range of 10-100μg/ml and 5-50 μg/ml for Paracetamol and Cefixime respectively of required concentrations in the measured samples. Triplicate of 10μl injections were constructed for each working standard solution. The peak area for each concentration was measured and subsequently to draw against the each concentration to obtain the calibration curve.
Method validation
Linearity
Calibration curves showed the relation between the concentrations of drugs versus peak area were established. Results manifest linear relationship in the range of 10-100μg/ml and 5-50μg/ml for Paracetamol and Cefixime. In two drugs run from which linear regression equation was measured by following ICH guidelines shown in Figure 4 and Figure 5.
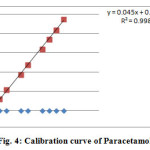 |
Figure 4: Calibration curve of Paracetamol |
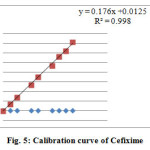 |
Figure 5: Calibration curve of Cefixime |
Precision and accuracy
Results from the validation data from rabbit plasma were within the acceptable limits. Within batch precision method was measured to range from 6.21 to 8.96% for Paracetamol and 3.16 to 7.73% for Cefixime. The accuracy of the method was measured in the range of 96.33 to 106.0% for Paracetamol and 96.00 to 105.67% for Cefixime shown in Table 1.
Table 1: Precision and accuracy
|
Within batch |
LLOQ QC |
|
LQC |
|
MQC |
|
HQC |
|
|
Paracetamol |
Cefixime |
Paracetamol |
Cefixime |
Paracetamol |
Cefixime |
Paracetamol |
Cefixime |
|
|
Mean |
106 |
105.67 |
103.65 |
96 |
100.37 |
96.33 |
96.33 |
102.67 |
|
S.D (+/-) |
0.013 |
0.008 |
0.05 |
0.006 |
0.089 |
0.037 |
0.037 |
0.053 |
|
C.V (%) |
6.21 |
3.16 |
8.05 |
3.16 |
8.96 |
7.73 |
7.73 |
5.80 |
Recovery
The analyte recovery for the Paracetamol and Cefixime were measured to be 50.63% and 51.74% respectively. The internal standard for Cefaclor was found to 57.20% shown in Table 2.
Table 2: Recovery studies
|
Paracetamol |
Cefixime |
Cefaclor |
|
|
Mean |
50.63 |
51.74 |
57.20 |
|
S.D (+/-) |
1.98 |
1.42 |
0.509 |
|
C.V (%) |
3.93 |
2.75 |
8.17 |
Stability studies
Long term stability
The concentration of sample of stability ranged between 99.27 to 104.86% for Paracetamol and 93.08 to 98.71% for Cefixime of the utility value shown in Table 3.
Table 3: Long term stability studies
|
|
LQC |
HQC |
||
|
Paracetamol |
Cefixime |
Paracetamol |
Cefixime |
|
|
Mean |
99.27 |
98.71 |
104. 86 |
93.08 |
|
S.D (+/-) |
0.049 |
0.018 |
0.170 |
0.085 |
|
C.V (%) |
8.41 |
8.82 |
9.09 |
9.63 |
Freeze-thaw stability
The sample concentration of freeze-thaw stability was measured to be 97.83 to 104.83% for Paracetamol and 100.97 to 104.60% for Cefixime of utility concentraton showing the stability of the drug above three freeze-thaw cycles shown in Table 4.
Table 4: Freeze-thaw stability studies
|
|
LQC |
HQC |
||
|
Paracetamol |
Cefixime |
Paracetamol |
Cefixime |
|
|
Mean |
104.8 |
104.6 |
97.83 |
100.97 |
|
S.D (+/-) |
0.035 |
0.012 |
0.185 |
0.056 |
|
C.V (%) |
5.57 |
6.19 |
9.84 |
5.83 |
Bench top stability
The drug was developed to be stable for at least 4 hours on bench top at room temperature. The freshly spiked calibration standards against back calculated concentration was within a range of 94.02 to 107.54% for Paracetamol and 88.92 to 103.54% for Cefixime of the utility concentration shown in Table 5.
Table 5: Bench top stability studies
|
|
LQC |
HQC |
||
|
Paracetamol |
Cefixime |
Paracetamol |
Cefixime |
|
|
Mean |
107.54 |
103.54 |
94.02 |
88.92 |
|
S.D (+/-) |
0.0143 |
0.062 |
0.009 |
0.169 |
|
C.V (%) |
6.91 |
10.36 |
10.40 |
9.97 |
Sample stability
The concentration of sample of stability was measured range of 99.46 to 99.94% at 2-80C and 98.73 to 101.38% at room temperature for Paracetamol and Cefixime, respectively shown in Table 6.
Table 6: Sample studies
|
|
LQC |
HQC |
||
|
Paracetamol |
Cefixime |
Paracetamol |
Cefixime |
|
|
Mean |
99.46 |
98.73 |
99.94 |
101.38 |
|
S.D (+/-) |
0.018 |
0.018 |
0.994 |
0.958 |
|
N |
3 |
3 |
3 |
3 |
Reults and Discussion
Different stationary phases were tried with various columns, poor and bend peakes were observed with different columns while C18 column gave satisfactory resolution and free from tailing. Several mobile phases used like Methanol with Acetonitrile were found to separate the compounds doubtful and Potassium dihydrogen phosphate buffer with Acetonitrile lead to good separation. The present study objective was acquired using mobile phase be composed of Phosphate buffer: Acetonitrile in the ratio of 80:20, v/v with the pH adjusted to 6.4±0.2 with Orthophosphoric acid. The mobile phase composition is optimized under described conditions, free from tailing, peaks are well defined, resolved, the tailing factors were < 2 for all peaks. The retension times for Paracetamol was 4.608 min and for Cefixime was 5.914min respectvily, at flow rate of 1ml/min. The optimum wavelength for detection was 245nm at where much better detector responses for the two drugs were obtained. The chromatograms of rabbit plasma blank and drugs Cefaclor, Paracetamol and Cefixime were shown in Figure 6 & 7 respectively.
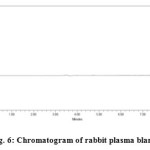 |
Figure 6: Chromatogram of rabbit plasma blank |
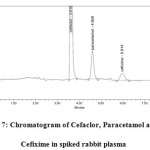 |
Figure 7: Chromatogram of Cefaclor, Paracetamol and Cefixime in spiked rabbit plasma |
Acknowledgements
The authors are thankful to A.K.R.G. College of Pharmacy, Nallajerla, India for providing necessary facilities for carryout the research work. The authors are thankful to Spectrum Pharma Research solutions, Hyderabad, India for providing the pure drugs like Paracetamol, Cefixime and Cefaclor.
References
- British National Formulary, British Medical Association and Royal Pharmaceutical Society, Joint Formulary Committee, London. 2015, 66.
- Ayoub, S.S.; Botting, R.M.; Goorth, S.; Willoughby, D.A. Proc. Nati. Acad. Sci., 2014, 101, 11165-11169.
CrossRef - Hinz, B.; Cheremina, B.O.; Brune, K. FASEB J. 2007, 22, 383-390.
CrossRef - Smilkstein, M.L.; Kanpp, G.L.; Kullig, K.W. N. Engl. J. Med., 1988, 18, 1557-1562.
CrossRef - Mcmillan, A.; Young, H. Int. J. STD. AIDS., 2007, 18, 253-254.
CrossRef - Adam, D.; Hostalek, U.; Troster K. Infection, 1995, 23 Suppl 2, S83-S86.
CrossRef - Patil, S.P.; Hajare, A.L.; Krishna, K.P. Int. J. Basic Clin. Pharmacol., 2014, 3, 943-946.
- Behera, S.A.; Ghanty, S.; Ahmad, F.; Santra, S. J. Anal. Bioanal. Tech., 2013, 3, 2-6.
- Sharma, S.; Pareek, A.; Joshi, R.; Yashumati, R.B.; Jain, V.; Jadon, G. Orient J. Chem., 2013, 29, 787-792.
CrossRef - Venkatesan, S.; Kannappan, N. Int. J. Pharm. Pharm. Sci., 2013, 3, 130-135.
- Devi, T.A.P.; Setti, A.; Nallapeta, S.; Pawar, S.C.; Rao, J.V. J. Med. Allied Sci., 2013, 3, 8-14.
- Calinescu, O.; Badea, I.A.; Vladescu, L.; Meltzer, V.; Pincu, E. J. Chromatogr. Sci., 2012, 50, 335-342.
CrossRef - Lalitha, K.V.; Golla, M.M.; Reddy, J.R.; Kumar, K.V.; Aliekya, A. J. Scient. Innova. Res., 2013, 2, 634-641.
- Khandagle, K.S.; Gandhi, S.V.; Deshpande, P.B.; Gaikwad, N.V. Int. J. Pharm. Pharm. Sci., 2010, 3, 46-48.
- Yadav, S.S.; Jagtap, A.S.; Rao, J.R. Der Pharma. Chemica, 2012, 4, 1798-1802.
- Dhoka, M.V.; Gawande, V.T.; Joshi, P. Eurasian J. Anal. Chem., 2013, 8, 99-106.
- Trettin, A.; Jordan, J.; Tsikas, D. J. Chromatogr. B. Analyt. Technol. Biomed. Life Sci., 2014, 1, 177-178.
- Meng, F.; Chen, X.; Zhong, D. J. Chromatogr. B. Analyt. Technol. Biomed. Life Sci., 2005, 819, 277-282.
CrossRef - Gaurav, T.; Ruchi, T. Pharm. Methods, 2010, 1, 25-38.
CrossRef - International Conference on Harmonization, Q2(R1), Geneva, Switzerland. 1996.


ISSN Online: 2231-5039

![]()


