Adsorptive removal of lead and cadmium ions using Cross -linked CMC Schiff base: Isotherm, Kinetics and Catalytic Activity
P. Moganavally 1, M. Deepa*2, P. N. Sudha3 and R. Suresh4
1Research and Development Centre, Bharathiyar University, Coimbatore, India
2Department of Chemistry, Muthurangam Govt. Arts College, Vellore, India
3PG and Research Department of Chemistry, D.K.M College for Women, Vellore, India
4 Government Polytechnic College, Nagapadi, Thiruvannamalai, India
Corresponding author E-Mail: deeparam79@gmail.com
DOI : http://dx.doi.org/10.13005/ojc/320150
Article Received on :
Article Accepted on :
Article Published : 01 Mar 2016
Water plays a vital role to human and other living organisms. Due to the effluent coming from chemical industries, the industrial activity, contamination of ground water level is goes on increasing nowadays. Therefore, there is a need to develop technologies that can remove toxic pollutants in wastewater. Hence the cross linked Carboxymethyl chitosan(CMC)/ 2,3-dimethoxy Benzaldehyde Schiff base complex has been synthesized and characterized by using FT-IR and SEM analysis. All these results revealed that cross linked Schiff base has formed with high adsorption capacity. The prepared effective adsorbent used for the removal of heavy metals like lead (II) and cadmium (II) ions from aqueous solution and the adsorption data follow the Freundlich model, which follows pseudo first order kinetics. Effect of various parameters like solution pH, adsorbent dose and contact time for the removal of heavy metals has been studied. The synthesized sample undergoes catalytic oxidation process significantly at 24 hrs. The results showed that cross linked Schiff base is an effective, eco-friendly, low-cost adsorbent.
KEYWORDS:Carboxymethyl chitosan; Gluteraldehyde; adsorption; catalytic activity
Download this article as:| Copy the following to cite this article: Moganavally P, Deepa M, Sudha P. N, Suresh R. Adsorptive removal of lead and cadmium ions using Cross -linked CMC Schiff base: Isotherm, Kinetics and Catalytic Activity. Orient J Chem 2016;32(1). |
| Copy the following to cite this URL: Moganavally P, Deepa M, Sudha P. N, Suresh R. Adsorptive removal of lead and cadmium ions using Cross -linked CMC Schiff base: Isotherm, Kinetics and Catalytic Activity. Orient J Chem 2016;32(1). Available from: http://www.orientjchem.org/?p=14399 |
Introduction
Chitosan, the most abundant natural polysaccharide, is produced by the deacetylation of chitin which is one of the key constituents of the shells of crustaceans and a byproduct of the fishing industry. Chitosan is an inexpensive and renewable material with many applications in cosmetics, pharmaceuticals, food science and biotechnology 1-2. Due to the poor solubility of chitosan, O- carboxymethyl chitosan, which is a water soluble chitosan derivative, have attracted much attention as it widened its applications. Carboxymethyl chitosan is not only a good solubility, but also possess unique chemical, physical and biological properties 3. Carboxymethyl chitosan is formed by means of carboxymethylation, as some of the –OH of chitosan were replaced by –CH2COOH groups. Therefore, the reactive ligands like –COOH and –NH2 groups are still ready to undergo chemical modifications to improve its physical properties. In comparison to chitosan, CMC has higher moisture absorption, retention, better biological, chelating and sorption properties 4-6. Generally, Schiff based material exhibits wide range of applications, hence the water soluble CMC has to be modified into Schiff base with 2,3 -dimethoxy Benzaldehyde.
Crosslinking is another method adopted to improve the properties of Carboxymethyl chitosan Schiff bases. Crosslinking agents are generally structured in many forms like rings, straight chains, and branched chains. There are several crosslinking agents like gluteraldehyde, formaldehyde, glyoxal etc. In general, adsorption capacity decreases with the extent of crosslinking, as it decreases the reactive sites on the polymer. But in some cases it also improves the adsorption capacity, depending on the functional groups in the crosslinking agent 7. The chitosan and chitosan crosslinked with gluteraldehyde has reported in the previous literatures 8-9 and their application in the removal of heavy metals10 and biological property have been discussed. The metal selected for our study is lead and cadmium. Therefore in the present work, Chitosan modified to Carboxymethyl chitosan, by considering the solubility the modification made and to improve in applications, it has been crosslinked. Carboxymethyl chitosan /2,3-dimethoxy Benzaldehyde Schiff base was cross linked by using gluteraldehyde has been synthesized and characterized using the techniques like FT-IR, XRD, SEM, Catalytic activity and investigated for its adsorption capacity and its kinetics.
Materials and methods
Materials
Carboxymethyl chitosan were purchased from India Sea Foods, Cochin, Kerala, India. The aldehyde such as 2, 3- dimethoxy Benzaldehyde and gluteraldehyde were purchased from Sigma Aldrich, India. All the chemicals used were of analytical grade.
Synthesis of Carboxymethyl chitosan Schiff Bases (CMC-SB)
The Carboxymethyl chitosan Schiff base is prepared already and reported in the literature 11.
Synthesis of cross-linked Carboxymethyl chitosan Schiff Bases (CMC-SB)
The synthesized Carboxymethyl chitosan Schiff base product was dissolved in water and stirred at room temperature for 30 min. Then gluteraldehyde was added to the mixture. The mixture was stirred and heated at 60°C for 12 h under water bath heating. After cooling, the crude product was washed with ethanol to the point of colorless filtrate. The product was dried at 60°C in vacuum for 24 h 12. The cross linked Carboxymethyl chitosan Schiff base (GLU-CMC-SB) structure is shown in Figure-1.
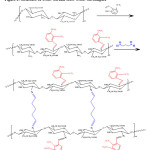 |
Figure 1: Structure of CMC-SB and GLU-CMC-SB complex |
Characterization of CMC & C-CMC Schiff base complex
FT-IR spectroscopy was measured to determine the type of bonds. Fourier transform infrared spectra of CMC-Schiff base and its cross linked derivatives using KBR pellet method were recorded in the frequency range of 400 – 4000 cm-1 using Thermo Nicolet AVATAR 330 spectrophotometer. X – ray diffractograms of samples were obtained using an X – ray powder diffractometer (XRD – SHIMADZU XD – D1) with Ni – filter and Cu Kα radiation source. The relative intensity was recorded in the scattering range 2θ, varying from 10o to 90o. The surface morphology and cross section morphology of CMC- Schiff base and its cross-linked derivatives were observed with scanning electron microscopy to verify the compatibility of the mixtures of CMC-SB derivatives. To analyze the samples, the films were cut into pieces of various sizes and wiped with a thin gold – palladium layer by a sputter coater unit (UG – microtech, UCK field, UK) and the cross section topography was analyzed with Cambridge Stereoscan 440 Scanning Electron Microscope (Leica, Cambridge UK).
Catalytic activity
The oxidation of cyclohexane was performed under the aerobic conditions. 10 mmol 30% hydrogen peroxide solution was added to the Schiff base complex (0.05 g) in 10 ml of acetonitrile in a 25 ml flask equipped with a magnetic stirrer and fitted with water condenser. With this reaction mixture, 5 mmol of cyclohexane was added and allowed to stir magnetically under 70 0C at atmospheric pressure conditions for 12 h. Aliquots were collected separately at 8 h and 12 h for the product analyses. Two separate blank experiments were also carried out, one without metal complex and one without H2O2, by keeping other experimental conditions unaltered to prove the importance of catalyst and H2O2 in the reaction. The collected product samples were analyzed with a Hewlett–Packard gas chromatogram (HP 6890) having FID detector. The conditions followed in the product analysis were, capillary column: HP-5, carrier gas: nitrogen, and flow rate: 0.5 cm3min-1. In the same way cross linked CMC Schiff base derivative also prepared.
The conversion percentage of cyclohexane was calculated as below:
Conversion % of cyclohexane = 100 × [Initial %- Final%] /Initial%
Heavy metal removal by batch adsorption studies
Synthetic solutions of Pb (II) ions and Cd (II) ions were taken in stopper bottles and agitated with schiff base and its crosslinked schiff base separately at 30oC in orbit shaker at fixed speed of 160rpm. The extent of heavy metal removal was investigated separately by changing adsorbent dose, contact time of shaking and changing pH of the solution. After attaining the equilibrium adsorbent was separated by filtration using filter paper and aqueous phase concentration of metal was determined with atomic adsorption spectrophotometer (Varian AAA 220 FS).
Adsorption isotherm studies
At the optimum conditions of adsorbent dose and pH, the synthetic solutions of Pb ions were agitated for one hour at various initial concentrations and amount of unadsorbed lead in the filtrate were
analysed. The same procedure is followed to analyse the Cd (II) ions. The values were fitted into Langmuir, Freundlich, Temkin and Dubinin – Radushkevich (D – R) adsorption isotherms.
Langmuir adsorption isotherm
In this study the following linearised form of the Langmuir isotherm was used.
Ceq / Cads = bCeq / KL + 1/ KL and Cmax = KL/b
Where
Cads = amount of metal ion adsorbed (mg/g)
Ceq= equilibrium concentration of metal ion in solution (mg/dm3)
KL =Langumir constant (dm3/g)
b = Langumir constant (dm3.mg)
Cmax= maximum metal ion to adsorb onto 1g chitosan (mg/g).
Freundlich adsorption isotherm
The Freundlich equation which is used is expressed as:
Cads = P Ceq1/n
In and linearised form of the Freundlich equation was used.
log Cads = log P + 1/n log Ceq
where
Cads = amount of metal ion adsorbed (mg/g)
Ceq= equilibrium concentration in solution (mg/dm3)
1/n = Freundlich constant (mg.g-1)
P = Freundlich constant (g.dm-3)
Temkin model
The Temkin model is linearly represented and generally applied in the form:
qe=B ln AT + B ln Ce
Where A and B are the Temkin isotherm constant (L/g) and heat of sorption (KJ/mol) respectively. R is the gas constant (J/mol/k), b is the Temkin isotherm constant linked to the energy parameter, B, T is the absolute temperature in kelvin as shown on equation:
b = RT/B
Dubinin-Radhushkevich isotherm
Dubinin – Radushkevich (D – R) isotherm helps to determine the nature of bonding either physisorption (or) chemisorption,
ln qe = ln qs – Kadε2
qm is the maximum adsorption capacity (mg/g).Kads is a D-R constant related to the energy of adsorption and ε is the Polanyi potential.
ε = RT ln [1+(1/Ce)]
The mean free energy of adsorption (E) calculated using eqn,
E= (2K)-0.5
Kinetics Studies
In the present study kinetics were calculated for both pseudo-first order, the pseudo second order kinetic models applied and expressed as follows.
Pseudo-first order kinetics
Rate expression is
log(qe-qt) = log qe – (k/2.303)t
qt and qe are the amounts of ion adsorbed at time t and at equilibrium (mg/g), k1 = rate constant (min-1)
Pseudo-Second order Kinetics
Rate expression is
t/qt = 1/k2qe2 + t/qe
where, k2 = second order kinetic constant (gmg-1min-1).
Results and Discussion
FTIR studies
Figure-2, 3 and 4 shows the FT- IR spectrum of the Carboxymethyl chitosan (CMC) and Carboxymethyl chitosan/2,3-dimethoxy Benzaldehyde Schiff base (CMC-SB) and cross linked gluteraldehyde Schiff base (Glu-CMC-SB) complex. The spectrum shows a broad peak at 3420 and 3418 cm-1 for CMC and CMC-SB, but in case of cross linked Schiff base complex appeared at 3436 cm-1 slightly higher, which indicates the intermolecular hydrogen bond O-H, N-H stretching and polymeric association with gluteraldehyde. The asymmetic C-H stretching was indicated by the peak at 2918 cm-1 for CMC, 2921 cm-1 for CMC-SB, and 2928 cm-1 for Glu-CMC-SB, this corresponding peak shift to the higher position reveals the incorporation of aromatic C-H bonds of aldehyde 13.
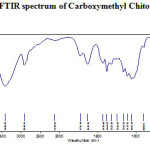 |
Figure 2: FTIR spectrum of Carboxymethyl Chitosan |
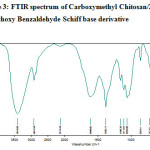 |
Figure 3: FTIR spectrum of Carboxymethyl Chitosan/2,3 -dimethoxy Benzaldehyde Schiff base derivative |
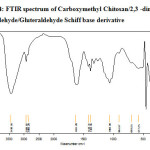 |
Figure 4: FTIR spectrum of Carboxymethyl Chitosan/2,3 -dimethoxy Benzaldehyde/Gluteraldehyde Schiff base derivative |
The peak at 1725 cm-1 in CMC has shifted to the lower wavenumber 1604 cm-1 in CMC-SB and 1631 cm-1 in Glu-CMC-SB complex. This band is most probably composed of amide band of Carboxymethyl chitosan, C=N stretching band of Schiff base were cross-linked with –CHO of gluteraldehyde 14. Moreover, it is not observed any band at ~ 1715 related to free aldehyde group 15. The absorption at 1418 cm-1 in Glu-CMC-SB represents the –CH- bending of –CH2– in gluteraldehyde, which is not present in CMC-SB complex. The FTIR spectrum of CMC, CMC-SB and Glu-CMC-SB showed its characteristic Schiff base formation peaks were in the range of 1598 – 1650 cm-1, confirming the presence of imine bond was formed between -NH group of carboxymethyl chitosan matrix and with the C=O group of gluteraldehyde. The decrease in the intensity of the peak for -NH2 group content, which indicates the participation of the amino group of the CMC polymer matrix with the aromatic aldehyde to form Schiff bases and crosslinked with gluteraldehyde 16. All these characteristics prove the formation of crosslinked CMC-SB has been prepared successfully.
XRD studies
The X-ray diffraction of CMC, CMC-SB and Glu-CMC-SB were shown in Figure -5, 6 and 7. The peaks of CMC obtained at 2θ = 20°, 29° and 46° were broad. For CMC-SB the peak was shifted to 2θ = 28°, 47° and 56°, this indicates the formation of Schiff base. The peaks are broad, which indicates that the prepared schiff base has semi crystalline nature. The XRD spectra of Glu -CMC-SB exhibits two broad peaks around 20° and 40°, indicates that the sample is going form crystalline to amorphous nature 17. Thus the interaction detected in this work decreases the membrane crystallinity.
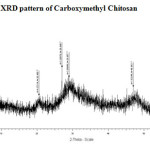 |
Figure 5: XRD pattern of Carboxymethyl Chitosan |
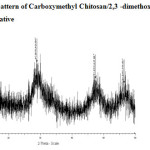 |
Figure 6: XRD pattern of Carboxymethyl Chitosan/2,3 -dimethoxy Benzaldehyde Schiff base derivative |
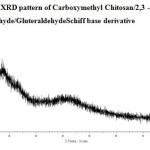 |
Figure 7: XRD pattern of Carboxymethyl Chitosan/2,3 -dimethoxy Benzaldehyde/GluteraldehydeSchiff base derivative |
SEM Analysis
The surface morphology of CMC, CMC-SB and Glu-CMC-SB complexes were shown in the Figure-8. From the SEM image we conclude that CMC shows a homogeneous smooth surface and CMC-SB shows rough surface due to the addition of aromatic aldehyde. Further, the rough porous surface is increased due to the addition of gluteraldehyde. Comparing the bare Schiff base with its Glu-CMC-SB complexes, the image of cross linked Schiff base complex shows the rough and dense surfaces with large number of pores. These large rough surfaces were more suitable for greater adsorbing property and biomedical applications.
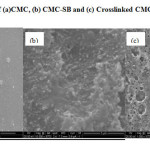 |
Figure 8: SEM image of (a)CMC, (b) CMC-SB and (c) Crosslinked CMC-SB |
Catalytic activity
The efficiencies of the CMC-SB and Glu-CMC-SB complex as catalysts for oxidation of cyclohexane to cyclohexanol is shown in the Table -1 and Figure-9. When the reaction time is increased, the conversion percentage of cyclohexane is also increased. The results reveals the catalytic activity of CMC-SB complex was more pronounced at 12 h and the yield is 49% compared to the cross linked Schiff base complex (yield is 47 %) which shows a bright future in industrial applications.
Table 1: Catalytic activity of CMC-SB
|
Samples |
% Conversion to Cyclohexanol | ||
| 4Hrs | 8Hrs | 12Hrs | |
|
CMC-SB |
27 |
34 |
49 |
|
Glu-CMC-SB |
23 |
32 |
47 |
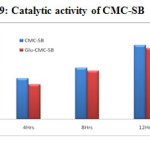 |
Figure 9: Catalytic activity of CMC-SB |
Removal of lead (II) and Cadmium (II) ions
Optimum metal adsorption was determined by investigating the parameters such as initial concentration of metal ions, sorbent dosage, pH and contact time of solution at constant temperature. The equilibrium data were fit into Langumir model, Freundlich, Temkin and Dubinin – Radushkevich (D-R) adsorption isotherms.
Effect of adsorbent dose
The adsorption dependence of Pb (II) and Cd (II) was studied by varying the amount of adsorbents from 1 – 6 gms, while keeping the pH and contact time as constant. From the Figure-10 and 11, the influence of adsorption process can be observed by increasing its adsorbent dosage. The removal efficiency increases with increase in the amount of adsorbent dosage; this is due to the greater availability of the exchangeable sites for the ions 18. After a certain amount of adsorbent (5-6gms), there is no further increase in adsorption. This shows that the maximum adsorption has attained and hence the ions attached to the adsorbent and the amount of free ions remains constant 19. The maximum % removal of Pb2+ was 87.7 % and 94.2 % in CMC-SB and Glu-CMC-SB respectively. In the removal of Cd (II) ions, the percentage of removal is 87.9 % and 94.1 % for CMC-SB and Glu-CMC-SB. The result reveals that the cross linked Schiff base complex exhibits more removal compared to the Schiff base.
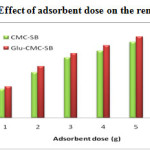 |
Figure 10: Effect of adsorbent dose on the removal of Pb2+ |
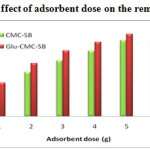 |
Figure 11: Effect of adsorbent dose on the removal of Cd2+ |
Effect of pH
The Figure – 12 and 13 shows the pH dependence in the removal efficiency of the lead and cadmium ions in the aqueous solution. Studies revealed that the system is strongly pH dependent, due to the nature of the chemical interactions with the functional group on the Carboxymethyl chitosan matrix. The optimum removal was obtained at pH 6 for Schiff base complex and pH 5 for cross linked Schiff base complex. With increase in the pH the adsorption also increases, due to the decrease in the competition between the H+ and the lead and cadmium ions for the same functional group. After the certain level of pH, the adsorption decreases due the insoluble hydroxide ions precipitating from the solution making the adsorption studies impossible.
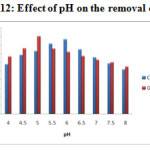 |
Figure-12: Effect of pH on the removal of Pb2+ |
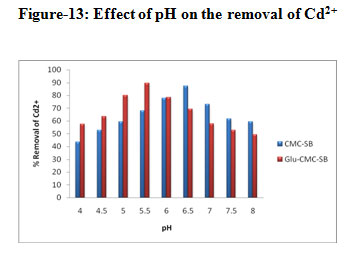 |
Figure-13: Effect of pH on the removal of Cd2+ |
Effect of Contact time
The Contact time is an important factor, which is useful for the wastewater treatment system. The influence of the contact time for the removal of the Pb2+ and Cd2+ ions was analysed by keeping the initial solution concentration 200 mg Metal (II)/L, pH 5 & 6 and adsorbent dosage 1g as constant. The observed results are presented in Figure-14 & 15. It was found that the removal efficiency of metal ions increased with increase in contact time to some extent, due to high transfer rate of the metal ions to the surface of the adsorbent particles. Further increases in contact time, the equilibrium have been attained and hence no further increase in adsorption 20-21. Thus the results illustrated that the optimum contact time for maximum removal of Pb2+ and Cd2+ were 360 min.
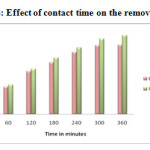 |
Figure 14: Effect of contact time on the removal of Pb2+ |
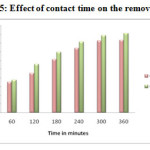 |
Figure-15: Effect of contact time on the removal of Cd2+ Click here to View figure |
Adsorption Isotherms
The adsorption isotherm is fundamental in describing the interactive behaviour between solutes and adsorbent, which express the surface properties and affinity of the adsorbent 22. The adsorption isotherm and its kinetics of CMC-SB complex for the removal of Pb (II) is already reported in the literature 11. Hence adsorption isotherm and kinetic study for the cross linking of CMC-SB complex is discussed below.
Langmuir adsorption isotherm
The Langmuir adsorption isotherm is one of the most widely used isotherms, proposed for the adsorption of a solid at a solid-liquid interface. It is assumed that each of which can adsorb one adsorbate molecule, i.e., monolayer adsorption made up of elementary sites 23. Another assumption is that there is no reaction between molecules adsorbed on neighbouring sites 24.
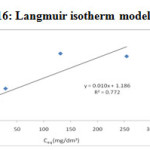 |
Figure-16: Langmuir isotherm model for Pb2+ |
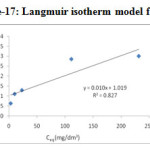 |
Figure-17: Langmuir isotherm model for Cd2+ |
The linearised Langmuir isotherm allows the calculation of adsorption capacities and Langmuir constant “b” and “KL”. With the help of the slope and intercept of linear plot of Ceq/Cads against Ceq shown in the Figure-16 &17, the Langmuir constants KL and b can be calculated and given in the
Table 2. Adsorption isotherm constant, Cmax and correlation coefficients
| Metal ions | Langmuir constants | |||
|
KL (dm3/g) |
b (dm3/mg) |
Cmax (mg/g) |
R2 |
|
|
Pd(II) |
0.8432 |
0.008432 |
100 |
0.772 |
|
Cd(II) |
0.9814 |
0.009814 |
100 |
0.827 |
Freundlich isotherm
The linearised Freundlich equation plot of log qe vs log Ce yielded a straight line as shown in Figure –18 & 19 and Table-3. The Freundlich isotherm model proposed a monolayer adsorption with a heterogeneous energetic distribution of active sites, and/or interactions between adsorbed species. Using mathematical calculation that an ‘n’ value between 1 and 10 represents beneficial adsorption25 .
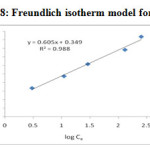 |
Figure 18: Freundlich isotherm model for Pb2+ |
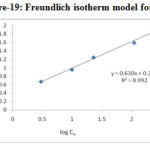 |
Figure 19: Freundlich isotherm model for Cd2+ |
Table 3. Coefficients of Freundlich isotherm model
| Metal ions | Freundlich constants | ||
|
KF (mg/g) |
n |
R2 |
|
|
Pd (II) |
2.2336 |
1.6529 |
0.988 |
|
Cd(II) |
2.2699 |
1.5873 |
0.992 |
Temkin Isotherm
The Temkin isotherm takes into account the interactions between adsorbents and metal ions to be adsorbed and is based on the adsorption, that the free energy of adsorption is simply a function of surface coverage. By plotting the quantity adorbed qe against ln Ce and the constants were determined from the slope and intercept shown in Figure-20 & 21 and calculated parameters in Table-4. From the figures, we determine the heat of adsorption (B) for Pb (II) and Cd (II) is 14.25 J /mol and 15.42 J/mol. The maximum binding energy (AT) for Pb (II) and Cd (II) is 0.2324 and 0.2398 L/g.
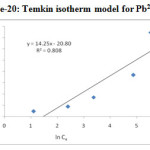 |
Figure 20: Temkin isotherm model for Pb2+ |
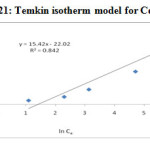 |
Figure 21: Temkin isotherm model for Cd2+ |
Table 4. Coefficients of Temkin isotherm model
|
Metal ions |
Temkin isotherm parameters |
|||
|
B (KJ/mol) |
AT (L/g) |
bT |
R2 |
|
|
Pd(II) |
0.01425 |
0.2324 |
173.86 |
0.8080 |
|
Cd(II) |
0.01542 |
0.2398 |
160.67 |
0.842 |
Dubinin – Radushkevich (D – R) sorption isotherm
Dubinin – Radushkevich model (Dubinin and Radushkevich, (1947) is postulated within a sorption space close to the sorbent surface to evaluate the sorption free energy and to help to determine the nature of bonding either physisorption (or) chemisorptions. By plotting the quantity adsorbed Ɛ2 against lnYe and Kads shown in Figure-22 & 23, qs and E were determined from the slope, intercept and given in Table – 5.
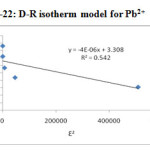 |
Figure 22: D-R isotherm model for Pb2+ |
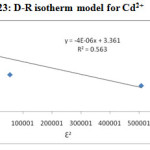 |
Figure 23: D-R isotherm model for Cd2+ |
Table 5. D-R Isotherm Parameters
|
Metal ions |
D-R isotherm parameters |
|||
|
qs (mg/g) |
Kads (mol2/J2) |
E (KJ/mol) |
R2 |
|
|
Pd(II) |
27.31 |
4×10⁻⁶ |
0.35361 |
0.542 |
|
Cd(II) |
28.80 |
4×10⁻⁶ |
0.35361 |
0.563 |
Comparison between Adsorption Isotherms:
The Table-2-5 illustrates the linear regression coefficient of four isotherms. On comparing these isotherm models in Figure -24, the observed R2 values of Freundlich isotherm (0.988 and 0.992) better describes the adsorption process very effectively when compared to the other models. Hence Freundlich model was followed and multilayer adsorption was suggests for the removal of metal ions by the Glu-CMC-SB. Further it can be proved by comparing the Temkin and D-R isotherm ‘E’ values, the mean free energy and the heat of adsorption values for Pb (II) and Cd (II) ions are lower than 20KJ/mol. According to Atkins, when the energy values are lower than 20KJ/mol, confirms the physisorption mechanism is followed. Physisorption is also called non-specific adsorption which occurs as a result of long range weak Van der waals forces between adsorbates and adsorbents 26.
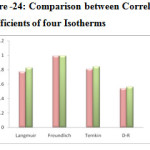 |
Figure 24: Comparison between Correlation Coefficients of four IsothermsClick here to View figure |
Adsorption Kinetics
The adsorption data of lead (II) and Cd (II) ion uptake by Glu-CMC-SB complex was fitted using Lagregren pseudo first order (Figure – 25) and pseudo second order model (Figure – 26).
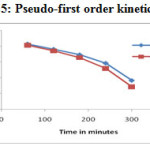 |
Figure 25: Pseudo-first order kinetics model |
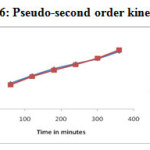 |
Figure 26: Pseudo-second order kinetics model |
Table 6: Comparison between Lagergren pseudo-first-order and pseudo-second-order kinetic models
| Metal ion | Pseudo-first-orderkinetic model | Experimental valueqe (mg/g) | Pseudo-second orderkinetic model | ||||
|
qe (mg/g) |
k1 (min-1) |
R2 |
qe (mg/g) |
k2 (g mg-1 min-1) |
R2 |
||
|
Pb (II) |
274.79 |
0.09212 |
0.927 |
187 |
333.33 |
1.5075×10⁻⁵ |
0.995 |
|
Cd(II) |
289.73 |
0.01152 |
0.939 |
182 |
333.33 |
1.3119 x10⁻⁵ |
0.993 |
A comparison between two kinetic models suggested in Table -6 and Figure -25 & 26, the correlation coefficient (R2) for the pseudo-second order kinetic model is much higher in comparison to pseudo-first order model. The close agreement between the experimental qe mg/g) values and the estimated qe (mg/g) values from pseudo-second order kinetic model. These facts suggest that obtained kinetic data followed the pseudo-second order kinetic model 27.
Conclusion
The cross linked Carboxymethyl chitosan Schiff base complex was successfully synthesized using gluteraldehyde. The FTIR result proves the cross linking of Schiff base and XRD shows that the sample goes from crystalline to amorphous nature, which makes the material suitable for waste water treatment. The SEM results clearly indicates the rough and porous nature of cross linked sample compared to the other samples, which increases the adsorption process and helps in the removal of heavy metals. All these results reveals that the prepared crosslinked Carboxymethyl chitosan Schiff base acts as a efficient biosorbent with good metal-binding capacity for the removal of heavy metals like lead and cadmium ions from aqueous solutions, The adsorption efficiency of the Crosslinked biopolymer can be further used for the study of waste water tannery effluent. From the regression coefficient, we conclude the adsorption follows Freundlich model rather than the others. The adsorption follows the physisorption also concluded from the Temkin and D-R models. Through kinetic studies we confirmed that the adsorption process follows pseudo second order kinetic model. The oxidation of cyclohexane was performed and it also increased upto 12h, which is very useful in industrial applications in future.
Reference
- Kim, S,J,; Shin, S,R,; Lee, Y,M,; Kim, S,I. Journal of Applied Polymer Science. 2003, 87(12),2011-2015.
CrossRef - Lei, C,X,; Hu, S,Q,; Shen, G,L,; Yu, R,Q. Talanta. 2003, 59 (5), 981-993.
CrossRef - Muzzarelli, R,A,A. Carbohydrate Polymers. 1988, 8(1),1-21.
CrossRef - Qin, Y. Journal of Applied Polymer science. 2006, 99(6), 3110-3115
CrossRef - Lu, J,;Vecchi, G,A,;Reichler, T. Geophysical Research Letters.2007, 34, L06805,
- Mourya, V,K,; Inamdar, N,N,; Tiwari, A. Advanced materials letters. 2010, 1(1),11-33.
- Oytron MonteiroJr, A,C,; Claudio Airoldi. International journal of Biological Macromolecules. 1999, 26 (2-3), 119-128.
- Choong, J,;Wolfgang, H,H. Water Research. 2003, 37(19), 4770-4780.
- Wang, S,; Xu, X,; Yang, J,; Gao, J. Fuel Processing Technology. 2011, 92(3), 486-492.
CrossRef - Suguna, M,; Kumar, N,S,; Reddy, A,S,; Boddu, V,M,; Krishnaiah, A. Canadian Journal of Chemical Engineering. 2011, 89(4), 833-843.
CrossRef - Moganavally, P,; Suresh, R,; Deepa, M,; Sudha, P,N. Journal of Chemical and Pharmaceutical Research. 2015, 7(5), 1013-1022.
- Guinesi, L,S,; Cavalheiro, E,T,G. Thermochim. Acta. 2006, 444, 128–133.
CrossRef - Chen, X,G,; Park, H,J. Carbohydrate Polymers. 2003, 53(4), 355-359.
CrossRef - Jonathan Knaul, Z,; Samuel Hudson, M,; Katherine Creber, A,M. Journal of Polymer Science Part B: Polymer Physics. 1999, 37(11),1079-1094.
- Von Rao CNR, Chemical Application of Infrared Spectroscopy. New York, London: Academic Press, 1963.
- Riham Mohamed, R,; Fekry, A,M.. International Journal of Electrochemical Science.2011, 6, 2488-2508.
- Monteiro, A,C,; Airoldi, C. International Journal of Biological Macromolecules. 1999, 26 (2-3), 119 -128.
CrossRef - Nomanbhay, S,F,; Palanisamy, K. Electronic Journal of Biotechnology. 2005, 8 (1): 44-53.
- Onsoyen, E,; Skaugrad, O. Journal Chemical Technology and Biotechnology. 1990, 49, 395-404.
CrossRef - Sheeba Thavamani, S,; Rajkumar, R. Research Journal of Chemical Sciences. 2013, 3(8), 44-48.
- Chiou, M,S,; Li, H,Y. Chemosphere. 2003, 50(8), 1095-1105.
CrossRef - Ofomoja, A,E,; Ho, Y,S. Dyes and Pigments.2007, 74(1), 60-66.
- Ho, Y,S,; Hung, C,T,; Huang, H,W. Process Biochemistry. 2002, 37(12), 1421-1430.
CrossRef - Chao, A,C,; Shyu, S,S,; Lin, Y,C,; Mi, F,L. Bioresource Technology.2004, 91(2), 157-62.
CrossRef - Jonathan Febrianto,; Aline Natasia Kosasih,; Jaka Sunarso,; Yi-Hsu Ju,; Nani Indraswati,; Suryadi Ismadji. Journal of Hazardous Materials. 2009, 162(2-3), 616- 645.
CrossRef - Atkins, P. Physical chemistry 6th Edition, Oxford University Press, 1999, 857 – 864.
- Hanif, A,; Bhatti, H,N,; Hanif, M,A. Ecological Engineering. 2009, 35(10), 1427-1434.
CrossRef

This work is licensed under a Creative Commons Attribution 4.0 International License.
About The Author
![]()
A New Edition of Web of Science
Journal Impact Factor
2022: 0.5
Five Year: 0.8
Journal is Indexed in

Cabells Whitelist
![]()


