Thermodynamic modelling carbothermal reduction of silicon, iron, calcium and nonferrous metals from a zinc-containing oxide ore of the Shaimerden deposit
Viktor Mikhaylovich Shevko, Galimzhan Mendikaraevich Serzhanov, Gulnara Ergeshovna Karataeva, Raisa Akylbekovna Uteeva and Mustafa Azatovich Tuleev
South Kazakhstan State University named after M. Auezov Kazakhstan,160012, Shymkent, Tauke Khan avenue, 5
DOI : http://dx.doi.org/10.13005/ojc/31.Special-Issue1.02
Article Received on :
Article Accepted on :
Article Published : 06 Nov 2015
A certain part of the zinc ores containing 10-25 % of Zn is processed by various pyrometallurgical methods (the Sterling process, the Imperial Smelting process, the Waelz process), which allow to extract only zinc and do not ensure complex use of raw materials. This article contains the research results of the complex pyrometallurgical processing an oxide zinc-containing ore of the Shaimerden deposit (17-29 % of Zn) with obtaining a ferroalloy and calcium carbide and extraction of non-ferrous metals in a gas phase (a ZFK process). The results were received by a method of the full thermodynamic analysis using the program HSC-5.1 of the Finnish metallurgical company Outokumpu, which was developed on a principle of the Gibbs energy minimization. We have studied the influence of temperature and amount of carbon on the distribution degree of silicon, iron, calcium, zinc, lead and cadmium in a system “ore-carbon-iron”. It is found, that from 60 to 64.4 % of calcium from the ore passes in CaC2 at 1965-2050°С and 38-42 % of carbon from the ore mass. Silicon is basically extracted in FeSi. 90-94.3 % of silicon (as Fe and Ca silicides, Si and SiC) are taken in a ferroalloy at 2100°С and 25-38 % of carbon. In the process, silicon content in the ferroalloy (41-47 %) corresponds to ferrosilicon of a grade of FS45. It is determined, that cadmium passes in a gas phase at lower temperatures than zinc. All zinc and cadmium pass in a gas at Т ≥ 1415-1525°C. For the full transition of lead in a gas phase it is necessary to use a higher temperature (2100-2200°С).
KEYWORDS:zinc ore; thermodynamic modelling; zinc; ferroalloy; calcium carbide
Download this article as:| Copy the following to cite this article: Shevko V. M, Serzhanov G. M, Karataeva G. E, Uteeva R. A, Tuleev M. A. Thermodynamic modelling carbothermal reduction of silicon, iron, calcium and nonferrous metals from a zinc-containing oxide ore of the Shaimerden deposit. Orient J Chem 2015;31(Special Issue1). |
| Copy the following to cite this URL: Shevko V. M, Serzhanov G. M, Karataeva G. E, Uteeva R. A, Tuleev M. A. Thermodynamic modelling carbothermal reduction of silicon, iron, calcium and nonferrous metals from a zinc-containing oxide ore of the Shaimerden deposit. Orient J Chem 2015;31(Special Issue1). Available from: http://www.orientjchem.org/?p=12310 |
Introduction
In world practice sulphide ores (Romanteyev, Fedorov, & Bystrov, 2006) are a basic source for zinc manufacture. In oxidized zones of zinc-containing ore deposits zinc is found as zincite ZnO, smithsonite ZnCO3, calamine 2ZnO·SiO2·H2O. Zinc content in these ores makes 10-25 % (Romanteyev, Fedorov, & Bystrov, 2006; Heinrich, 1922; Zaitsev, & Margulis, 1985; Utkin, 2004; Abdeyev, Kolesnikov, & Ushakov, 1985). The given oxide ores are processed by pyrometallurgical methods (the Waelz process, electrothermics, the Sterling process and the Imperial Smelting process (IS)) on 5 continents (on 12-14 factories). Now about 20 % of zinc (2-2.5 million tonne a year) is produced by these ways (Romanteyev, Fedorov, & Bystrov, 2006; Abdeyev, Kolesnikov, & Ushakov, 1985; Lakernik, 1971; Snurnikov, 1986). However they have essential disadvantages. The Waelz process is characterized by high consumption of coke (45-55 % from an ore mass), high duration (2-2.5 hours) and formation of large-tonnage waste – clinker (85-88 % from the ore mass) with which about 25 % of carbon are lost. At electrosmelting oxide materials (the Sterling process) 90-99 % of Zn, Pb and Cd are taken in a gas phase. It is a more intensive process in comparison with the Waelz process. However in this case silicon, 30 % of iron and some amount of zinc remain in dump slag. Processing oxide zinc-containing ores by the IS method allows to take 91-95 % of zinc in crude metal. Despite high efficiency this process demands high quality agglomerate. However even in this case a quality of the zinc produced is low. Besides the smelting raw material by the IS method is characterized by a considerable output of slag (70 % from weight of zinc) with which all iron, silicon and calcium are lost. Thus such the processes as the Waelz process and the IS process are characterized by low degree of complex use of raw materials. A purpose of the given work is a thermodynamic substantiation of a new complex way of processing oxide zinc-containing raw material with the simultaneous obtaining element gaseous zinc, a ferroalloy and calcium carbide in one a unit (a ZFK process in respect to the Shaimerden oxide zinc-containing ore (Shevko, Bishimbaev, Serzhanov, Kolesnikov, & Tuleev, 2012)).
Method
Thermodynamic modelling has been fulfilled on a basis of an oxide carbonate ore of the Shaimerden deposit (Kostanai area, Kazakhstan) opened in 1989 (Palenova, Belogub, & Kotliarov, 2010). Zinc stocks on the deposit make ≈ 1 million tonnes. Zinc content in the ore makes 17-29 % of Zn (Palenova, Belogub, & Kotliarov, 2010; State of Kazakhstan mineral raw material base (2015, September 17); World goods markets (2015, September 17)). In the ore zinc is found as calamine, smithsonite and moresnetite. Composition of the ore after calcination at 900°С, % mass: 18.7 % of ZnO; 25.4 % of Zn2SiO3; 15.5 % of CaO; 9.9 % of Al2O3; 1 % of Pb; 0.1 % of CdO; 4.8 % of Fe2O3; 24.6 % of SiO2.
The thermodynamic research was carried out using the program HSC-5.1 of the Finnish metallurgical company Outokumpu, which has been developed on a principle of the Gibbs energy minimization (Roine, 2002; Udalov, 2012; Pupyshov, 2007). The program database contains the information about 17 000 substances. The program HSC Chemistry used in the given work is based on ideology of the European consortium SGTE (Scientific Group Thermodata Europe), which occupies with the development, support and distribution of high-quality databases. The SGTE structure includes specialized scientific centers in Germany, Canada, France, Sweden, the Great Britain and the USA. In the given research we have used the subprogram “Eguilibrium Compositions” for the calculation of equilibrium on the basis of a principle of the Gibbs energy minimization using the formula:
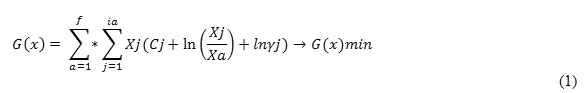
with restrictions as a system of linear equations of a substance’s mass equilibrium:
and normalizing condition:
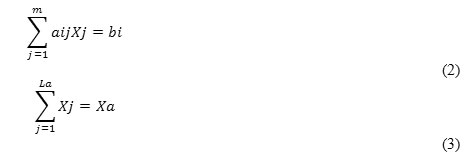
where f – a general number of phases in a system;
Bi– a general number of an independent component in a system;
ja- mass of the numbers, which show a number of j independent components in a phase a of a system;
η–a number of independent components in a system;
Cj– an empirical thermodynamic function;
Xa– a general number of moles of a phase a in a system;
xj/Xa– mole fraction of a dependent component in a phase a;
Yy– activity coefficient of a component.
Equilibrium coefficients of a thermodynamic system are determined at the solving a mathematical problem connected with determination of an extremum taking into account all the restrictions with use of the Lagrangian functions and the Newton method of successive approximations.
At the work with the HSC-5.1 program the initial information was represented as quantitative (kg) distribution of substances in the investigated system. Then equilibrium distribution degree of an element (αi el, %) in reaction products was determined.
For calculation of equilibrium distribution of elements in investigated systems we have used the following formula:
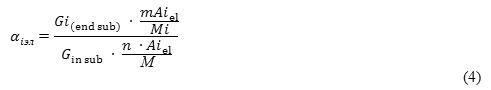
where Gin sub – mass of an initial substance, kg;
Gi(end sub) – mass of an end substance, which contains i element, kg;
М – molecular weight of the initial substance, which contains i element;
Aiel – atomic weight of i element;
n – a number of atoms of i element in the initial substance;
m – a number of atoms of i element in the end substance.
For the search of optimum conditions for transition of Ca into CaC2, silicon and iron – into a ferroalloy, zinc – in a gaseous state we have used a research method based on rototable plans of the second order (Ahnazarova, & Kafarov, 1978) with the subsequent derivation of an adequate regression equation (Inkov, 2006) and the construction of a geometric portrayal of optimization parameters (Ochkov, 2007) (significance of the equation’s coefficients has been determined in accordance with the Student’s test, and adequacy of the equation – in accordance with the Fisher’s test) (Batuner, & Pozin, 1981).
The research of equilibrium distribution of silicon, calcium, zinc, iron, cadmium and lead in a system of the Shaimerden ore (ShO) – carbon – iron has been performed at pressure of 1 bar. The iron amount was constant (19 % from weight of the ore). Optimization parameters have been chosen: extraction degree of silicon in a ferroalloy; extraction degree of zinc, lead, cadmium in a gas, calcium – in calcium carbide, iron – in iron silicides. Temperature (Т, °С) and amount of carbon (C, % from the ShO mass) were independent factors.
Results
The primary material obtained by means of the HSC-5.1 program testifies that in a system ShO – nC – Fe (depending on temperature and amount of carbon) the basic substances are SiO2, CaSiO3, FeSi, Fe3Si, CaSi, Si, Fe, SiC, SiO, Al2SiO5, CO, Fe5Si3, Zn, Pb, Cd, CaO, Ca, CaC2, ZnO, C.
Studying the influence of independent factors on extraction degree of calcium into CaC2 ( Сa(CaC2)) has been fulfilled according to a matrix (table 1).
Table 1: Matrix of planning the research of temperature and carbon amount influence on ( Сa(CaC2)
|
# |
Variable |
Ca(CaC2)initial, % |
Ca(CaC2)cal, % |
|||
|
Coded kind |
Natural kind |
|||||
|
Х1 |
Х2 |
C, % |
T, °C |
|||
|
1 |
+ |
+ |
40 |
2071 |
54.6 |
54.7 |
|
2 |
– |
+ |
26 |
2071 |
27.3 |
28.6 |
|
3 |
+ |
– |
40 |
1929 |
52.5 |
18.6 |
|
4 |
– |
– |
26 |
1929 |
19.1 |
50.6 |
|
5 |
+1.41 |
0 |
42 |
2000 |
60.3 |
18.6 |
|
6 |
-1.41 |
0 |
28 |
2000 |
21.1 |
61.5 |
|
7 |
0 |
+1.41 |
35 |
2100 |
41.6 |
20.5 |
|
8 |
0 |
-1.41 |
35 |
1900 |
28.7 |
40.3 |
|
9 |
0 |
0 |
35 |
2000 |
51.2 |
30.2 |
|
10 |
0 |
0 |
35 |
2000 |
52.2 |
51.2 |
|
11 |
0 |
0 |
35 |
2000 |
50.0 |
51.2 |
|
12 |
0 |
0 |
35 |
2000 |
50.9 |
51.2 |
|
13 |
0 |
0 |
35 |
2000 |
51.6 |
51.2 |
An adequate regression equation Ca(CaC2) = f(C,T) has been found using the data from the table 1:
Ca(CaC2) = -6995.78 + 25.48·C + 6.5·Т – 0.203·C2 – 1.57·10-3·Т2 – 4.16·10-3·C·Т (5)
On the basis of the equation 1 using the program Mathcad (Roine, 2002) we have obtained volume and plane images of the dependence Ca(CaC2) = f (C, T) – figure 1, which testifies that Ca(CaC2) from 60 to 64.4 % can be reach in a technological area ofz, i.e. at 1965-2050°С and 38-42 % of carbon from weight of the Shaimerden ore. The observable maximum of C – CaC2 transition at 2025°С is an effect of the calcium carbide decomposition at high temperatures in accordance with the chemical reaction (Ershov, Dantsis, & Reutovich, 1974; Ershov, 1984):
CaC2 = Ca + 2C (6)
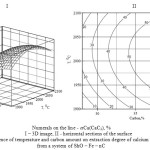 |
Figure 1: Influence of temperature and carbon amount on extraction degree of calcium into calcium carbide from a system of ShO – Fe – nC |
The figure 2 shows the influence of temperature and carbon amount on distribution degree of silicon ( Si) in a system ShO – Fe – nC. It follows from the figure that the formation of FeSi occurs at 1300°С; Si – 1400°С; Fe3Si – 1300°С; SiC – 1400°С; CaSi – 1700°С; SiO – 1600°С. CaSiO3 in the system disappears at 2000-2100°С. Silicon basically passes into FeSi.
The figure 3 contains the information connected with the silicon distribution in basic siliceous compounds. It follows from this figure that at the increase of carbon amount ɑSi in FeSi, Fe3Si, SiO decreases, and in Si, SiC – increases. A dependence of ɑSi – CaSi on the carbon amount has more complex character. The maximum of ɑSi into FeSi (63.37 %) is observed at 2100°С and 22 % of carbon. For the maximum ɑSi into FeSi at 2100°С the following equation ɑSi(FeSi) ˃ f (C) was obtained:
ɑSi(FeSi) = 65.06 + 0.1311C – 0.0091C2 (7)
The maximum transition of silicon from the ore into elemental silicon (30.95 %) is observed at 2200°С and 38 % of carbon. At this temperature the maximum transition of silicon in elemental silicon (depending on amount of carbon) is described by the equation:
ɑSi(Si) = – 48.144 + 4.3353C – 0.0596C2 (8)
Distribution degree of silicon into Fe3Si does not exceed 4 % (3.14 % at 1500°С and 22 % of carbon). Temperature influence on ɑSi into SiC has an extreme character with a maximum (12.47 %) at 2000°С and 38 % of carbon. A dependence of ɑSi(SiC) = f (C) is described by the equation:
ɑSi(SiС) = -75.366 + 4.3857C – 0.0546C2 (9)
The maximum of transition Si→SiO(gas) at 2200°С (depending on quantity of carbon) is described by the equation:
ɑSi(SiO) = 74.38 – 3.9618C + 0.0557C2 (10)
At 2100°С the total silicon transition degree in an alloy as iron silicides, calcium silicide SiC and Si (ɑƩSi) at increase in the carbon content from 20 to 38 % increases from 78.93 to 95.6 % (table 2, figure 4) according to the equation:
ɑƩSi = 0.1966 + 5.5968C – 0.083C2 (11)
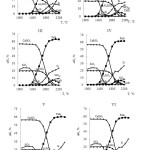 |
Figure 2: Influence of temperature and carbon amount on the transition degree of silicon (ɑSi) into silicon-containing substances |
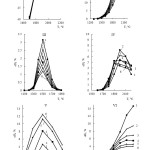 |
Figure 3: Influence of temperature and carbon amount on the transition degree of silicon (αSi) into iron and calcium silicides and SiO(gas) |
Table 2: Influence of temperature and carbon amount on the transition degree of silicon into a ferroalloy (%)
|
Carbon, % |
Temperature, °С |
||||
|
1800 |
1900 |
2000 |
2100 |
2200 |
|
|
20 |
60.57 |
74.22 |
80.76 |
78.93 |
74.71 |
|
22 |
62.87 |
77.75 |
85.26 |
85.46 |
84.54 |
|
25 |
65.23 |
81.03 |
88.97 |
90.16 |
90.06 |
|
28 |
67.18 |
83.49 |
90.68 |
92.44 |
92.65 |
|
31 |
68.93 |
85.60 |
91.98 |
93.91 |
94.11 |
|
35 |
70.71 |
87.81 |
93.49 |
95.09 |
95.15 |
|
38 |
71.75 |
89.33 |
94.58 |
95.60 |
95.91 |
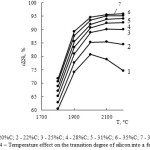 |
Figure 4: Temperature effect on the transition degree of silicon into a ferroalloy |
Table 3 and figure 5 contain the data about silicon content in the ferroalloy.
Table 3 : Influence of temperature and carbon amount on the Si transition degree into a ferroalloy,%
|
Temperature, °С |
Carbon, % |
|||
|
28 |
31 |
35 |
38 |
|
|
1600 |
33.44 |
34.03 |
34.67 |
35.07 |
|
1650 |
34.71 |
35.24 |
35.85 |
36.24 |
|
1700 |
35.97 |
36.45 |
37.02 |
37.41 |
|
1750 |
37.05 |
37.57 |
38.22 |
38.67 |
|
1800 |
38.12 |
38.68 |
39.42 |
39.92 |
|
1850 |
39.00 |
39.64 |
40.51 |
41.08 |
|
1900 |
39.88 |
40.6 |
41.59 |
42.24 |
|
1950 |
40.25 |
41.02 |
42.02 |
42.67 |
|
2000 |
40.61 |
41.44 |
42.44 |
43.09 |
|
2050 |
40.88 |
41.70 |
42.72 |
43.40 |
|
2100 |
41.14 |
41.96 |
43 |
43.7 |
|
2150 |
41.54 |
42.38 |
43.38 |
44.07 |
|
2200 |
41.94 |
42.79 |
43.76 |
44.43 |
As follows from the submitted data, the ferroalloy produced contains from 33.4 to 44.4 % of silicon. Higher temperature and carbon content increase silicon concentration in the alloy. The ferroalloy in which silicon content (41-47 %) corresponds to the ferrosilicon of the grade of FS45 (State Standard 1415-93, 1993; Lyakishev, Gasik, 2005) can be produced at 1780-2200°С and 28-38 % of С in a technological area adcp (Figure 5).
Table 4 and figure 6 contain the information concerning the change of the total transition degree of iron into iron silicides ɑƩFe(sil). As follows from the given information the increase of carbon content reduces ɑƩFe(sil). The dependence ɑƩFe(sil) = f(T) has the extremal character. The maximum of ɑƩFe is observed at 2100°С and 28 % of carbon.
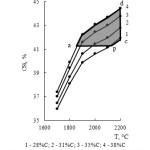 |
Figure 5: Temperature effect on Si content in a ferroalloy |
Table 4: Influence of temperature and carbon amount on the total iron transition degree into silicides from the Shaimerden ore
|
Temperature, °С |
Carbon, % |
|||
|
28 |
31 |
35 |
38 |
|
|
1400 |
10.08 |
9.48 |
8.96 |
8.61 |
|
1500 |
26.93 |
26.12 |
25.43 |
24.81 |
|
1600 |
37.26 |
36.74 |
36.24 |
35.99 |
|
1700 |
52.07 |
51.82 |
51.68 |
51.41 |
|
1800 |
66.57 |
66.3 |
65.66 |
65.1 |
|
1900 |
73.9 |
72.61 |
70.51 |
69.2 |
|
2000 |
75.55 |
73.9 |
71.76 |
70.36 |
|
2100 |
76.21 |
74.53 |
72.19 |
70.51 |
|
2200 |
75.89 |
73.98 |
71.61 |
70.01 |
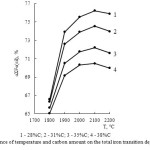 |
Figure 6: Influence of temperature and carbon amount on the total iron transition degree into silicides |
Influence of temperature and carbon amount on the extraction degree of zinc, cadmium and lead from the Shaimerden ore in a gaseous state is represented in the figure 7.
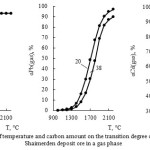 |
Figure 7: Influence of temperature and carbon amount on the transition degree of nonferrous metals from the Shaimerden deposit ore in a gas phase |
As follows from the submitted data, the increase of carbon amount leads to the decrease of zinc and cadmium transition degree in a gas phase. At 1000°С Cd(gas) ˃ Zn(gas) ˃ Pb(gas). The value of Zn(gas) approaches 95 % at 1400-1600°С (20-40 % of С); Cd(gas) – at 1300-1360°С (28-38 % of С) and Pb(gas) – at a temperature ˃ 2100°С. Thereby the lead has the least transition degree in a gas.
The research matrix of temperature and carbon content influence on Zn(gas) is shown in the table 4. On the basis of the data represented in the table 5 the following adequate regress equation was established:
Zn(gas) = -228.09 – 2.66·C + 0.45·Т + 2.43·10-3·C2 – 1.54·10-4·Т2 + 1.48·10-3·C·Т (12)
The geometric portrayal of temperature and carbon content effect on Zn(gas) (figure 8) was obtained on the basis of this equation.
Table 5: Effect of temperature and carbon content on Zn(gas)
|
# |
Variable |
ɑZn(gas)init, % |
ɑZn(gas)cal, % (in accordance to the equation 12) |
|||
|
Coded kind |
Natural kind |
|||||
|
Х1 |
Х2 |
C, % |
T, °C |
|||
|
1 |
+ |
+ |
37.1 |
1683.6 |
96.4 |
99.8 |
|
2 |
– |
+ |
37.1 |
1116.3 |
59.0 |
55.2 |
|
3 |
+ |
– |
22.9 |
1683.6 |
98.8 |
100.0 |
|
4 |
– |
– |
22.9 |
1166.3 |
73.3 |
67.6 |
|
5 |
+1.41 |
0 |
40 |
1400 |
89.1 |
88.8 |
|
6 |
-1.41 |
0 |
20 |
1400 |
95.3 |
97.8 |
|
7 |
0 |
+1.41 |
30 |
1800 |
99.5 |
95.5 |
|
8 |
0 |
-1.41 |
30 |
1000 |
34.6 |
40.8 |
|
9 |
0 |
0 |
30 |
1400 |
91.5 |
93.1 |
|
10 |
0 |
0 |
30 |
1400 |
93.5 |
93.1 |
|
11 |
0 |
0 |
30 |
1400 |
92.9 |
93.1 |
|
12 |
0 |
0 |
30 |
1400 |
94.5 |
93.1 |
|
13 |
0 |
0 |
30 |
1400 |
93.0 |
93.1 |
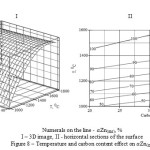 |
Figure 8: Temperature and carbon content effect on Zn(gas) |
As follows from the figure 8 (II) the full transition of zinc into a gas can be achieved at Т ≥ 1415-1525°С and 15-35 % of carbon.
Conclusions
As the result of thermodynamic modelling the joint carbothermic reduction of metals from the ore of the Shaimerden deposit it was found that:
- increase of temperature and carbon amount promote calcium carbide formation: 60-64 % of calcium is extracted into CaC2 at 1965-2050°С and 38-42 % of carbon from the ore mass;
- silicon in the system forms FeSi, Fe3Si, CaSi, SiO(gas), Si and SiC; increase of carbon amount in the system leads to acceleration of SiC and Si formation and does not promote formation of FeSi, Fe3Si, SiO; high transition degree of silicon into the ferroalloy (89-94.3 %) is observed at 2100°С; the ferroalloy produced according to silicon content corresponds to ferrosilicon of the grade of FS45;
- cadmium and zinc from the ore pass completely in a gas state at 1300-1360 and 1400-1600°С accordingly; the lead reduced passes in a gas state at temperature ˃ 2100°С.
References
- Abdeyev, M.A., Kolesnikov, A.V., & Ushakov, N.N. (1985). Rolling zinc-lead-containing materials. Moscow, М: Metallurgy.
- Ahnazarova, S.A., & Kafarov, B.V. (1978). Methods of experiment optimization in chemical industry. Moscow, М: Higher school.
- Batuner, L.M., & Pozin, M.E. (1981). Mathematical methods in chemical technics. Leningrad, L: Chemistry.
- Ershov, V.A. (1984). Electrothermal processes of chemical technology. Leningrad, L: Chemistry.
- Ershov, V.A., Dantsis, Ya.B., & Reutovich, L.N. (1974). Calcium carbide manufacture. Leningrad, L: Chemistry.
- Heinrich, O. H. (1922). Metallurgy of Zinc and Cadmium. New York.
- Inkov, A.M. (2006). Optimization techniques. – Shymkent: SKSU.
- Lakernik, M.M. (1971). Electrothermics in metallurgy of copper, lead and zinc. Мoscow, М: Metallurgy.
- Lyakishev, N.P., & Gasik, M.I. (2005). Physicochemistry and technology of electroferroalloys. Moscow, М: Eliz.
- Ochkov, V.F. (2007). Mathcad 14 for students, engineers and designers. Saint Petersburg, S.-Pb.: BHV-Peterburg.
- Palenova, E.E., Belogub, E.V., & Kotliarov, V.A. (2010). Mineralogy oxidized ores Shaimerden. ХI Congress of the Russian mineralogical society and Fedorov’s session. St.-Petersburg.
- Pupyshov, A.A. (2007). Thermodynamic modelling of thermodynamic processes in spectral sources. Ekaterinburg, Е: UTTU-UPI.
- Roine, A. (2002). Outokumpu HSС Chemistry for Windows. Chemical Reaction and Eguilibrium loft ware with Extensive Thermochemical Database. Pori: Outokumpu Research OY.
- Romanteyev, Yu.P., Fedorov, A.I., & Bystrov, S.V. (2006). Zinc and cadmium metallurgy. Moscow, М: Moscow Institute of Steel and Alloys.
- Shevko, V.M., Bishimbaev, V.K., Serzhanov, G.M., Kolesnikov, A.S., & Tuleev, M.A. (2012). Way of processing an oxide zinc-containing ore. Innovative patent # 26393
- Snurnikov, A.P. (1986). Thermodynamic use of mineral resources of nonferrous metallurgy. Moscow, М: Metallurgy.
- State of Kazakhstan mineral raw material base. (2015, September 17). In Kazakhstan mining portal. Retrieved September 17, 2015, from http://www.tetralab.ru/pages/viewpage.action?pageId=46465030
- State Standard 1415-93 (1993). International standard. Ferrosilicon.
- Udalov, Yu.P. (2012). Application of software packages of computing and geometrical thermodynamics in designing technological processes of inorganic substances. Saint Petersburg, S.-Pb.: St.-Petersburg State Technological Institute.
- Utkin, N.I. (2004). Manufacture of nonferrous metals. Moscow, М: Intermet engineering.
- Zaitsev, V.Ia., & Margulis, E.V. (1985). Metallurgy of lead and zinc. Moscow, М: Metallurgy.

This work is licensed under a Creative Commons Attribution 4.0 International License.
![]()
A New Edition of Web of Science
Journal Impact Factor
2022: 0.5
Five Year: 0.8
Journal is Indexed in

Cabells Whitelist
![]()


