The Electrochemical Assay of Acetaminophen in Paracetamol Tablet with The Help of Differential Pulse Voltammetry
1Department of Chemistry, JMIETI, Yamuna Nagar, Haryana
2R and D Wing, Tulas Group of Institutions, Dehradun, U.K.
3Department of Chemistry, St Johns College, Agra, U.P.
4USIC, Dayalbagh Educational Institute, Dayalbagh, Agra, U.P.
Corresponding Author Email : shashank.enviro@gmail.com
DOI : http://dx.doi.org/10.13005/ojc/31.Special-Issue1.24
Download this article as:
![]()
A sensitive electroanalytical method for determination of acetaminophen (ACT) in paracetamol tablet has been developed and validated. Cyclic voltammetry (CV) was used to study the electrochemical behaviour of paracetamol, while differential pulse voltammetry (DPV) was used to determine ACT. Screen printed carbon electrode was used for the analysis. Determination of all parameters in paracetamol tablet was performed in phosphate buffer (PBS) from pH 4.0 to 9.0. The effects of various factors, such as the scan rates, pH were discussed. For assay of ACT, method validation steps such as linearity, precision, accuracy, limit of detection, limit of quantification were performed.
KEYWORDS:Cyclic voltammetry; paracetamol; phosphate buffer
Introduction
Paracetamol (acetaminophen, N-acetyl-p-amino-phenol) is a safe and effective analgesic and antipyretic agent although its anti-inflammatory effect is weak. In case of an overdose, it may cause severe hepatic necrosis. Paracetamol is rapidly absorbed from the gastrointestinal tract but it is incompletely available due to first pass effect. Extensive metabolism occurs, predominantly in the liver, the major metabolites being the sulphate and the glucuronide conjugates.
Paracetamol are available in tablet, capsule, liquid suspension, suppository, intravenous and intramuscular form. The common adult dose is 500 mg to 1000 mg. It is safe for children and infants as well as for adult. It is major ingredient in numerous cold and influenza medications. Acetaminophen is also effective and safe analgesic agent and is consequently used worldwide for the relief of mild to moderate pain associated with for example, headache, toothache, backache, arthritis, migraine, neuralgia, muscular aches, menstrual cramps, and postoperative pain. Paracetamol act by reducing production of prostaglandins which are involved in the pain and fever processes by inhibiting the cycloxygenase enzymes which are pain activator.
Many assays have been described for acetaminophen including titrimetry [1], chromatography [2-4], fluorometry [5], colorimetry [6-9], UV spectrophotometry [10], and various modes of electrochemistry [11-19].However some of these methods are time consuming and since acetaminophen is electroactive and can be oxidized under suitable conditions the use of electrochemical detection can be considered appropriate due rapid and high sensitivity capabilities.
The aims of this study were to develop and validate electrochemical method for quantitative assay of paracetamol (acetaminophen) content in crocin drug.
Experimental
Reagents and Solutions
Acetaminophen (paracetamol) was purchased from Sigma ALDRICH . The other chemicals and solvents used in this experiment were of analytical grade which was purchased from Merck. Acetaminophen standard solution (1000 µg/ ml) was prepared freshly, by dissolving 0.10 g of acetaminophen in 100.00 ml of warm water. More dilute solutions were prepared by dilution with 0.10 mol/L phosphate buffer solution (PBS) pH 7.4, as required. The solutions were stored in the refrigerator. Phosphate buffer solution pH 7.4 was prepared by adding 11.2 ml of 0.10 mol / L KH2PO4 into 38.8 ml of 0.10 mol / L K2HPO4.
Sample Preparation
Ten tablets of paracetamol tablets (crocin) were weighed and powdered. A 0.1 g of powdered tablets was weighed accurately and placed in a 250 ml conical flask. 50 ml of warm water was added into the flask. The sample was swirled to dissolve for 30 minutes and left cool. The sample solution was filtered through a filter paper (Whatman No. 42) into a 100 ml volumetric flask. The filtrate was made upto the volume with deionized water . The assay of ACT was determined by means of the in situ standard addition method.
Apparatus
All electrochemical experiments were done using a PINE WAVENOW potentiostat. A conventional three electrode potentiostatic system is used in order to perform the electrochemical measurements. The three electrodes are integrated in the screen – printed electrode, where working electrode is carbon, Ag/AgCl is reference and Pt is counter electrode.
 |
Figure1: PINE WAVENOW Potentiostat and Screen Printed Carbon Electrode |
Procedure
A 100µg/L of paracetamol drug sample (crocin) solution in 0.10 mol / L phosphate buffer pH 7.4 was pipetted and coated on the surface of three electrode screen printed system. To remove oxygen, the solution was previously purged with nitrogen for 180 seconds. The cyclic voltammograms were recorded by scanning the potential from -0.5 to +1.2 V at various scan rates (pH = 7.4) and at various pH (scan rate 0.1 V/s). Differential pulse voltammograms (DPV) were also obtained by giving a potential range from -0.2 V to +0.7 V at the step potential 0.002 V and scan rate 0.1 V/s with modulation amplitude 0.05V.
A direct calibration curve and the standard addition method were both used to evaluate the content of acetaminophen in drug sample by DPV. For standard addition method, 15.00 ml of unknown drug sample solution in 0.1 mol / L phosphate buffer pH 7.4 was pipetted and coated on the electrode surface. Six voltammograms were obtained after various concentrations 5, 10, 15, 20, 25, and 30 µg/ml.
Validation of the method
Validation of the analytical method was done according to the International Conference on Harmonization guideline (ICH, 1996). The method was validated for limit of detection (LOD), limit of quantification (LOQ), linearity, precision, and accuracy.
Limit of Detection (LOD) and Limit of Quantitation (LOQ)
According to the International Conference on Harmonization of Technical Requirements for the Registration of Pharmaceuticals for Human Use recommendations, the approach based on SD of the response and the slope were used for determining the detection and quantitation limits.
Linearity
Linearity was determined by using acetaminophen standard solution of 30 µg/ ml in PBS 7.4 pH. Six standard solutions (5-30 µg/ml) were prepared (n =3). The calibration graphs were obtained by plotting the peak height versus the concentration of the standard solutions. The peak current magnitude vs concentration dependence was recorded in the analyte’s concentration range. The peak current magnitude was measured as a distance between the baseline and the current maximum.
Precision
The precision was determined by analyzing 10, 20, 30 µg/ml of standard solution of ACT (n=3) on the same day for intraday precision and on three different days for interday precision by propose method. The precision was expressed as relative standard deviation (RSD).
Accuracy
The accuracy of the method was tested by performing recovery studies at three levels of ACT reference standard added to the samples. Three different volumes (0.5, 1.0 and 1.5 Ml) of the standard solution (containing 30 µg/ ml of ACT in PBS) were added to the sample solution (15 µg/ ml) and analyzed by the proposed differential pulse voltammetry method. The recovery and average recovery were calculated. Three determinations were performed for each concentration level.
Results and Discussion
The anodic peak current dependence to ACT concentration was investigated in the range 5 – 30 µg/ ml. The inset of Fig. (2) clearly shows that the plot of peak current is linearly changed with ACT concentration. The regression equation for the linear part of the calibration plot was obtained as : I (µA) = 0.064 C + 0.056, with r2 = 0.992. The LOD and LOQ for ACT were found to be 0.10 µg / ml and 0.29 µg/ml respectively, which a high sensitivity of the method (Table 1).The interday and intraday precisions of ACT are presented in Table 2. The results showed the acceptable precision of the method, with RSD values lower than 2 %. The recovery at three different levels of ACT was 103.10, 97.00 and 98.90% with an average of 100.10 % (Table 3).These values indicate the accuracy of the method.
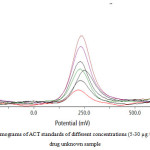 |
Figure 2: DPV Voltammograms of ACT standards of different concentrations (5-30 µg / ml) & paracetamol drug unknown sample Click here to View figure |
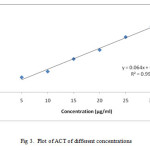 |
Figure 3: Plot of ACT of different concentrations |
Table 1: Method validation parameters for the quantification of ACT by the DPV method.
| Parameters | Results |
|
Linear Range ( µg/ml) |
5.0 – 30.0 |
| Regression Equation | I ( µA) = 0.064 C + 0.054 |
| Correlation Coefficient (r2) | 0.99 |
| LOD ( µg/ml) | 0.1 |
| LOQ ( µg/ml) | 0.29 |
Table 2: Intraday and Interday precision of ACT determination by the DPV method.
|
Concentration |
Intraday Precision |
Interday Precision |
|
(µg/ml) |
(%RSD) |
(%RSD) |
|
10 |
1.89 |
0.79 |
|
20 |
0.71 |
1.63 |
|
30 |
1.51 |
1.72 |
Table 3: Recovery study of ACT by the DPV method.
|
Serial No. |
Amount of sample |
Amount added |
Amount found |
Recovery (%) |
|
(µg/ml) |
ACT (µg/ml) |
(µg/ml) |
|
|
| 1 | 15 | 30 | 45.08±0.08 | 101.95±1.13 |
| 2 | 15 | 60 | 74.26±0.23 | 99.01±1.65 |
| 3 | 15 | 90 | 104.10±1.29 | 99.14±1.48 |
Assay of ACT in crocin 500mg drug was found to be 97% by using the formula:
Assay % = Practical Concentration × 100 / Theoretical Concentration
The effect of potential scan rate on the anodic peak current of paracetamol tablet was investigated. The cyclic voltammograms of screen printed carbon electrode, recorded at various scan rates in PBS (pH 7.4), are shown in Fig. (4). As can be seen, the anodic peak current, Ipa changes proportional to the square root of potential scan rate (Fig 4,5).
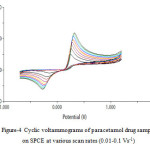 |
Figure 4: Cyclic voltammograms of paracetamol drug sample on SPCE at various scan rates (0.01-0.1 Vs-1) Click here to View figure |
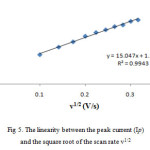 |
Figure 5: The linearity between the peak current (Ip) and the square root of the scan rate v1/2 Click here to View figure |
The linearity between the peak current (Ip) and the square root of the scan rate v1/2 (Fig 5) good and it was characteristic of a diffusion – controlled process.
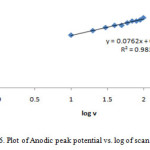 |
Figure 6: Plot of Anodic peak potential vs. log of scan rate Click here to View figure |
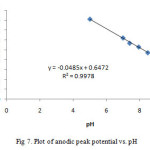 |
Figure 7: Plot of anodic peak potential vs. pH |
By overlaying the cyclic voltammograms in different pH values at SPCE, it was possible to determine that the best pH for analysis was pH 7.4.The results showed sharper oxidation and reduction peaks with increasing pH. As the pH increases, the oxidation peaks shift to lower potentials. The reduction peaks were found to be sharper with reduced peak current with increasing pH. The anodic peaks shift to more negative potential values. Fig (7) shows a linear relationship between pH values and anodic peak potentials (Epa) and that Epa decreased by about 48 mV per pH unit, with an equation of Epa = -0.048pH + 0.647 (r2 = 0.997), indicating that the same numbers of electrons and protons are involved in the oxidation process. The mechanism of acetaminophen oxidation involves the generation of N-acetyl-p-quinoneimine with two electrons and two protons (30, 31, and 32).
Refrences
- Blake, M.I. and Shumaker, L.B. Differentiating Non-aqueous Titration of Mixturess Containig Acetaminopehen and Salicylamide, J. Ass. Off. Analyt. Chem., 1973, 56,653-656.
- Carrol, M.A., White, E.F. and Zarembo, J.E. Over-the-counter Drug Analyses with HPLC, Analyt. Chem., 1981, 53, 1111A-1114A.
- McSharry, W.O. and Savage, I.V.E. Simultaneous High-Pressure Liquid-Chromatographic Determination of Acetaminophen, Guaiphenesin and Dextromethorphan Hydrobromide in Cough Syrup, J.Pharm. Sci., 1980, 69,212-214.
- Wang, J. and Dewald, H.D., Electrochemical Detector for Liquid Chromatography Based on a Reticlated Vitreous Carbon Electrode in a Thin-layer Cell, J. Chromat., 1984, 285, 281-287.
- Oztunc, A. Flurimetric Determination of Acetaminophen as Its Dansyl Derivative, Analyst, 1982, 107, 585-587.
- Afshari, J.T. and Liu, T-Z., Rapid Spectrophotometric Method for the Quantitation of Acetaminophen in Serum, Analyt. Chim. Acta, 2001, 43, 165-169
- Betal,S.F,Elayed,M.A.H, Elwality,A. and Abdine, H., Spectrophotometric Determination of Acetaminophen ,Salicylamide through Nitrosation and Subsequent Chelation, Analyst,1979, 104, 919-927.
- Elsayed,M.A-H.,Betal,S.F.,Elwality,A-f.M. and Abdine, H., spectrophotometric Determination of Acetaminophen, Salicylamide and Codeine Phosphate in Tablets, Analyst, 1979, 104, 620-625.
- Murfin,J.W and Wragg,J.S., A Colorimetric Method for the Determination of Phenacetin and Paracetamol,Analyst,1972, 97,670-675.
- Das,S., Sharma,S.C., Talwar,S.K. and Sethi, P.D., Simultaneous Spectrophotometric Determination of Mefenamic Acid and Paracetamol in Pharmaceutical Preparations, Analyst, 1989, 114, 101-103.
- Bramwell, H., Cass,A.E.G,Gibbsm,P,N.B.and Green,M.J., Method for Determining Paracetamol in whole Blood by Chronoamperometry following Enzymatis Hydrolysis, Analyst,1990, 115, 185-188,550
- Erdogdu, G and Karagozler,A,E. Investigation and Comparison of the Electrochemical Behaviour of some organic and BiologicalMolecules at various Conducting Polymer electrode,Talanta,1997, 44,2011-2018.
- Gilmartin,M.A.T.and Hart,J.P., Rapid Detection of Paracetamol Using a Disposable,Surface-Modified Screen-Printed Carbon Electrode,Analyst,1994, 119, 2431-437.
- Lau,O-W,Luk,S.-F.and Cheung,Y.P.M., Simultaneous Determination of Ascorbic Acid,Caffeine and Paracetamol in Drug Formulations by Differential pulse voltammertry using a Glassy Carbon Electrode, Analyst,1989, 114,1047-1057.
- Miner,D.J.Rice,J.R.,Riggin,R.M.and Kissinger,P.T., Voltammmetry of Acetaminophen and Its Metabolites, Analyst. Chem, 1981, 53, 2258-2263.
- Navarro,I.,Gonzalez-Arjona,Roldan,E.and Rueda,M., Determination of Paracetamol in Blood Plasma by Differential Pulse Voltammetry, J. Pharm. Biomed. Anal., 1988, 6, 969-976.
- Ozkan,S.A.,Uslu,B.and Aboul-Enein, H.Y., Analysis of Pharmaceuticals and Biological Fluids Using Modern Electroanalytical Techniques,Crit.Rev.Analyst.Chem.,2003, 33.155-181.
- Wang,C.,Hu,C,X.,Leng,Z.,Yang,G.and Jin,G., Differential Pulse Voltammetry for Determination og Paracrtamol at a Pumice Mixed Carbon Electrode, Analyst. Lett., 2001, 34, 2747-2759.
- Zen,J.-M.and Ting,Y-S., Simultaneous Determination of Coffeine and Acetaminophen in Drug Formulations by Square-Wave Voltammetry Using a Chemically Modified Electrode, Analyst, Chim. Acta, 1997, 342,175-180.
- Codruta Cofan and Ciprian Radovan., Simultaneous Determination of Acetaminophen and Ascorbic Acid at an Unmodified Boron-Doped Diamond electrode by differential pulse voltammetry in Buffer media Electro Ana 2008, 1346: 1353
- Chengyin Wanga;Xiaoya Hua;Zongzhou Lenga;Gongjun Yanga;Gendi Jina Affiliation., Differential Pulse Voltammetry for determination of Paracetamol at a Pumice Mixed Carbon Paste Electrode Analy Letters 2001, 2747:2760
- Yongnian Nia;Yuerong Wanga; Serge Kokotb Affiliations., Differential pulse voltammetr determination of Paracetamol and Phenobarbital in Pharmeceutical by Chemometrics Analy Letters, 2004.


![]()


