Influence of Ni˚ NP on the induction of oxidative damage in Triticum vulgare
Anastasia Mickhailovna Korotkova1, Elena Anatolievna Sizova2 and Svyatoslav Valeryevich Lebedev1
1Orenburg State University 13, Pobedy Avenue, Orenburg, 460048
2The Laboratory for Agroecology of Technogeneous Nanomaterials The All-Russian Research Institute of Beef Cattle Breeding RAAS,
29, 9-Yanvarya Street, Orenburg, 460018
DOI : http://dx.doi.org/10.13005/ojc/31.Special-Issue1.17
Article Received on :
Article Accepted on :
Article Published : 05 Nov 2015
The influence of spherical nanoparticles (NP) of nickel Ni˚ (70±0.3 nm in diameter) in the concentrations of 0.025, 0.05 and 0.1 M on the root part of 4-day-old seedlings of Triticum vulgarе wheat has been studied. After treating plants with nanoparticles, an increase was observed in the fluorescence of dichlorofluorescein and malondialdehyde (MDA), as well as strong haphazard DNA degradation down to discrete fragments of flowing nucleotides without forming abnormal apoptotic "ladders"; these effects were directly dependent on the dosage. Fluorescence microscopy and assessment of cell viability by the number of dead cells showed an increase in plant cells death after increasing the number of NP in the environment, primarily by the way of necrosis.
KEYWORDS:Triticum vulgare – nanoparticles – reactive oxygen species – nickel – DNA degradation - oxidative stress – vitality
Download this article as:| Copy the following to cite this article: Korotkova A. M, Sizova E. A, Lebedev S. V. Influence of Ni˚ NP on the induction of oxidative damage in Triticum vulgare. Orient J Chem 2015;31(Special Issue1). |
| Copy the following to cite this URL: Korotkova A. M, Sizova E. A, Lebedev S. V. Influence of Ni˚ NP on the induction of oxidative damage in Triticum vulgare. Orient J Chem 2015;31(Special Issue1). Available from: http://www.orientjchem.org/?p=12227 |
Introduction
Despite the multi-level intracellular cells protection from stress, under the action of adverse factors of environment, an increase in the concentration of reactive oxygen species (ROS) and triggering of the cascade mechanism of oxidative stress are observed, which lead to destruction of vital cellular components and cell death [1]. From this point of view, plants are no exception, and are almost constantly exposed to reactive oxygen species (ROS), especially in the presence of nanoforms of metals with variable valence [2].
Most plant species are able to adapt to metals NPs using various mechanisms [3, 4]. However, in general, these mechanisms are not sufficient for preventing increased levels of antioxidant enzymes [5], lipid peroxidation [6] and damage to the photosynthetic pigments [7], decreased mitotic index, increased number of pyknotic micronuclea [8], damaging of DNA molecules [9, 10], cytotoxic effects [11] with changing cells proliferation and differentiation [12].
In connection with the above, the relevance of studying the effects of variable valence metals NPs as inductors of oxidative damage confirms the necessity of detailing the alleged mechanisms of supposed processes in plants in vitro and in vivo.
Materials and Methods
Commercially available spherical nickel NPs Ni˚ purchased from the Advanced Powder Technologies LLC (Russia, Tomsk) obtained by electric explosion of a conductor in the argon atmosphere were used in the research. The material certification (particle size, polydispersity, voluminosity, quantitative content of fractions, surface area) of the preparations included electronic scanning, transillumination and atomic forced microscopy with the use of LEX T OLS4100, JSM 7401F, JEM-2000FX (“JEOL”, Japan). Particles size distribution was studied with the use of nanoparticles analyzer Brookhaven 90Plus/BIMAS and ZetaPALS Photocor Compact (“the Photocor”, Russia) in lyosols obtained by dispersing at ultrasonic disperser UZDN-2T (Russia), under the following conditions: f=35 kHz, N = 300 W, A=10 μA, for 30 min. NPs size was determined with the use of electronic microscope JSM-740 IF. The results of nanoparticles certification showed that nickel NPs had the size of 70±0.3 nm and the Z-potential of 25±0.5 mV.
The method of the performed research was the using of seeds of Triticum vulgare processed with nickel NPs, which had been preliminarily disinfected in 0.01% solution of KMnO4 for 5 min, and, after triple rinsing with distilled water, placing each time 10 pieces on the substrate made of filtering paper into plastic Petri dishes and allowing them to grow in a climatic chamber (“Agilent”, USA) with 12-hour illumination at 22±1 °C for 4 days. In order to avoid drying, all samples were watered with 5 ml of distilled water every other day [7], and in order to avoid changing the redox status of the tested plants, the nutrient solution was not used. Then, each test sample was rinsed with 5 ml of the solutions of 0.1, 0.05 and 0.025 M of nickel NPs (concentration by metal) of distilled water, treated with ultrasound at the frequency of 35 kHz in the source of cell type Sapphire TTC (PCC “Sapphire”, Russia) for 15 min, and left for 4 hours. The group of the control plants was kept in the distilled water. After incubation, the root part of the plants was used for the analysis [13].
The level of lipid peroxidation (LPO) was determined by the degree of accumulating the product of malonic dialdehyde (MDA) reaction with thiobarbituric acid (TBA) [14]. To do so, 100 mg of wheat tissues were mashed in 200 µl of 20% trichloroacetic acid (TCA). The obtained homogenate was centrifuged for 5 min at 12,000 g. 100 μl of supernatant was introduced into sealed rest tubes, 100 µl of 20% TCA was introduced into the control samples, and 0.5% solution of TBA were introduced into the experimental samples. The samples were incubated in a boiling water bath (100 °C) for 30 min, then cooled down at the room temperature, and the optical density was measured at the wavelength of 532 nm, and at 600 nm for correcting the non-specific absorption. The calculation was performed using the following formula:
where C is the amount of MDA, mmol/g of wet weight; D is the optical density of the sample at 532 nm; 155 is the MDA extinction coefficient at 532 nm, mM-1cm-1; X is the dissolution, V is the volume of the extract, ml; m is the mass of wet sample, g; l is the optical path length, cm [14]. The level of LPO was expressed in percent, with 100% being the number of TBA-reacted products contained in the cells of roots treated with plants paraquat.
In order to study the level of intracellular ROS content and the redox state of the cell under the influence of NPs, fluorescent dye 2,7-dichlorotetrafluoroethane diacetate (DCFН-DA) (Sigma, USA) was used, which, after getting into the cell under the action of ROS is oxidized to the fluorescent 2,7-dichlorofluorescein (DCF) [15]. For measuring ROS, the apical part was cut off the wheat shoots after 4-hour exposure to NPs, and incubated in 10 μl of 0.25 μm DCFН-DA in the dark in the atmosphere of 5% CO2 at 37° C for 40 min [13]. Immediately before the microscopic analysis, the cells were rinsed from the excess of fluorochromes with a solution freshly prepared from PBS pellets (“Ambresco”, USA) and a squash slice was prepared. The samples were scanned with the use of fluorescent trinocular microscope “Micromed-3 LUM” (“Micromed”, Russia) equipped with a mercury lamp for the light source. Images of the objects were obtained in real-time with the use of the visualization kit on the Levenhuk C800WG camera. Fluorescence was detected in two channels that correspond to the two peaks of chromophore excitation (410 nm and 490 nm) and the peak of emission 530 nm.
In parallel, DCF fluorescence was measured in cells at λех=485 nm, λem=530 nm on the multi-plate reader “Infinite 200 Pro” (“Tecan”, Austria). To do so, cell suspension was prepared beforehand by meshing 40 mg of apical root part of plants with a Teflon pestle in the Eppendorf type test tubes with 200 μl of chilled prepared PBS solution. Next, the resulting suspension was centrifuged at 13,000 rpm for 10 min, the precipitate was cooled for 10 min on ice (to make protein fractions precipitate), centrifuged again, and 100 µl were sampled into the lunules. Next, 10 μl of the dye solution were added to the samples, and the samples were incubated at +37ºС. Next, the cells were rinsed twice in a PBS solution and the intensity of fluorescence was measured.
Development of the DNA-damaging effect in wheat, namely, the dynamic structural reorganization and topological modifications, was analyzed in the selected genomic DNA from plant roots with the use of a set of reactants “DNA Extran” (“Synthol”, Russia), the content of which was quantified spectrophotometrically via the ratio of absorbing 260/280 nm after diluting 100 μl of the DNA solution to 1 ml. In the calculations, 50 μg/ml was taken as an optical absorption unit for a two-spiral DNA at the wavelength equal to 260 nm and the optical path length of 1 cm. The same amounts of DNA (10 μg/lunule) and DNA marker 10 Kb (M12) (“SibEnzyme”, Russia) were introduced into the gel lunules.
The topological changes in the DNA were analyzed using the method of horizontal electrophoresis in 1 % type I universal agarose (“Helicon”, Russia) in the presence of 0.5 μg/ml of ethidium bromide (“Laboratory building “A”, Russia). The electrophoretic separation was performed in TBE buffer (0.04 M of Tris-HCl, 0.002 M of EDTA, 0,089 M of boric acid, pH 7.2) using power supply “Elf-8” (“Helicon”, Russia) at the voltage of 5 V/cm and the current of 200 mA for 1.5 hours. The result of samples electrophoretic mobility in the gel was assessed in the UV transilluminator (“Vilber Lourmat”, France). The gels were photographed with the Nikon D3200 camera and the obtained digital images were processed with the tools of the universal computer application “ImageJ” (“National Institutes of Health”, USA). The ratio of DNA damaging effect of the NPs was calculated as the ratio of the total number of fragments of more than 1,000 base pairs (form I) to the fragments of less than 1,000 base pairs (form II)..
Viability of the suspension of wheat cultures was determined using the modified method [16]. The method is based on spectrophotometric determination of cell culture viability according to the degree of retention in dead cells of the Evans blue dye, which is unable to penetrate living cells. For performing the analysis test, the prepared (as described above) cell suspension (100 µl) was mixed with 10 μl of 0.025% solution of the Evans blue in a 96-lunule plate, and incubated for 15 min at room temperature. Then the samples were rinsed from the excessive and unbound dye with distilled water and 1 ml of 1% sodium dodecyl sulfate (SDS) solution kept in a water bath at 60 °C for 30 min and centrifuged for 10 min at 9,000 g. Each sample was matched to a control comparison, i.e. a sample consisting of 100% dead cells. For obtaining control comparison, a suspension of wheat cells was kept in the standard oxidizer solution – 10 mM of paraquat, PQ (methylviologen) (“Sigma”, USA) for 1 hour. After that, the optical density was measured at the wavelength of 600±10 nm with an automatic multi-plate reader. The number of dead cells (in %) was calculated from the ratio of optical density of the test samples to the value of the positive control of paraquat, minus the background absorbance of the 1% SDS solution. In parallel, microscopy of the root part of the plants was made after exposure to NPs in the concentration of 0.1 M, colored with the dye, and the percentage of dead cells in the zone of stretching was counted, compared to the paraquat with the use of the light mode of the “Micromed-3 LUM” microscope.
The method is based on simultaneous staining cells with multiple fluorophores – ethidium bromide and acridine orange (AO). The negatively charged ethidium bromide, like PI, penetrates only the cells with damaged membranes, intercalates into the DNA, and fluoresces in the red area, staining necrotic cells most intensely. AO, on the contrary, penetrates through the plasma membranes freely, and, as a result of hydrolysis, fluorescences in the green area, and is pertained in cells with undamaged membranes (living cells) due to its charge, staining live cells less intensely, and the apoptotic cells in bright green [17, 18]. Preparation consisted in staining the root part of wheat plants with a mixture of dyes in the ratio of 1:1, and incubating samples at 4 ˚C for 15 minutes. Next, the samples were rinsed and studied by optical microscopy at the magnification of x100 and x400; and the number of necrotic and apoptotic cells was counted.
The laboratory experiments were performed in 3 biological repetitions; analytical determination for each sample was performed in three repetitions. The reliability of the experimental data was assessed with the use of mathematical statistics methods involving the “Statistica 10.0” software suite.
Results and Discussion
Development of oxidative processes in plants under the influence of the nanoparticles may be manifested by the level of LPO after the influence, by accumulation of MDA, diene conjugates and other TBA-active products. Judging by the level of the LPO, even when small amounts (0.025 and 0.05 M) of NPs Ni˚ were introduced into the growing medium for 4 hours, the amount of MDA increased by 24.4-31.5%, as compared to negative control (water), and by 17.5-25.2%, as compared to the positive (paraquat) control. With that, the MDA content after exposure with 0.1 M NPs Ni˚ was already 0.0017819 mmol/g of wet weight, which is 36.7% and 42% more than the above mentioned controls, respectively (P<0.05) (Figure 1).
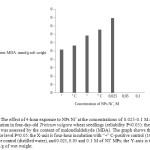 |
Figure 1: The effect of 4-hour exposure to NPs Ni˚ at the concentrations of 0.025-0.1 M at the level of lipid peroxidation in four-day-old Triticum vulgare wheat seedlings (reliability P<0.05): the level of lipid peroxidation was assessed by the content of malondialdehyde (MDA). The graph shows the values with the confidence level P<0.05: the X-axis is four-hour incubation with “+” C-positive control (10 mM of PQ), “-“C-negative control (distilled water), and 0.025, 0.05 and 0.1 M of NI˚ MPs; the Y-axis is the content of MDA, mmol/g of wet weight. Click here to View figure |
Indeed, incubation of Triticum vulgare seedlings for 4 hours with 0.1 M of NPs Ni˚ showed a marked increase in the number of intracellular oxidants (H2O2, HO•, ROO•) due to the transformation of 2,7-dichlorodihydrofluoresceine diacetate (DCFH-DA) during oxidation into its fluorescent derivative, 2,7-dichlorofluoresceine (DCF) [15]. So, after exposure to NPs Ni˚, there was an increase in the ROS content by 57 and 45 %, as compared to processing with distilled water (“+” control) and paraquat PQ (“-” control) in vivo, respectively (P<0.05) (Figure 2).
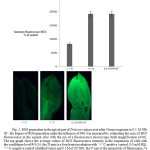 |
Figure 2: ROS generation in the apical part of Triticum vulgare root after 4 hours exposure to 0.1 M NPs Ni˚: the degree of ROS generation under the influence of NPs was measured by estimating the area of DCF fluorescence in the squash slice with the use of a fluorescence microscope (total magnification x100). The top graph shows the average values of DCF fluorescence intensity in the suspension of cells with the confidence level P<0.05: the X-axis is a four hours incubation with “+” C-positive control (10 mM PQ), “-” C–negative control (distilled water) and 0.1 M of Ni˚NPs; the Y-axis is the intensively of fluorescence, % from the “-” control. Click here to View figure
|
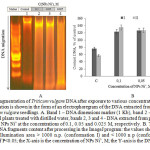 |
Figure 3: Fragmentation of Triticum vulgare DNA after exposure to various concentrations of NPs Ni˚: DNA fragmentation is shown in the form of an electrophoregram of the DNA extracted from 4 day old root parts of Triticum vulgare seedlings. А. Band 1 – DNA dimensions marker (1 Kb), band 2 – DNA extracted from the control plants treated with distilled water, bands 2, 3 and 4 – DNA extracted from plants after 4 hour of treating with NPs Ni˚ at the concentrations of 0.1, 0.05 and 0.025 M, respectively. В. The graph shows the values of DNA fragments content after processing in the ImageJ program: the values show the total DNA conformation illumination area > 1000 n.p. (conformation I) and < 1000 n p (conformation II) with the reliability of P<0.05; the X-axis is the concentration of NPs Ni˚, M; the Y-axis is the DNA content, % of the control. Click here to View figure |
Next, we were interested in the interdependent mechanism of the oxidative stress and cell death. To do so, we first analyzed mobility and topological changes in the DNA extracted from the root part of Triticum vulgare after 4 hour incubation with Ni˚NPs. The DNA electrophoretogram showed that the least migrant in the agarose gel, and the closest to the start was form I, which was the highest value among the control samples. Visualization of the results showed stronger degradation in the experimental samples, as compared to the control DNA, which was recorded in the form of a “smear” (or “track”) of fragments with variable molecular weight (Figure 3).
Next, we were interested in the interdependent mechanism of the oxidative stress and cell death. To do so, we first analyzed mobility and topological changes in the DNA extracted from the root part of Triticum vulgare after 4 hour incubation with Ni˚NPs. The DNA electrophoretogram showed that the least migrant in the agarose gel, and the closest to the start was form I, which was the highest value among the control samples. Visualization of the results showed stronger degradation in the experimental samples, as compared to the control DNA, which was recorded in the form of a “smear” (or “track”) of fragments with variable molecular weight (Figure 3).
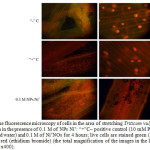 |
Figure 4: The fluorescence microscopy of cells in the area of stretching Triticum vulgare roots after 4-hour incubation in the presence of 0.1 M of NPs Ni˚: “+”C– positive control (10 mM PQ) “-”C– negative control (distilled water) and 0.1 M of Ni˚NOs for 4 hours; live cells are stained green (AO), the nuclei of dead cells – in red (ethidium bromide) (the total magnification of the images in the left row – x100, in the right row – x400). Click here to View figure |
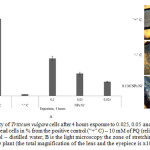 |
Figure 5: Viability of Triticum vulgare cells after 4 hours exposure to 0.025, 0.05 and 0.1 M of Ni˚NPs: A is the number of dead cells in % from the positive control (“+” C) – 10 mM of PQ (reliability P<0.05); “ – ”C– negative control – distilled water; B is the light microscopy the zone of stretching the root parts of the Triticum vulgare plant (the total magnification of the lens and the eyepiece is x100) Click here to View figure |
Summing it up, the increased fluorescence of DCF and LPO indicates general oxidative stress, rather than generation of specific ROS [13, 15]. Electrophoresis of DNA molecules obtained from the root part of analyzed plants in the agarose gel showed strong degradation of the molecules of the test samples in the form of “plume” (or “track”) of fragments with variable molecular weight, however, no bands with abnormal electrophoretic mobility in the form of an apoptotic step-like “ladder” have been found in course of gel visualization, which fact may indicate the absence of restriction in the rosellate chromatin loops with caspases or endonucleases [19]. Note that the change in mobility from the point of view of reducing the total content of fragments of conformation I (over 1000 n.p.) and transition of the main DNA mass to another area – the area of conformation II (less than 1000 n.p.) with random degradation to non-discrete fragments of mobile nucleotides, rather signifies typical necrotic destruction of the cell in the conditions of excessive ROS after exposure to nickel as a metal of variable valence with a large surface area of the particles and reactivity [20-25]. Most significantly this effect is observed when NPs concentration is increased, and the coefficient of DNA damage is calculated. This assumption confirms simultaneous staining of cells with fluorophores – ethidium bromide and AO, where the main quantity of necrotic cells was visualized, as well as a small quantity of apoptotic cells [18]. And, finally, introducing NPs Ni˚ into the medium showed an increase in the number of dead cells, as compared to distilled water, but in general the effect was considerably less negative, unlike the positive control of paraquat.
Conclusion
This study showed that Ni˚ NP, as a metal with variable valence, contribute in a multiplex manner to generating ROS [26], to development of cytogenetic damage in wheat by the way of necrotic death of cells. The primary effect is explained by the increased DCF fluorescence and by the induction of synthesis of TBA-active products that trigger the LPO reaction [6]. Many researchers indicated that the acute activation of secondary effects in metal-containing NPs was manifested by formation of adducts with a DNA molecule [27, 28], oxidative degradation [26] and apoptotic DNA fragmentation [29]. However, our studies did not reveal the destruction of apoptotic DNA [30], but revealed the necrotic destruction of cells and the decrease in cells viability after 4 hours of incubation in a medium with MPs the metal of variable valence, nickel, as discussed in [21].
The work has been performed with financial support under the Grant of the RSF, Agreement No. 14-36-00023 dated 15.09.2014, and State Assignment No. 342 dated 01.02.2014.
References
- Weidinger, A., &Kozlov, A.V. (2015). Biological activities of reactive oxygen and nitrogen species: oxidative stress versus signal transduction. Biomolecules, 5, 472-484.
- Karkone, A., & Kuchitsu, K. (2015). Reactive oxygen species in cell wall metabolism and development in plants. Phytochemistry, 112, 22-32.
- Pokhrel, L.R., & Dubey, B. (2013). Evaluation of development al responses of two crop plants exposed to silver and zinc oxide nanoparticles. Sci. Tot. Environ., 452, 321-332.
- Liu, Y., Tourbin, M., Lachaize, S., & Guiraud, P. (2014). Nanoparticles in waste waters: hazards, fate and remediation. Powder Technol, 255, 149-156.
- Korotkov, A.M., & Lebedev, S.V. (2014). The effect of copper nanoparticles on changing the antioxidant status of Triticum vulgare Vill. Microelements in medicine, veterinary science, nutrition: prospects for cooperation and development: Proceedings of SPC, September 24-26, 2014, Odessa, pp. 130-136.
- Zhao, L., Peng, B., Hernandez-Viezcas, J.A., Rico, C., Sun, Y., Peralta-Videa, J.R. et al. (2012). Stress response and tolerance of Zea mays to CeO2 nanoparticles: cross talk among H2O2, heat shock protein, and lipid peroxidation. ACS Nano., 6,9615-9622.
- Lebedev, S.V., Korotkova, A.M., & Osipova, E.A. (2014). Influence of Fe0 nanoparticles, magnetite Fe3O4 nanoparticles, and iron (II) sulfate (FeSO4) solutions on the content of photosynthetic pigments in Triticum vulgare. Russian Journal of Plant Physiology, 61(4), 564-569.
- Rodriguez, E., Raquel, A., Pedro, F., & Conceicão, S. (2011). Cr(VI) Induces DNA damage, cell cycle arrest and polyploidization: a flow cytometric and comet assay study in Pisum sativum. Chem. Res. Toxicol., 24(7), 1040-1047.
- Manke, A., Wang, L., & Rojanasakul, Y. (2013). Mechanisms of nanroparticle-induced oxidative stress and toxicity. BioMed Research International. Retrieved 10.10.2013 from http://dx.doi.org/10.1155/2013/9429160.
- Donald, A.H.,Huanhua, W., Elijah, J.P., Leveland, D., Holbrook, R.D., Jaruga,P., Dizdaroglu,M., Xing,B., &Nelson,B.C. (2014). Correction to copper oxide nanoparticle mediated DNA damage in terrestrial plant models. Environ. Sci. Technol.,48(20), 12473-12473.
- Atha, D.H., Wang, H., Petersen, E.J. et al. (2012). Copper oxide nanoparticle mediated DNA damage in terrestrial plant models. Environmental Science and Technology, 46(3), 1819-1827.
- Mirzajani, F., Askari, H., Hamzelou, S., Schober, Y., Rоmpp, A., Ghassempour, A., & Spengler, B. (2014). Proteomics study of silver nanoparticles toxicity on Oryza sativa L. Ecotoxicology and Environmental Safety, 108, 335-339.
- Faisal, M., Saquibb, Q., Alatara, A.А., Al-Khedhairyb, A.A., Hegazya, A.K., & Musarratd, J. (2013). Phytotoxic hazards of NiO-nanoparticles in tomato: a study on mechanism of cell death. Journal of Hazardous Materials, 3, 250-251.
- Sibgatullina, G.V., Hayertdinova, L.R., Gumerova, E.A. et al. (2011). Methods of defining redox status of the cultivated plant cells (pp. 61). The Kazan Federal University.
- Held, P. (2015). An introduction to reactive oxygen species measurement of ROS in cells. BioTek Instruments, 4, 1-22.
- Castro-Concha, L.A., Escobedo, R.M., & Miranda-Ham, M.L. (2006). Measurement of cell viability in in vitro cultures. Methods in molecular biology (pp. 71-76). Humana Press Inc.
- Skibo, Y.V., & Abramova, Z.I. (2011). Methods of studying programmed cell death (pp. 61). FSAEI HVE KFU.
- Akatov, V.S., Faleev, R.S., Faleeva, S.I. et al. (2014). Farm-screening of preparations and promising substances in vitro(pp. 67). Pushchino: Fix-Print.
- Koukalova, B., Kovarik, A., Fajkus, J., & Siroky, J. (1997). Chromatin fragmentation associated with apoptotic changes in tobacco cells exposed to cold stress. FEBS Lett., 414, 289-292.
- Tulpan, D., Andronescu, M., & Leger, S. (2010). Free energy estimation of short DNA duplex hybridizations. BMC Bioinformatics, 11, 105-109.
- Huang, Y-W., Wu, Ch., Aronstam,R.S. (2010). Toxicity of transition metal oxide nanoparticles: recent insights from in vitro studies. Materials,3,4842-4859.
- Albanese, A., Tang, P.S., & Chan, W.C. (2012). The effect of nanoparticle size, shape, and surface chemistry on biological systems. Annu. Rev. Biomed. Eng., 14,1-16.
- Kreslavsky, D.V., Los, D.A., Allakhverdiev, S.I., & Kuznetsov, V.V. (2012). Signaling role of active oxygen forms during stress in plants. Physiology of Plants, 59, 163-178.
- Gill, S.S., & Tuteja, N. (2010). Reactive oxygen species and antioxidant machinery in abiotic stress tolerance in crop plants. Physiol. Biochem., 48, 909-930.
- Kumari, M., Ernest, V., Mukherjee, A., & Chandrasekaran, N. (2012). In vivo nanotoxicity assays in plant models. Methods Mol. Biol., 926, 399-410.
- Wan, R., Mo, Y., Feng, L., Chien, S., Tollerud, D.J., & Zhang, Q. (2012). DNA damage caused by metal nanoparticles: involvement of oxidative stress and activation of ATM. Chemical Research in Toxicology, 25,402-1411.
- Kholmurodov, Kh.T., Dushanov, E.B., Krasavin, H.K., ElHabashy, Y.F., Galal, A., Sweilam, N.H., & Yasuoka, K. (2013). Molecular dynamics simulations of the DNA interaction with metallic nanoparticles and TiO2 surfaces (рp. 20). Dubna.
- Ishino, K., Kato, T., Kato, M., Shibata, T., Watanabe, M., Wakabayashi, K., Nakagama, H., &Totsuka, Y. (2015). Comprehensive DNA adduct analysis reveals pulmonary inflammatory response contributes to genotoxic action of magnetite nanoparticles. Int. J. Mol. Sci., 16,3474-3492.
- Meena, R., Rani, M., Pal, R., & Rajamani, P. (2012). Nano-TiO2 induced apoptosis by oxidative stress-mediated DNA damage and activation of p53 in human embryonic kidney cells. Applied Biochemistry and Biotechnology, 167, 791-808.
- Nath, K., Lu, Y. (2015). A Paradigm of Reactive Oxygen Species and Programed Cell Death in Plants. J Cell SciTher., 6, 202. doi:10.4172/2157-7013.1000202.

This work is licensed under a Creative Commons Attribution 4.0 International License.
![]()
A New Edition of Web of Science
Journal Impact Factor
2022: 0.5
Five Year: 0.8
Journal is Indexed in

Cabells Whitelist
![]()


