Extractionof Lead(II) with Functionalization of Nano Graphene oxide with Prior to determination by Flame Atomic Absorption Spectrometry
Mostafa Shojai and Ali Moghimi*
Department of Chemistry, Varamin (Pishva) branch Islamic Azad University, Varamin, Iran Corresponding Author Email:alimoghimi@iauvaramin.ac.ir
DOI : http://dx.doi.org/10.13005/ojc/31.Special-Issue1.10
Article Received on :
Article Accepted on :
Article Published : 06 Nov 2015
A simple, highly sensitive, accurate and selective method for determination of trace amounts of Pb2+in water samples .In this paper, a nano Graphene oxide with covalently linked porphyrin (GO–H2P) based new sorbent was prepared. The modified nano Graphene oxide (GO–H2P) was used for preconcentration of Pb(II) from aqueous solutions. The analytical variables were optimized by central composite design (CCD). Flame atomic absorption spectrometer was utilized for determination of Pb(II). The analytical features for sorption were found to be 5.2; 4.3 mL min-1 and 55.0 mL for pH, flow rate and sample volume, respectively. HNO3 was used as eluent and maximum preconcentration factor was found to be 200.Elution parameters were also determined as 4 mL min-1; 0.6 mol L-1 and 5.1 mL forflow rate, eluent concentration and eluent volume, respectively.Limit of detection and limit of quantification were found to be 49.6 and 163.7 ng L-1, respectively. Validation of the developed method was performed using certified reference material (TMDA-53.3). The methodology was applied for determination of Pb(II) in natural water samples and satisfactory results were obtained.
KEYWORDS:Nano Graphene oxide with covalently linked porphyrin (GO–H2P); preconcentration; Cadmium; Central Composite Design; Flame Atomic Absorption Spectrometer; water
Download this article as:| Copy the following to cite this article: Shojai M, Moghimi A. Extractionof Lead(II) with Functionalization of Nano Graphene oxide with Prior to determination by Flame Atomic Absorption Spectrometry. Orient J Chem 2015;31(Special Issue1). |
| Copy the following to cite this URL: Shojai M, Moghimi A. Extractionof Lead(II) with Functionalization of Nano Graphene oxide with Prior to determination by Flame Atomic Absorption Spectrometry. Orient J Chem 2015;31(Special Issue1). Available from: http://www.orientjchem.org/?p=12270 |
Introduction
nanoGraphenes are attracting renewed interests owing to recent advances in micromechanical exfoliation and epitaxial growth methods that make macroscopic 2D sheets of sp2-carbon atoms available.[1] A variety of simple yet elegant physics relating to its zero-gap semiconductor character has thus been demonstrated.[ 2–5] It would be very desirable to make these materials solution (or more accurately, dispersion) processable by coating or printing, which will open applications for large and/or flexible substrates. Graphite oxide (GO) is a possible candidate for this because it is a precursor to nano Graphene through deoxidation either thermally or by chemical reduction.[6–8] Although GO itself has been studied for over a century,[9] its structure and properties remain elusive, and progress has been made only recently to give materials with limited dispersability and electronic quality.[10–14].
Lead at trace concentrations acts as both a micronutrient and a toxicant in marine and fresh water systems [8].This element is needed by plants at only very low levels and is toxic at higher levels. At these levels, Lead can bind to the cell membrane and hinder the transport process through the cell wall. Lead at nearly 40ng mL-1 is required for normal metabolism of many living organisms [9, 10]. On the other hand, Lead is an important element in many industries. Thus, the development of new methods for selective separation, concentration and determination of it in sub-micro levels in different industrial, medicinal and environmental samples is of continuing interest. The determination of Lead is usually carried out by flame and graphite furnace atomic absorption spectrometry (AAS) [11, 12] as well as spectrometric methods [13, 14] .However, due to the presence of Lead in medicinal and environmental samples at low levels, its separation from other elements presents and also the use of a preconcentration step prior to its determination is usually necessary.
Different methods, especially Liquid- Liquid extraction of Lead in the presence of various classical [15] and macrocylic[16]co-extractant ligands has attracted considerable attention. However, the use of classical extraction methods for this purpose is usually time-consuming, labor-intensive and requires large amounts of high purity solvents for extraction. Nevertheless, several other techniques for the preconcentration and separation of Lead have been proposed including liquid chromatography[17] supercritical fluid extraction[18,19], flotation[24], aggregate film formation[25], liquid membrane[26],
column adsorption of pyrocatechol violet- Lead complexes on activated carbon[27], ion pairing[28], ion pairing[29], preconcentration with yeast[30], and solid phase extraction using C18 cartridges and disks[31-33].
Solid phase extraction (SPE) or liquid-solid extraction is poplar and growing techniques that are used to sample preparation for analysis. It is an attractive alternative for classical liquid-liquid extraction methods that reduce solvent usage and exposure, disposal costs and extraction time for
sample separation and concentration purposed [34-36]. In recent years, the octadecyl-bonded silica SPE disks have been utilized for the extraction and separation of different organic compounds from environmental matrices[37-40]. Moreover, the SPE disks modified by suitable ligands are successfully used for selective extraction and concentration of metal ions [41-42].
In a recent series of papers, [43-45] we have described the application of metal-DNA conjugates to nucleic acid sequence determination with catalytic signal amplification; the assay relies on the esterase activity of a DNA-linked Pb complex. For optimization of the system and exploration of structure- activity relationships, a sensitive probe would be useful, which allows straightforward detection of esterase activity of ligated Pb2+ in low concentration. The structure of nano Graphene oxide with covalently linked porphyrin(GO–H2P)is shown in Scheme 1. The chelated ions were desorbed and determined by FAAS. The modified solid phase could be used at least 50 times with acceptable reproducibility without any change in the composition of the sorbent, GO–H2P. On the other hand, in terms of economy it is much cheaper than those in the market, like C18 SPE mini-column.
In the present work, nano Graphene oxide with covalently linked porphyrin (GO–H2P) was employed for production of solid phase. The synthesized and characterized new sorbent (GO–H2P)was utilized for preconcentration of Pb(II) from water samples. Determination of Pb(II) concentration was achieved by FAAS after preconcentration procedure. The experimental conditions were optimized by CCD.
Experimental
Reagents and Chemicals
The analytical grade deionized water was obtained by reverse osmosis system. All containers and glassware were kept overnight in 10% nitric acid and rinsed three times with water before use.1,000 mg L-1stock Lead standard solution was prepared from Pb(NO3)2.4H2O (Merck) and diluted as required to the μg L-1 levels. In interference study, cations were added as nitrates and the anions were added as sodium salts. Feasibility of the suggested method was tested with Lake Ontario water certified reference material (TMDA-53.3, lot 0310).
Synthetic procedures
Preparation of GO–H2P
GO (15 mg) was stirred in 20 mL of oxalyl chloride at 80 °C for 24 h to activate the carboxylic units by forming the corresponding acyl chlorides. Then, the reaction mixture was evaporated to remove the excess oxalyl chloride and the brownish remaining solid (GO–COCl) was washed with anhydrous tetrahydrofuran (THF). After centrifugation, the resulting solid material was dried at room temperature under vacuum. For the covalent coupling between the free amino function of H2P and the acyl chloride of GO, 15 mg of GO–COCl was treated under anaerobic, dry conditions with 7 mg of H2P dissolved in 6 ml of dry THF at room temperature for 72 h. The hybrid material, namely GO–H2P, was obtained as a brown-graysolidby filtration of the reaction mixture through 0.2 mm PTFE filter and the filtrate was sufficiently washed with methylene chloride (4× 20 ml) to remove non-reacted free H2P and then with diethyl ether (2 × 20 mL) before being dried under vacuum.
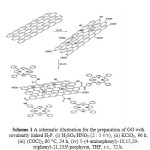 |
Scheme 1: A schematic illustration for the preparation of GO with covalently linked H2P. (i) H2SO4/HNO3 (2 : 1 v/v), (ii) KClO3, 96 h, (iii) (COCl)2,80 °C, 24 h, (iv) 5-(4-aminophenyl)-10,15,20-triphenyl-21,23H-porphyrin, THF, r.t., 72 h. Click here to View scheme |
Apparatus
A Philips X Pert-Pro diffracrometer (Pb Kα λ=1.54060 A°, 30 mA, 40 kV), and Perkin Elmer Spectrum 65 FTIR-ATR spectrometer were used to confirm the synthesized GO–H2P.Determination of Pb(II) in solutions were carried out by Perkin Elmer AAnalyst200FAASequipped with deuterium background correction. All measurements were performed inan air/acetylene flame. GFL 3005 orbital shaker having speed and time control was used forpreparation of the sorbent. During the solid phase extraction experiments, VelpScientificaSP311 peristaltic pump with Tygon tubes was used. A Thermo Orion 5 Star model pH meter,Heidolph MR 3001 K model magnetic stirrer, Sartorius TE214S electronic balance,Eppendorf Research micro pipettes wereused for the present work.Funnel tipped glass tube(10×100 mm) equipped with stopcock was used as a column for the preconcentration experiments.
Preparation of Solid Phase
The commercially available nano Graphene oxide with covalently linked porphyrin (GO–H2P) was activated by refluxing with 0.5 mol L-1 HNO3 for 1 h to remove any adsorbed metal ions. Then it was filtered, washed with deionized water until the filtrate was neutral.
In order to synthesize physically bonded GO–H2P, 10.0 g of nano Graphene oxide with covalently linked porphyrin (GO–H2P) was added to 50.0 mL acetone containing 50 mg MSE and refluxed for 24 h. The product was filtered off and washed with deionized water and dried at room temperature.
General Enrichment Procedure
1.0 g of GO–H2P was filled in the column and the effective factors on the preconcentration including pH, flow rate andselection of eluent type were investigated using the model solutions containing 5μg Pb(II). The determination of Pb(II) in eluates were achieved by FAAS. According to the precipitation of the metal hydroxides at alkaline environment, pH effect was evaluated within the range of 3-7. Experiments of flow rate for sorption and elution were performed at 3-20 mL min-1. In order to choose a proper eluent for desorbing the Pb(II) from the sorbent surface, different mineral and organic acids were tested .The proposed analytical procedure for Pb(II) preconcentration was optimized using three level full factorial CCD. The optimization procedure was performed separately for sorption and elution. Three variables; pH, sample volume, flow rate and eluent volume, eluent concentration, flow rate were regarded as factors for sorption and for elution, respectively.
Results and Discussion
The treatment of nano Graphene oxide with covalently linked porphyrin (GO–H2P) can lead to the derivatization of both the edge carboxyl and surface hydroxyl functional groups via formation of amides [20] or carbamate esters [21], respectively.
The formation of GO–H2P was followed by ATR-IR spectroscopy.Initially, in the spectrum of GO, the carbonyl vibration appears at 1716 cm-1, while there are fingerprints at 3616 cm-1 and 3490 cm-1 due to the presence of hydroxyl species at the basal plane of nano Graphene. The covalent linkage of H2P with the acyl chloride activated GO is evident from the presence of a band at 1630 cm-1, which is characteristic for the carbonyl groups of the amide units[23].
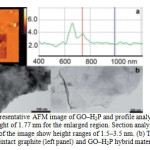 |
Figure 1(a): Representative AFM image of GO–H2P and profile analysis showing a height of 1.77 nm for the enlarged region. Section analysis of other regions of the image show height ranges of 1.5–3.5 nm. (b) TEM images of the intact graphite (left panel) and GO–H2P hybrid material (right panel). Click here to View figure |
The amount of porphyrin attached onto the nano Graphene sheet was evaluated by thermogravimetric analysis. As compared with the TGA results of pure graphite, which is thermally stable up to 900 °C under nitrogen, and GO which decomposes above 600 °C,after having lost the oxygenated species at 240 °C (i.e. 14.7% weight loss), the 6% weight loss occurred in the temperature range 250–550 °C for the GO–H2P material, is attributed to the decomposition of H2P (Fig. 2).
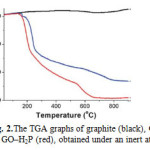 |
Figure 2: The TGA graphs of graphite (black), GO (blue) and GO–H2P (red), obtained under an inert atmosphere. Click here to View figure |
The GO–H2P material forms a stable dispersion in DMF at a concentration not exceeding 1 mg mL-1. The electronic absorption spectrum of GO–H2P in DMF (Fig. 3), shows (i)a broad signal monotonically decreasing from the UV to the visible region, which is attributed to GO and (ii) a characteristic band at 420 nm (Soret-band) corresponding to the covalently grafted H2P units (the Q-bands at 516, 557, 589 and 648 nm were flattened to the base line in the GO–H2P material). Interestingly, the absorption of porphyrin in the GO–H2P material is broadened, shortened and bathochromically shifted (ca. 2 nm) as compared to that of the free H2P, a result that corroborates not only the linkage of porphyrin with the GO sheets but also electronic interactions between the two species (i.e. GO and H2P) in the ground state. These results are in agreement with studiesbased on other hybrid systems consisting of porphyrins covalently grafted to carbon nanotubes and nanohorns[ 20].
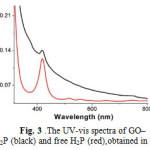 |
Figure 3: The UV-vis spectra of GO–H2P (black) and free H2P (red),obtained in DMF. Click here to View figure |
Effect of pH
The pH of the sample solution plays important role in retention of metals on sorbent. The pH of the model solutions containing 5μg Pb(II) were adjusted to certain value using diluted HNO3 and NaOH. As shown in Fig. 4,the recovery results were not dramatically affected by the change in pH between 4 and 7.According to this, pH=2.9 was chosen as center value for the optimization procedure.
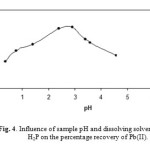 |
Figure 4: Influence of sample pH and dissolving solvent of GO–H2P on the percentage recovery of Pb(II). Click here to View figure |
Desorption Reagent
0.5 mol L-1 of HNO3, HCl, CH3COOH, H2SO4 and H2O2 were tested for desorption of Pb(II) from GO–H2P. The recovery percentages were varied between 5.7-87.9 % except HNO3 elution experiments.It was observed that HNO3is the best as an eluent and the recovery percentage is 94.2±1.5 %.
Effect of Flow Rate on Sorption and Elution
The retention of a metal ion on the sorbent also depends on the flow rate of the sample solution. Thus, the both effect of flow rate of the sample and eluent on the sorption and desorption of Lead ions were investigated between 3-20 mL min-1. Quantitative results (> 95%) were obtained up to 10 and 8 mL min-1 for sorption and elution, respectively. In order to avoid an abrupt change in adsorption and increase the contact time of the sample solution with the sorbent,flow rate was selected as 4 mL min-1 for sorption and elution.
Optimization of Variables
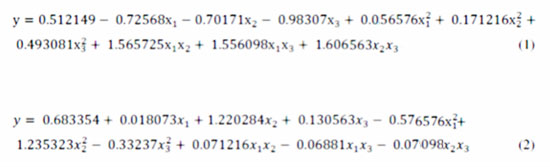
Optimization of the preliminary studies was achieved by a three level full factorial CCD with 20 runs.Table 1 lists the maximum, minimum and center values of the variables for sorption and elution. The metal concentration in solutions was determined with external standard calibration method by FAAS. The experimental design matrix and the results for sorptionand elution are given in Table 2and 3.Quadratic Eq. (1) and Eq. (2), which were obtained by using data of response values, are given below for sorption and elution, respectively.
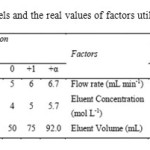 |
Table 1: Levels and the real values of factors utilized in CCD Click here to View table |
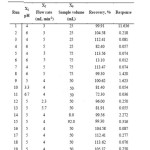 |
Table 2: Experiments and recovery values for the sorption of Pb(II) Click here to View table |
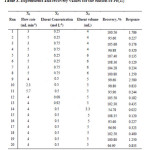 |
Table 3: Experiments and recovery values for the elution of Pb(II) |
x1, x2 and x3 represents the 1st, 2nd and 3rd factors. Derivatives of the equations in terms of x1, x2 and x3were equalized to zero and solved using Microsoft®Excel.The real values presented in Table 4 obtained from CCD and used as optimal conditions for further experiments.
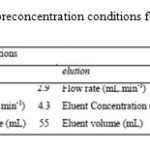 |
Table 4: Optimum preconcentration conditions for Pb(II) by GO–H2P |
| Table 5. Separation of Lead from binary mixtures a | |||
| Diverse ion | Amounts taken(mg) | % Found | %Recovery of Pb2+ ion |
| Na+ | 92.4 | 1.15(2.4)b | 98.7(1.8) |
| K+ | 92.5 | 1.32(2.3) | 98.5(2.9) |
| Mg2+ | 14.5 | 0.7(1.2) | 98.9(1.8) |
| Ca2+ | 26.3 | 2.25(3.0) | 98.5(1.6) |
| Sr2+ | 2.45 | 2.85(2.5) | 98.4(2.0) |
| Ba2+ | 2.66 | 3.16(2.1) | 98.3(2.3) |
| Mn2+ | 2.66 | 1.75(2.2) | 97.3(2.8) |
| Co2+ | 2.16 | 1.4(2.3) | 99.1(2.9) |
| Ni2+ | 1.65 | 2.0(2.4) | 98.5(2.6) |
| Zn2+ | 2.78 | 1.97(2.1) | 98.4(2.2) |
| Cd2+ | 2.55 | 1.92.0) | 98.2(2.8) |
| Pb2+ | 0.54 | 2.7(1.9) | 97(2.7) |
| Hg2+ | 0.44 | 2.81(2.1) | 97.7(2.8) |
| Ag+ | 2.63 | 3.45(2.9) | 96.6(2.9) |
| Cr3+ | 1.73 | 2.92(2.30 | 97.3(2.4) |
| UO2+ | 2.84 | 2.8(2.1) | 98.3(2.7) |
| a Initial samples contained 10µg Pb2+ and different amounts of various ions in 100 mL water(0.1 M acetate ion).b Values in parentheses are RSDs based on five individual replicate analysis. | |||
Interference Effects
The preconcentration procedures of trace metal ions can be strongly affected by other ions. For this reason, the effects of matrix ions were investigated under optimal conditions. The results revealed that the GO–H2P behaves as a neutral ionophore in the pH range 3.0 [49,50] so that the Lead ions are retained as ion pair complexes by the membrane disks. As seen, acetate ion is the most efficient counter anion for the SPE of Pb(II) ions. The influence of the concentration of sodium acetate ion on Lead recovery was investigated, and the results are shown in Table 4. As seen, the percent recovery of Pb2+ increasedwith the acetate concentration until a reagent concentration of about 0.1 M is reached, beyond which the recovery remained quantitative.Moreover, acetate ion acts as a suitable buffering agent, while it effectively contributes to the ions- pair formation; thus, in the SPE experiments, there was no need for the addition of any buffer solution.The tolerance limit of coexisting ions was given in Table 5.The experiments indicated that, no further sample treatment or masking reagents are needed.
Effect of Sample Volume
The preconcentration studies were applied to solutions within the range of 25-1000 mL containing 5 μg amount of Pb(II) to explore the possibility of enriching at low concentration with high enrichment factor. The recovery value was obtained as 98.7 % at 1000 mL sample volume by analyzing 5 mL eluate and the highest preconcentration factor was found to be 200.
Analytical Figures of Merit
The accuracy and precision (RSD, %)of the proposed solid phase extraction procedure underoptimal conditions were investigated (n=10) as 102.0±0.2 % and 2, respectively. Limits of detection (LOD) and the limits of quantification (LOQ) were obtained by using a criterion signal-to-noise ratio of 3 and 10, respectively. The results were calculated 49.6ng L-1forLOD and 163.7ng L-1 for LOQ.
Validation and Application of the Improved Method
The developed procedure was validated by Pb (II) determination in certified reference material.The results are given in Table 6. A statistical evaluation was performed by Student’st test and t value was calculated as 2.95. Criticaltvalue (4.30) is higher than the calculate done at 95 % confidence level. This test showed no significant difference between Pb(II)concentration obtained from the presented method and the certified value.
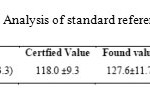 |
Table 6: Analysis of standard reference material |
Real Sample Analysis
To assess the applicability of the method to real samples, it was applied to the extraction and determination of Lead from different water samples. Tap water(Tehran, taken after 10 min operation of the tap),rain water(Tehran, 20 January, 2014), Snow water (Varamin , 6 February ,2014)and Sea water(taken from Caspian sea, near the Mahmoud-Abad shore) samples were analyzed(Table 7). As can be seen from Table 4 the added Lead ions can be quantitatively recovered from the water samples used. As is seen, the recovered Lead ion reveals that the results are quite reliable and are in satisfactory agreement with those obtained by ICPAES (Tables 7).
| Table 7. Recovery of Lead added to 1000mL of different water samples (contaning 0.1Macetate at pH= 5.0). | |||
|
Sample |
Pb2+ added (µg) | Pb2+determined(ng.mL-1) |
ICP-AES |
| Tap water | 0.010.0 | 1.74(1.4)a11.98(3.2) | ND11.7 |
| Snow water | 0.010.0 | 4.45(2.4)14.97(2.0) | ND14.7 |
| Rain water | 0.010.0 | 2.65(2.3)12.75(2.4) | ND12.3 |
| Sea Water | 0.010.0 | 12.64(2.3)22.93(2.0) | 12.523.1 |
| a Values in parentheses are %RSDs based on five individual replicate analysisb Not detected. | |||
|
Table 8 |
||||
|
Comparison with other solid phase adsorbents |
||||
|
Chelating agent/solid phase adsorbent |
Method |
Preconcentration factor |
Eluent |
References |
|
Dithizone/microcrystalline naphthalene |
FAAS |
200 |
7 mol L−1HCl |
[46] |
|
β-Naphthol/polyurethane foam |
Atomic |
50 |
0.1 mol L−1 HNO3 |
[47] |
|
absorption spec- |
||||
|
trophotometry |
|
|||
|
Dithizone/silica gel |
FAAS |
200 |
10 mol L−1 HCl |
[48] |
|
HgI42−-Aliquat-336/naphthalene |
Anodic stripping |
80 |
Tetraphenyl-borate |
[49] |
|
voltammetry |
||||
|
DuoliteGT-73 resin |
ICP-AES |
40 |
H2 SO4 –H2O2 mixture |
[50] |
|
Dithioacetal/SiO2 |
FAAS |
5 |
Water |
[51] |
|
Hexathia18 crown-6 tetraone/Empore disk |
FAAS |
50 |
1 mol L−1HBr |
[52] |
|
1,5-Diphenylcarbazone/SDS coated alumina |
FAAS |
100 |
1 mol L−1HBr |
[53] |
|
1,5-Bis(2-pyridyl)-3-sulfophenylmethylene) |
ICP-AES |
– |
HNO3 |
[54] |
|
thiocarbonohydrazide/Dowex anion exchange resin |
||||
|
4-(2-Pyridyl azo) resorcinol/nano-sized SiO2 |
FAAS |
50 |
6 mol L−1HCl |
[55] |
|
2-Mercaptobenzoxazole/chromosorb |
FAAS |
300 |
2 mol L−1 HNO3 in acetone |
[56] |
|
nano Graphene oxide with covalently linked porphyrin (GO–H2P) |
FAAS |
200 |
HNO3 |
Present work |
Conclusion
In the present study, a new sorbent is prepared by using nano Graphene oxide with covalently linked porphyrin (GO–H2P) and for preconcentration of Pb(II) from natural water samples. The modified nano Graphene oxide with covalently linked porphyrin (GO–H2P) was prepared easily and sorbedPb(II) rapidly. The preconcentration parameters pH, flow rate and sample volume for sorption procedure was obtained by CCD as 5.2, 4.3 mL min-1, 55.0 mL, respectively. Elution parameters, flow rate, eluent concentration and eluent volume were also obtained as 4.1 mL min-1, 0.6 mol L-1 and 5.1 mL, respectively. Enrichment factor was found to be 200 when 1000 mL of water sample(included 5μg) passed through the GO–H2P column. The interference effects of some ions were also investigated according to the improved method. The tolerance limits were between750-10,000 times greater as can be seen in Table 5. The mean recovery values for spiked water samples were satisfactory and confirmed the validity of the method. Additionally, mean %RSD value was 2 and showed that the precision of the method is quite good. Preconcentration factor, LOD, RSD, eluent type and concentration and detection technique of present work was compared with literature data in Table 8. In most cases, suggested method for Pbpreconcentration with GO–H2P is comparable to, or better than, some of the previously reported nano Graphene oxide with covalently linked porphyrin (GO–H2P) based modified adsorbents. Finally, the proposed method can be suggested as simple, sensitive, accurate and repeatable method for determination of Pb(II) after preconcentration. This new enrichment procedure can also be applied to some other metal ions.
Acknowledgements
The authour wish to thank the Chemistery Department of Varamin branch Islamic Azad University for financial support.
References
- A. K. Geim, K. S. Novoselov, Nat. Mater. 2007, 6, 183.
- Y. Zhang, Y.-W.Tan, H. L. Stormer, P. Kim, Nature 2005, 438, 201.
- C. Berger, Z. Song, X. Li, X. Wu, N. Brown, C. Naud, D.Mayou, T. Li,J. Hass, A. N. Marchenkov, E. H. Conrad, P. N. First, W. A. De Heer,Science 2006, 312, 1191.
- J. C. Meyer, A. K. Geim, M. I. Katsnelson, K. S. Novoselov, T. J.Booth, S. Roth, Nature 2007, 446, 60.
- N. Tombros, C. Jozsa, M. Popinciuc, H. T. Jonkman, B. J. van Wees,Nature 2007, 448, 571.
- A. M. Rodrý´guez, R. V. Jime´nez, Thermochim. Acta 1984, 78, 113.
- A. Lerf, H. He, M. Forster, J. Klinowski, J. Phys. Chem. B 1998, 102,4477.
- M.Wood, H.K.Wang, Environ. Sci. Technol. 1983; 17: 582A.
- B. C. Brodie, Philos. Trans. R. Soc. Lond. 1859, 149, 249.
- C.A.Burtis, E.R.Ashwood,Tiets extbook of Clinical Chemistery, third ed., Macmillan, New York, 1999 .
- B. Wetz, Atomic Absorption Spectroscopy, VCH, Amsterdam, 1985 .
- A.D.Eaton, L.S.Clesceri, A.E.Greenberg, 1995 Standard Methods for the examination of water and waste water ,19thed ,American Public Health Association, Washington,DC.
- F.J.Welcher, E.Boschmann, Organic Reagents for Lead, Krieger Huntington, New York, 1979.
- Z.Marczenko, Separation and Spectrophotometric Determination of Elements,EllisHorwood, London, 1986.
- H. C. Schniepp, J.-L. Li, M. J. McAllister, H. Sai, M. Herrera-Alonso, D. H. Adamson,R. K. Prud’homme, R. Car, D. A. Saville, I. A. Aksay,J. Phys. Chem. B 2006, 110, 8535.
- A.A. Schilt, W.C. Hoyle, Anal. Chem. 1964, 41: 344.
- L.G.Borchart, J.P. Butler, Anal. Chem. 1957 , 29: 414.
- F. A. De La Cruz, J. M. Cowley, Nature 1962, 196, 468.
- B. Shuai Wang, P.Jon Chia, L. Chua, L.Hong Zhao, R.QiPng,S. Sivaramakrishnan, S. Wee, H. Ho, Adv. Mater. 2008, 20, 3440–3446
- N. Karousis, A. S. D. Sandanayaka, T. Hasobe, S. P. Economopoulos, E.Sarantopouloua , N. Tagmatarchis, J. Mater. Chem., 2011, 21, 109.
- Smith MB, March J. March’s advanced organic chemistry: reactions,mechanisms, and structure. New York: John Wiley & Sons Inc.; 2001, 1182–3.
- Mermoux M, Chabre Y, Rousseau A. FTIR and carbon-13 NMR study of graphite oxide. Carbon 1991; 29(3):469–74.
- Cataldo F. Structural analogies and differences between graphite oxide and C60 and C70 polymeric oxides (fullerene ozopolymers). Fuller Nanotub Car N 2003; 11(1):1–13.
- A.N.Anthemidis, G.A. Zachariadis, J.A. Stratis, Talanta 2001, 54, 935.
- D. Zenedelovska, G. Pavlovska, K. Cundeva, T.Stafilov, Talanta 2001, 54: 139.
- M.Endo, K.Suziki, S.Abe, Anal. Chim.Acta 1998, 364:13.
- M.E. Campderros, A. Acosta, J. Marchese, Talanta 1998, 47:19.
- I. Narin, M. Soylak, L. Elic, M. Dogan, Talanta 2000, 52: 1041.
- Y. Akama, M.Ito, S. Tanaka, Talanta 2000, 52: 645.
- K. Ohta, H. Tanahasi, T. Suzuki, S. Kaneco, Talanta 2001, 53, 715.
- V. Cuculic, M. Mlakar, M. Branica, Anal. Chim.Acta 1997, 339, 181.
- A. Moghimi, M.S. Tehrani, S. Waqif Husain, 2006 Material Science Research India 3(1a):27.
- M.S. Tehrani, A.Moghimi, S.Waqif Husain, Material Science Research India 2005, 3(2), 135.
- E.M.Thurman,M.S.Mills, Solid-Phase Extraction, Principles and Practice, Wiley, New York, 1998.
- J. Pawliszyn, Solid-Phase Microextraction, Theory and Practice, Wiley-VCH, New York, 1997.
- R.M. Izatt, J.S. Bradshaw, R.L. Bruening, Pure Appl. Chem. 1996 , 68:1237.
- D.F.Hagen, C.G.Markell, G.A. Schmitt, Anal. Chim. Acta 1990, 236:157.
- C.J. Krueger, J.A. Fild, Anal.Chem. 1995, 67: 3363.
- K.Z.Taylor, D.S.Waddell,E.J.Reiner, Anal. Chem. 1995 ,67:1186.
- Y. Yamini, M. Ashraf-Khorassani, J. High Resolut. Chromatogr.1994 , 17:634.
- M.Shamsipur, A.R. Ghiasvand, Y.Yamini, Anal.Chem. 1999, 71, 4892.
- M. Shamsipur, A. R. Ghiasvand, H. Sharghi, Int. J.Environ. Anal.Chem. 2001 , 82, 23.
- Brunner, J.;Mokhir, A.;Kramer, R. J. Am. Chem. Soc. 2003 , 125: 12410.
- Zelder, F.H.;Brunner, J.; Kramer, R. Chem. Commun., 2004 , 902.
- Boll, I.; Kramer, R.; Brunner, J.; Mokhir, A. J.Am.Chem. Soc. 2005, 27, 7849.
- S. Farzaneh, M. A. Alsadat, S. N. Masood and R. R. Kozani, J. Anal.Chem 2004,59, 261.
- F. Xie, X. Lin, X. Wu and Z. Xie, Talanta 2008, 74, 836.
- A. Goswami, A. K. Singh and B. Venkataramani, Talanta 2003, 60, 1141.
- A. Goswami and A. K. Singh, Talanta 2002, 58, 669.
- Y. Liu, P. Liang and L. Guo, Talanta, 2005, 68, 25.
- X. Huang, X. Chang, Q. He, Y. Cui, Y. Zhai and N. Jiang, J. Hazard.Mater.2008, 157,154.
- N. Pourreza, R. Mirzajani, A. R. Kiasat and R. Abdollahzadeh, Quim. Nova 2012, 35,1945.
- D. Mendil, J. Food Sci. 2012, 77, 181.
- U. Zhai, X. Chang, Y. Cui, N. Lian, S. Lai, H. Zhen, Q. He, Microchim.Acta 2006, 154, 253.
- M. Ghaedi, M.R. Fathi, A. Shokrollahi, F. Shajarat, Anal. Lett.2006, 39, 1171 .
- D. Kera, N. Tekin, Microchim. Acta 2005, 149, 193.

This work is licensed under a Creative Commons Attribution 4.0 International License.
![]()
A New Edition of Web of Science
Journal Impact Factor
2022: 0.5
Five Year: 0.8
Journal is Indexed in

Cabells Whitelist
![]()


