Dynamics of Condition of Groundwater and Using it for Sub-Irrigation on Irrigated Lands of the Golodnostepsky Massif
Rahym Kizdashevich Bekbayev, Nurlan Nurmahanovich Balgabayev and Yermekul Dukenovna Zhaparkulova
Kazakh Scientific Research Institute of Water Economy, 12, K.Koigeldy, Taraz, 080003, Kazakhstan
DOI : http://dx.doi.org/10.13005/ojc/31.Special-Issue1.27
Article Received on :
Article Accepted on :
Article Published : 07 Nov 2015
The aim of this paper is to establish the dynamics of groundwater condition, to make assessment of quality and using it for sub-irrigation on irrigated land in the Kazakhstan part of the Golodnostepsky massif. The research results have shown that in the conditions of growth of surface water scarcity, using ground water for sub-irrigation inreases water availability of irrigated lands. The groundwater depth is affected by the amounts of losses in filtering in channels and irrigated lands. It has been established that efficiency of irrigation systems does not exceed 0.38 in the Makhtaaral array. Therefore, the losses amount to 62% of the total water intake. So, large losses of irrigation water for filtering lead to an intense rise of groundwater depth. For example, in 1994 the area of irrigated lands with groundwater depth up to 1 m was 105 hectares, in 2002 it was 378 hectares and in 2013 – 2,562 hectares. This indicates that the area of irrigated lands with groundwater depth has increased by 18 times since 1994. In 1994 the area of irrigated lands with groundwater depth of 1-2 m was 7,792 hectares and in 2013 – 37,348 hectares. Under these conditions, using ground water for subirrigation increases their share in the total amount of water consumption. The research results show that if ground water is shallow, their share in the total amount of water consumption reaches 74%.
KEYWORDS:Dynamics; Groundwater; Golodnostepsky
Download this article as:| Copy the following to cite this article: Bekbayev R. K, Balgabayev N. N, Zhaparkulova Y. D. Dynamics of Condition of Groundwater and Using it for Sub-Irrigation on Irrigated Lands of the Golodnostepsky Massif. Orient J Chem 2015;31(Special Issue1). |
| Copy the following to cite this URL: Bekbayev R. K, Balgabayev N. N, Zhaparkulova Y. D. Dynamics of Condition of Groundwater and Using it for Sub-Irrigation on Irrigated Lands of the Golodnostepsky Massif. Orient J Chem 2015;31(Special Issue1). Available from: http://www.orientjchem.org/?p=12370 |
Introduction
In the southern regions of Kazakhstan irrigated agriculture is based mainly on the waters of trans-boundary rivers, which are greatly salinized outside the Republic. In such conditions, the sustainability of agricultural production development can be achieved through using measures to protect water sources from further contamination (Vyshpolsky, & Mukhamedzhanov, 2005; Aydarov, 1985). This problem can be solved through the reduction in technological losses of irrigation water during vegetation watering, intrasystem use of drainage and wastewater for irrigation, groundwater for sub-irrigation (Vyshpolsky, 1982). These measures reduce the collector-drainage wastewater in irrigation sources. This technology of using water resources during the vegetation period will reduce the salt load on irrigated areas, located along the rivers, will improve the environmental situation, especially in the lower reaches of the river basins. However, the experience of the water industry development in Kazakhstan showed that the change of ownership (transfer of irrigated land and irrigation systems to the non-governmental structures) led to the reduction in the area of irrigated land from 2.36 million hectares to 1.4 million hectares and the loss of their resource values. As a result, the yield of arable crops decreased to 1.5 times, and the water outflow rate to obtain a unit of production increased to 30%.
The pollution of natural environment, the depletion of its main resources – land, water, affect negatively the level of productivity and sustainability of irrigated agriculture development in different natural-climatic zones of Kazakhstan. These conditions have a negative impact on the final results of economic activity, social situation, soil and environmental situation in the natural-economic complexes of trans-boundary river basins (Dukhovny, 1989). In such circumstances, the problem of reducing the rate of flow of degradation processes and environmental improvement in irrigation systems and river basins in different natural-climatic zones of Kazakhstan is of great practical importance.
In the early stages of irrigation development in southern Kazakhstan, where there were water resources, the idea of creating irrigation systems, providing a negative salt balance, was attractive because it provided protection of irrigated land from salinization. However, in the second half of the last century the volume of water intakes to the irrigation systems began to exceed the volume of natural flow of the Syr-Darya River due to the return of the drainage and wastewater and its repeated intake to the irrigation system (Kharchenko, 1975). From this period the quality of irrigation water began to deteriorate, so the problem of water resources protection from pollution started to be solved through the reduction in technological losses for infiltration, evaporation, discharge from the irrigated land by increased using ground water for sub-irrigation, if its mineralization was less than 3 g/l (Vyshpolsky, & Mukhamedzhanov, 2005).
The effectiveness of applied technical means and technological operations for management of water and land resources is characterized by the depth and salinization of groundwater (Parfenova, & Reshetkina, 1992). Thus, the limit fluctuations in groundwater levels are directly dependent on the amount of water intake, the natural moisture of the year, the inflow and outflow of ground water, health drainage systems (Katz, 1967; Rau, 1988). In wet years, when the water supply was close to the calculated indicators, the groundwater level lay above the critical depth.
Methods
Research to determine the impact of using ground water for sub-irrigation on the water condition in the roots soil strata and its share in the total amount of water consumption was conducted on the irrigated land of Mahtaaral district in the South Kazakhstan region. The irrigated land of Mahtaaral district are part of the Golodnostepsky massif, which are located in the middle reaches of the Syr-Darya River. The north-western part of the massif is limited in the north by the Shardarinskiy reservoir, in the east – by the territory of Uzbekistan, in the south – by the Central Golodnostepskiy Collector and in the west – by the Arnasai Depression. The gross area within the boundaries of Mahtaaral district is 177 thousand hectares. The total irrigated area (net) after inventory in 1991 amounted to 125739 thousand ha, and in 2013 – 144039 thousand ha (Anselm, 2012).
There is sharply continental climate the Golodnaya Steppe. The average annual temperature is +12.5ºC, the average July temperature is +27 – +30ºC, January – 3º-7ºC. The air humidity in the Golodnaya Steppe is very low, especially in the summer months. In July-August the relative air humidity fluctuates between 20% in dry spaces, up to 30% – in wetted ones by watering.
The amount of precipitation per year ranges from 175 to 425 mm. Precipitation by season is as follows: the most humid period of the year is Spring, during which more than 40% of annual precipitation falls; in Winter – 25-35%; in Aautumn – 15-20%; in Summer – 5-10%. Annual evaporation throughout the Golodnaya Steppe is more than 1200 mm or 12000 m3/ha.
Establishing the dynamics of groundwater level was carried out by monthly measurement of its levels in observation wells. Changes in groundwater mineralization were established by sampling water from observation wells in Spring, Summer and Autumn (figure 1). The chemical analysis of water samples was carried out in the laboratory of the Institute.
To assess the quality and establish limits on using ground water for sub-irrigation mineralization and ion-salt composition of ground water were determined. Thus, the following components were specified in ground water: СО32-, НСО3–, Cl–, SO42+, Ca2+, Mg2+, Na+, NO2, NO3, P2O5, K2O, humus and pH (Ganzhara, et al., 1985; Yakubov, et al., 1988). The ions obtained contacted with each other resulting in hypothetical salts. This allowed to establish quantitative indicators of toxic and non-toxic salts.
The results of chemical analysis of groundwater samples allowed us to assess the quality and to identify factors deteriorating the ameliorative state of water and land resources when using them for sub-irrigation.
For this purpose the existing methods were used (Yakubov, et al., 1988; Shitikov, et al., 2003; Shirokova, 2002). To assess the effect of water quality on soil alkalinization the dependence, developed by I.N. Antipov-Karataev and G.M. Kader, was used:
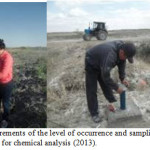 |
Figure 1: Measurements of the level of occurrence and sampling of ground water for chemical analysis (2013). Click here to View figure |
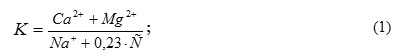
where: K – salinity of water, g/l; Ca2+, Mg2+, Na+ – content of cations in water, mg-eq. When K>1 no soil alkalinization occurs, when K<1, water is considered unsuitable for irrigation.
In foreign practice to assess the water quality by soil alkalinization hazards sodium adsorption ratio (SAR) is determined:
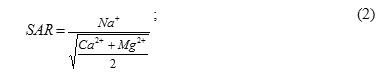
If SAR < 10 – hazard of soil alkalinization is small; if SAR = 10-18 – hazard of soil alkalinization is average; if SAR = 18-26 – hazard is high; if SAR > 26 – it is very high.
The processes of soil alkalinization are also affected by sodium bicarbonate in water, which, precipitating cations of calcium and, to a lesser extent, magnesium, violates cation balance and increases hazard of sodium salinization. Assessment is based on the magnitude of RSC (residual sodium carbonate), which is determined by the difference between alkalinity and sum of calcium and magnesium ions (Ganzhara et al., 1985; Yakubov et al., 1988; Shitikov et al, 2003):
RSC = (СО32- +НСО3–) – (Са2++Mg2+); (3)
At RSC > 2.5 mg-eq./l – water is unsuitable for irrigation; at RSC = 1.25-2.5 mg-eq./l – water is limited suitable; at RSC < 1.25 mg-eq./l – it is suitable.
Hazard of sodium salinization of soils is measured at content of normal soda in water – Na2CO3. If Na2CO3 < 0.3 mg-eq./l – water is safe for irrigation; If Na2CO3 = 0.3-0.6 mg-eq./l – water is suitable for irrigation; If Na2CO3 > 0.6 mg-eq./l – it is unsuitable for irrigation without bringing ameliorants in it.
By pH value (pH) alkalinity of water is estimated. At pH = 6.5-7.9 – water is neutral; at pH = 8.0-8.5 – water is weakly alkaline; pH = 8.6-9.0 – it is strongly alkaline; pH>9 – it is very strongly alkaline.
The increased content of magnesium cations in irrigation water has an adverse effect on chemical properties of soils. Assessing the impact of magnesium is carried out by determining the magnesium percentage of its ratio to the sum of calcium and magnesium cations (Ganzhara, et al., 1985; Yakubov, et al., 1988; Shitikov, et al., 2003):
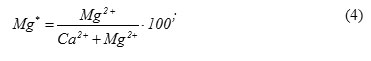
Magnesium (Mg*), determined by the formula, has an adverse effect on the soil, if its percentage is above 50%.
Establishing the intensity and volume of groundwater consumption for evapotranspiration was carried out by studying the dynamics of moisture content of soil during the vegetation period at various groundwater s. The volumes of ground water, used for sub-irrigation, were determined by water balance rate:
Vg = Ev– Vn-10Pv – D + If+ Qw – In, (5)
where: Vg – groundwater volume used for sub-irrigation, m3/ha;
Ev – total volume of water consumption during the vegetation period, m3/ha;
Vn – deposit of moisture in the soil, which can be used by plants during the vegetation period, m3/ha;
10Pv – precipitation during the vegetation period, m3/ha;
D – volume of collector-drainage water used for crop irrigation, m3/ha;
If – volume of infiltration losses on irrigated lands, m3/ha;
Qw – volume of losses of irrigation water for discharge while watering crops, m3/ha.
In – irrigation rate (net wt.), m3/ha.
The operating experience of irrigated lands shows that the dynamics of the groundwater level is affected by the amounts of infiltration losses, which depend on the technical state of irrigation systems. Therefore, the technical state of irrigation systems of the Makhtaaral array and their impact on the amounts of infiltration losses of irrigation water were investigated. The research results of the technical state of the irrigation network show that in the Makhtaaral array about 95.6 % of interfarm and 79.2 % of in-house channels are made in cut-and-fill of earthen bed. The dams of channels have overgrown with weeds and to create the necessary horizons there is strong water filtration. Therefore, the performance factor (PF) of channels for the array under investigation is 0.54. Consequently, 46% of water intake is lost for filtering, evaporation and discharge.
Then, at PF of furrow irrigation technology of 0.7 for the Makhtaaral array the overall PF of the Kazakhstan part of the Golodnostepsky massif is 0.38. At PF of furrow irrigation technology of 0.7 for the Makhtaaral array in addition to PF of the main and interfarm channels, in-house irrigation network PF of irrigation technique is taken into account (Kostyakov, 1951). Thus, PF of the system is established by formula:
ηi.s.= ηic * ηic * ηit (6)
where ηi.s. – performance factor of the Kazakhstan part of the Golodnaya Steppe irrigation system;
ηic – PF of the interfarm channel “Dostyk”, 0.80-0.85;
ηic – PF of the in-house channel, 0.66;
ηit – PF of irrigation technique elements, aspect ratio of water, supplied to the field, to the amounts of its accumulation in the root layer used by the plants, 0.7.
With these PF parameters, the amount of wastes is 62% of the water intake (Table 1). For example, in 2013 with the volume of water intake 957.27 million m3 the volume of irrigation water losses amounted to 440.34 million m3.
As a result, the volume of water supply to the irrigated land was 516.93 million m3. At PF of furrow irrigation technology of 0.7 the volume of irrigation water losses on the field amounted to 155.08 million m3.
Then the accumulated volume of water in the soil was 364.85 million m3 or 2533 m3/ha.
Table 1: Volume of irrigation water losses in the vegetation period over the Makhtaaral array
|
Years |
Irrigated area, ha
|
Intake volume |
Volume of water losses in channels, mln.m3 |
Volume of water supply, mln.m3 |
Volume of water losses on fields, mln.m3 |
Accumulated volume of water in the soil (net) |
||
|
mln.m3 |
m3/ha |
mln.m3 |
m3/ha |
|||||
|
2011 |
138800 |
916.7 |
6605 |
421.68 |
495.02 |
148.51 |
346.51 |
2497 |
|
2012 |
144039 |
877.2 |
6090 |
403.51 |
473.69 |
142.11 |
331.58 |
2302 |
|
2013 |
144039 |
957.27 |
6646 |
440.34 |
516.93 |
155.08 |
364.85 |
2533 |
Large losses of irrigation water for filtering result in the intensive rise of groundwater levels. For example, in 1994 the irrigated area with groundwater depth up to 1 m was 105 ha, in 2002 – 378 ha and in 2013 – 2562 ha (table 2). This indicates that the irrigated area with groundwater level has increased by 18 times since 1994. In 1994 the area of irrigated land with groundwater depth of 1-2 m was 7792 ha and in 2013 – 37348 ha (Anselm, 2012).
Table 2: Distribution of irrigated land by the groundwater depth
|
Years |
Total area,hectares |
Groundwater depth, m |
||||
| 0-1 | 1-2 | 2-3 | 3-5 | over 5 | ||
| 1994 | 125715 | 1050.1 | 77926.2 | 7208457.3 | 4344134.6 | 22931.8 |
| 2002 | 136842 | 3780.3 | 2207316.1 | 6258445.7 | 4956336.2 | 22441.6 |
| 2009 | 138767 | 14171.0 | 7147651.5 | 4427331.9 | 1992614.4 | 16751.2 |
| 2013 |
144039 |
2562 1.8 |
37348 25.9 |
54512 37.8 |
48245 33.5 |
1372 1.0 |
| Note: the numerator is the area in hectares; the denominator is the area in % of the total area | ||||||
The reason for rapid growth of the irrigated areas with shallow groundwater levels is reduction of the degree of drainage of irrigated lands. There are two rising groundwater levels in the Golodnostepsky massif. The first rise occurs during the flushing operation and the second rise – during vegetation irrigation (Figure 2).
For example, according to the observation wells No.30 and 53 the amplitude of oscillation of groundwater levels during the flushing operation is up 2.5 m. During the period of vegetation irrigation the amplitude of oscillation of groundwater levels is reduced to 1.5-2 m.
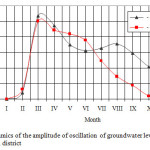 |
Figure 2: Dynamics of the amplitude of oscillation of groundwater levels in the Makhtaaral district |
The intensive rise of groundwater levels during the flushing operation, which is held annually, and vegetation irrigation increases the area of irrigated land with shallow groundwater level greatly. This is confirmed by the data given in table 3.
Table 3: Distribution of the groundwater levels on the irrigated land of the Makhtaaral district (June)
|
Rural districts |
Years |
Irrigation area, ha |
Groundwater level, m |
|||||
|
0-1 |
1-2 |
2-3 |
||||||
|
ha |
% |
ha |
% |
ha |
% |
|||
| Irzhar |
2014 |
7356 |
5731 |
78 |
1625 |
22 |
– |
– |
|
2013 |
7477 |
5477 |
73 |
2000 |
27 |
– |
– |
|
| Makhtaaral |
2014 |
11457 |
10307 |
90 |
1150 |
10 |
– |
– |
|
2013 |
11057 |
11032 |
100 |
25 |
– |
– |
– |
|
| Nurlybayev |
2014 |
6466 |
5992 |
93 |
474 |
7 |
– |
– |
|
2013 |
6405 |
5647 |
88 |
670 |
11 |
88 |
1 |
|
A comparative analysis of the presented data shows that the groundwater level does not fall below 2 meters during the irrigation period. On most irrigated areas, groundwater levels are at depth of up to 1 m.That is why soil in the root layer of the irrigated land of the Makhtaaral array has a high moisture content during the whole vegetation period (table 4). The average value of soil moisture in the 0-100 cm layer varies within 15.21-20.95% of the weight of absolutely dry soil. The minimum average indicators of soil moisture were obtained at the beginning of August, in the period of 1mass irrigation of the cotton plant. In this period the moisture content of the roots soil strata drops to 72.4% of the minimum moisture-holding capacity. The maximum average moisture content in the roots soil strata is in early April. In this period, after washing the groundwater level has the minimum depth from the ground surface. Moisture stability of the roots soil strata during the vegetation period is confirmed by the coefficient of variation.
Table 4: Dynamics of moisture content in the roots soil strata of the Mahtaaral array during the vegetation period
|
Sampling date |
Horizons, cm |
Soil moisture content |
Number of points |
Coefficient of variation (V), % |
||
|
minimum |
average |
maximum |
||||
| 5-7.04. 2013 |
0-50 |
9.92 48.9 |
18.62 91.7 |
23.32 114.9 |
15 |
33.4 |
|
0-100 |
18.8 90.1 |
20.95 100 |
24.99 119.0 |
15 |
32.6 |
|
| 5-8.05.2013 |
0-50 |
15.10 73.7 |
17.38 85.0 |
19.57 95.5 |
21 |
10.5 |
|
0-100 |
18.09 86.1 |
19.24 91.6 |
22.30 106.2 |
21 |
12.9 |
|
|
19.06.2013 |
0-50 |
11.15 54.4 |
14.59 71.2 |
16.77 81.8 |
20 |
9.40 |
|
0-100 |
14.95 71.2 |
17.54 83.5 |
20.33 96.8 |
20 |
10.1 |
|
|
15-18.07.2013 |
0-50 |
9.7 47.3 |
15.27 74.5 |
21.91 106.9 |
18 |
23.1 |
|
0-100 |
15.3 72.9 |
17.42 83.0 |
21.10 100.5 |
18 |
18.7 |
|
|
7-10.08.2013 |
0-50 |
8.52 41.6 |
12.74 62.1 |
19.02 92.8 |
18 |
23.1 |
|
0-100 |
12.27 58.4 |
15.21 72.4 |
18.08 86.1 |
18 |
13.5 |
|
|
21-23.08.2013 |
0-50 |
9.92 48.4 |
16.53 80.6 |
22.46 109.6 |
18 |
25.7 |
|
0-100 |
11.29 53.8 |
18.20 86.7 |
22.94 109.2 |
18 |
38.3 |
|
|
20-21.09.2013 |
0-50 |
8.77 42.8 |
14.30 69.8 |
16.36 79.8 |
18 |
16.6 |
|
0-100 |
12.54 59.7 |
16.19 77.1 |
19.38 92.3 |
18 |
11.5 |
|
| Note: the numerator is % of the weight of absolutely dry soil; the denominator is % of the minimum moisture-holding capacity (MM) | ||||||
From the given data we can see that the minimum moisture content occurs in the upper layers of the roots soil strata. For example, in one week of August the minimum soil moisture in the 0-50 cm layer was 8.52% of absolutely dry soil. In the 1st decade of August the minimum soil moisture content in the 0-50 cm layer made 8.52% of absolutely dry soil. However, there is sharp increase in soil moisture in the lower horizons (table 5). This is explained by shallow groundwater. Therefore, soil moisture increases dramatically in horizons of 60-100 cm. The high soil moisture in these horizons is maintained during the vegetation period.
Table 5: Moisture changes in the depth of the roots soil strata of A. Makhambetov’s farm
|
Horizons, cm, |
Sampling date |
||||||
| 5.04. 2013 | 5.05.2013 | 19.06.2013 | 18.07.2013 | 8.08.2013 | 21.08.2013 |
21.09.2013 |
|
| 0-20 |
24.82 |
12.26 |
8.10 |
10.85 |
19.86 |
19.83 |
13.68 |
| 20-40 |
22.53 |
17.75 |
15.25 |
14.21 |
17.84 |
17.90 |
16.56 |
| 40-60 |
21.66 |
19.08 |
18.61 |
17.81 |
23.62 |
18.33 |
18.70 |
| 60-80 |
24.73 |
26.68 |
23.72 |
22.19 |
27.25 |
24.38 |
23.07 |
| 80-100 |
26.81 |
27.97 |
26.20 |
23.17 |
28.43 |
27.41 |
24.87 |
| 0-50 |
23.32 |
16.36 |
13.06 |
13.59 |
19.80 |
18.68 |
16.31 |
| 0-100 |
24.11 |
20.75 |
18.38 |
17.65 |
23.40 |
21.57 |
19.38 |
High moisture in the upper layers of the roots soil strata is achieved at carrying out flushing operation. In this case, the distribution of soil moisture has a uniform character. In the period of sowing (1st decade of May) cotton plant in the top 0-20 cm soil layer the soil moisture content is within 60% of the minimum moisture-holding capacity. In the 20-40 cm soil layer, the soil moisture content was more than 85% of the minimum moisture-holding capacity, which ensured high germination of cotton plant. Therefore, the first irrigations of cotton plant in the Makhtaaral array annually begin in the first week of July. At the same time, farms irrigate cotton 1-2 times during the vegetation period, and some of them do not even water it.
Using ground water for sub-irrigation reduces the volume of water intake and water discharge. Intensity of groundwater inflow in the roots soil strata depends on the groundwater depth and moisture of the roots soil strata. Sub-irrigation efficiency is confirmed by water balance of irrigated land (Table 6). For example, at hydromorphic condition, with total volume of water consumption 5200 m3/ha the irrigation norm was 1200 m3/ha, and the volume of groundwater outflow for evapotranspiration – 3850 m3/ha. Consequently, the groundwater share is 74% in the total amount of water consumption, and irrigation water share – 26%.
Table 6: Calculation of the water balance rate of irrigated land of the Kyzylorda array
|
Articles of the balance |
Hydromorphic |
Semihydromorphic |
Automorphic |
|
Inflow |
|
||
| Original moisture reserves, m3/ha |
2980 |
2820 |
2730 |
| Precipitation, m3/ha |
570 |
570 |
570 |
| Irrigation norm, m3/ha |
1200 |
2400 |
3300 |
| Groundwater inflow, m3/ha |
3850 |
2460 |
0 |
| Total, m3/ha |
8600 |
8250 |
6600 |
|
Outflow |
|||
| Infiltration losses m3/ha |
670 |
910 |
1190 |
| Ending moisture reserves, m3/ha |
2730 |
2480 |
1380 |
| Total amount of water consumption, m3/ha |
5200 |
4860 |
4030 |
| Total, m3/ha |
8600 |
8250 |
6600 |
The data shows that with the soil semihydromorphic soil condition, where the groundwater level varies between 2-3 m, the volume of groundwater consumption for evapotranspiration decreases. Thus, the volume of groundwater consumption for evapotranspiration is 2460 m3/ha or 51% of the total volume of water consumption. Therefore, irrigation norm increases and is 49% of the total volume of water consumption. With automorphic soil condition, the total volume of water consumption is fully compensated by irrigation water.
However, one of the main factors, limiting the groundwater use for sub-irrigation, is the possibility of processes of salts accumulation in the roots soil strata. These processes tempos depend on the mineralization and ion-salt composition of ground water. It is confirmed by the results of salt balance of irrigated lands at change of groundwater mineralization.
Table 7: The salt balance of the roots soil strata with hydromorphic condition of soil during the vegetation period, t/ha
|
Articles of the balance |
Groundwater mineralization, g/l |
||||
|
0.5-1 |
2-3 |
4-5 |
5-7 |
7-10 |
|
|
Inflow |
|||||
| Original salinization (0.65%), t/ha |
98.8 |
98.8 |
98.8 |
98.8 |
98.8 |
| Inflow of salts with irrigation water, t/ha |
2.7 |
2.7 |
2.7 |
2.7 |
2.7 |
| Inflow of salts with ground water, t/ha |
3.8 |
11.1 |
19.8 |
26.6 |
37.7 |
| Total, t/ha |
105.3 |
112.6 |
121.3 |
128.1 |
139.2 |
|
Outflow |
|||||
| Washing salts away with infiltration water, t/ha |
2.9 |
4.6 |
6.7 |
9.2 |
13.1 |
| Ending salts reserves in % of the original content, t/ha |
102.4 104.0 |
108.0 109.3 |
114.6 116.0 |
118.9 120.3 |
126.1 127.6 |
The comparative analysis of the results of salt balance shows that in almost all groundwater mineralizations accumulation of salts occurs in the roots soil strata. The minimum rates of salts accumulation in the roots soil strata were obtained at groundwater mineralization 0.5-1 g/l. In this period, the salt reserves increased for 3.6 t/ha, or for 4% of the original content during vegetation. With the growth of groundwater mineralization the salts content in the roots soil strata increases. Therefore, the maximum salt reserves in the roots soil strata were obtained with groundwater mineralization 7-10 g/l at the end of vegetation period. In this case, the salt reserves in the roots soil strata increased for 27.3 t/ha or 27.6% of the original salinization.
Therefore, in the conditions of insufficient drainage of hydro-reclamation systems, studying the dynamics of ion-salt composition of ground water in time and space, making assessment and setting limits on using it for sub-irrigation are of great importance. The results of studying groundwater mineralization show that their indicators change within 0.844 – 25.470 g/l in the Makhtaaral array (table 8).
Table 8: The ionic composition of ground water of irrigated land of the Makhtaaral district
|
Sampling place
|
No. of wells |
Anions |
Cations |
Total amount of salts |
|||||
|
СО32- |
HCO3– |
Cl– |
SO42- |
Ca2+ |
Mg2+ |
Na+ |
|||
|
Makhtaaral array |
15 k |
abs. |
0.305 5.00 |
0.142 4.03 |
0.355 7.40 |
0.060 3.00 |
0.134 11.16 |
0.055 2.27 |
1.051 |
|
38 |
0.030 1.00 |
0.488 8.00 |
11.540 326.9 |
5.330 111.0 |
0.750 37.50 |
2.280 190.0 |
5.060 219.4 |
25.470 |
|
|
151 |
0.018 0.60 |
0.183 3.00 |
0.106 3.00 |
0.316 6.58 |
0.076 3.80 |
0.084 7.00 |
0.060 2.38 |
0.844 |
|
|
91 |
0.042 1.40 |
0.634 10.39 |
1.600 45.30 |
7.110 148.1 |
0.850 42.50 |
1.854 154.5 |
0.230 8.19 |
12.300 |
|
|
46 |
0.108 3.60 |
0.122 2.00 |
2.698 76.40 |
3.379 70.39 |
0.100 5.00 |
0.256 21.30 |
3.310 126.09 |
9.563 |
|
|
235 |
0.006 0.20 |
0.122 2.00 |
0.142 4.06 |
0.508 10.58 |
0.044 2.20 |
0.114 9.50 |
0.118 5.14 |
1.054 |
|
|
141 |
0.048 1.60 |
0.293 4.80 |
0.071 2.01 |
12.797 266.60 |
0.750 37.50 |
1.006 83.80 |
3.565 153.71 |
18.530 |
|
Analysis of the ionic composition of ground water of irrigated land of the Golodnostepsky massif showed that the chemical composition of their salinization is determined by mineralization of water, because at low groundwater mineralization, the chemical composition, mainly, conforms soda-chloride-sulphate salinization, and by the cationic composition – calcium and magnesium one.
The chemical composition of soil salinity is determined by high content of hydrocarbons, and by the presence of ions СО32- in ground water. The content of toxic chlorine ion in ground water varies within 0.106-11.540 g/l and ranges from 13.0 to 45% of the amount of salts. At low groundwater mineralization the dominant anion is SO42-, the share of which varies 35-69% in the total amount of salts. In the cation composition of salts with low water mineralization Mg2+ dominates. At low groundwater mineralization Na+ cations exceed Ca2+ cations in many wells.
In order to establish limits on using ground water for sub-irrigation, an assessment of its quality by total mineralization (C), ion-salt composition, K, SAR, ОКН and Мg* was carried out. The comparative analysis indicates that the lower the groundwater mineralization is, the more the extent of using it for sub-irrigation increases (table 10).
Table 9: Parameters for the qualitative composition of ground water
|
Sampling place |
No. of wells |
Indicators |
|||||
|
С, g/l |
рН |
К |
SAR |
OKH |
Mg*, % |
||
|
Makhtaaral array |
15 k |
1.051 |
8.55 |
5.64 |
0.9 |
-9.2 |
78.8 |
|
38 |
25.47 |
8.30 |
1.01 |
20.6 |
-218.5 |
83.5 |
|
|
151 |
0.844 |
8.60 |
4.20 |
1.0 |
-7.2 |
64.8 |
|
|
91 |
12.3 |
8.65 |
17.87 |
0.8 |
-185.2 |
78.4 |
|
|
46 |
9.563 |
8.55 |
0.21 |
34.8 |
-20.7 |
81.0 |
|
|
235 |
1.054 |
8.70 |
2.17 |
2.1 |
-9.50 |
81.2 |
|
|
141 |
18.53 |
8.60 |
0.77 |
19.8 |
-114.9 |
69.1 |
|
|
Maximum allowable values |
<3.0 |
<7.9 |
>1.0 |
<10 |
<1.25 |
<50 |
|
The given data shows that the limiting factors on using ground water for sub-irrigation in the Makhtaaral array are the indicators of groundwater mineralization, pH and Mg*. For example, pH and Mg* indicators at any mineralization of ground water exceed the allowable values. Therefore, using ground water with such quality indicators leads to soil salinization, salinity and alkalization (Vyshpolsky et al., 2008; Karimov et al., 2009; Rozov, 2009; Saparov, 2013).
Discussion
Thus, the results of reserach, conducted in the Kazakhstan part of the Golodnostepsky massif, where the irrigation systems of the Makhtaaral district of the Southern Kazakhstan region are located, has shown that the deterioration of the technical state of irrigation systems predetermined large losses of irrigation water for filtering. Examination of the technical state of irrigation systems of the Makhtaaral array has shown that the volume losses of irrigation water during transportation to the irrigated land and irrigation of agricultural crops reaches 62% of water intake. As a result, there has been a rise in groundwater levels in the whole Makhtaaral array.That is why, more than 65% of irrigated land have groundwater levels of up to 3 meters
In the irrigation period the groundwater level in the array does not fall below 2 meters. The result is an intense expenditure of ground water for evapotranspiration. This is confirmed by the dynamics of moisture in the root soil layer which has high values during the whole vegetation period. The average value of soil moisture in the 0-100 cm layer varies within 15.21-20.95% of the weight of absolutely dry soil. The minimum average values of soil moisture were obtained at the beginning of August, in the period of 1mass irrigation of the cotton plant. In this period the moisture content of the roots soil strata drops to 72.4% of the minimum moisture-holding capacity. The maximum average values of the soil moisture content in the roots soil strata are taken in early April. It is connected with the fact that, after washing the groundwater level has the minimum depth from the ground surface.
The research results have shown that if the ground water is shallow, its share in the total water consumption reaches 74%. The irrigation water share decreases and makes 26% of the total amount of water consumption.
However, one of the main reasons, limiting the groundwater use for sub-irrigation, is the possibility of salts accumulation in the root layer, soil salinization and alkalization. Therefore, using the existing methods assessment of groundwater quality has been made and the main factors, affecting the ecological condition of irrigated lands, have been identified.
Conclusions
The research results have shown that under conditions of increasing scarcity of water resources, improvement of water supply of irrigated lands to obtain high crop yields can be achieved by using ground water for irrigation and sub-irrigation (). A possibility of using ground water for sub-irrigation is confirmed by the results of experimental investigation conducted in the Kazakhstan part of the Golodnostepsky massif.
The analysis of research results shows that using ground water for sub-irrigation allows to reduce the amounts of irrigation water to 74%. However, with intensive use of ground water for sub-irrigation the processes of soil salinization also intensify. However, depending on the groundwater mineralization, the increase in the degree of soil salinity ranges from 4 to 27.6% from the original salinity. Therefore, the given parameters of possible reduction of norms of water intake in the irrigation systems due to the reconstruction of irrigation network, application of water-saving technical means for irrigation and groundwater use for sub-irrigation are acceptable for hydromorphic soils series, which are not saline, and the groundwater mineralization is below than 3 g/l. In saline or prone to salinization irrigated lands of hydromorphic type, where groundwater mineralization is greater than 3 g/l, the amounts of water intake should be increased for 20-30% (Vyshpolsky, 2010). This technique will create the “salt ventilation” in the aeration zone, and will stabilize the sustainability of the irrigated agriculture development.
In the conditions of the Makhtaaral district of the South Kazakhstan region, where a large amount of water consumption (20-45% of transpiration) is provided by sub-irrigation, the intake amounts on average will reduce to 1.5-1.7 times. The set limits of possible reduction of water intake norms for various levels of technical improvement of irrigation systems, at which the sustainable water supply to agricultural crops is achieved, will improve the environment in irrigated areas, will increase the productivity of irrigated lands and the competitiveness of producers.
Thus, the dynamics of the groundwater level and mineralization show that in the Makhtaaral district: the rise of the groundwater level; the growth of irrigated areas with shallow groundwater occurrence; the increased mineralization and areas with high groundwater mineralization; the increase in the degree of soil salinization and saline irrigated areas; salinization and alkalization of soils took place by reducing the drainage conditions of irrigated lands.
The reduced drainage conditions of irrigated lands, the rise of the level of mineralized groundwater occurrence and high mineralization of irrigation water of low quality lead to increased degradation processes in the root soil layer. In the current situation, the non-compliance of technology for crop irrigation, the low technical conditions of irrigation and collector-drainage networks, the nonoperating vertical drainage systems, the growth of irrigation water mineralization increased the rate of degradation processes occurrence in irrigated lands of the Golodnostepsky massif.
It is established that the increase of toxic salts in the upper 0-40 cm layer of the Golodnostepsky massif is only 1.9 t/ha. However, in the lower levels, the rate of accumulation of toxic salts in the 0-100 cm layer increased by 22.7% or 11.0 t/ha. The reason for the rapid accumulation of toxic chlorides is shallow groundwater occurrence, the free solubility of the chlorides and their low sorption capacity. As a result, their migration from ground water into the upper layers of the potting soil increases. The cumulative nature of salts in the root soil layer has predetermined the increase of saline irrigated lands.
References
- Vyshpolsky, F., & Mukhamedzhanov, H. (2005). Technologies for water saving and management of soil-reclamation processes under irrigation. Taraz: Aqua.
- Aydarov, I. (1985). Regulation of water-and-salt and nutrient conditions of irrigated land. Moscow: Agropromizdat.
- Vyshpolsky, F. (1982). Some aspects of reclamation processes management on irrigated lands in Kazakhstan. Improvement of Irrigated Land Reclamation in Kazakhstan. Proceedings of KazNIIVH, Tashkent, 53-68.
- Dukhovny, V., Avokyan, I., & Mikhailov, V. (1989). Reclamation, water management and socio-economic problems of Central Asia. Irrigation and Water Management, 9, 3-6.
- Ikramov, R. (2002). The role of water saving in integrated water resources management in irrigated agriculture. Water Resources of Central Asia. Proceedings of the research and practical conference on the 10th anniversary of ICWC (Inter-state Commission for Water Management), Almaty, 96-104.
- Kharchenko, S. (1975). Hydrology of irrigated land. Leningrad: Gidrometnoizdat.
- Parfenova, N., & Reshetkina, N. (1992). Principles for the regulation of water-salt condition of irrigated lands. Irrigation and Water Management, 7-8, 13-15.
- Katz, D. (1967). Monitoring groundwater condition on the irrigated lands. Moscow: Kolos.
- Rau, A. (1988). Water distribution in the rice systems. Moscow: Agropromizdat.
- Anselm, K. (2012). Report on the meliorative state of irrigated lands of the South Kazakhstan region. Shymkent.
- Ganzhara, N., Grechin, I., Kaurichev, I., Panov, N., Savich, V., & Stratonovich, M. (1985). Workshop in Soil Science. Moscow: Agropromizdat.
- Yakubov, H., Usmanov, A., & Bronitsky, N. (1982). Guidance on the use of drainage water for irrigation of crops and washing saline lands. Tashkent.
- Shitikov, V., Rozenberg, G., & Zinchenko, T. (2003). Quantitative Hydroecology: methods of system identification. Togliatti: IEVB RAS.
- Shirokova, Y. (2002). Quality assessment of river and drainage and wastewater of republics of the Central Asian region for irrigation. Water resources of Central Asia. Proceedings of the research and practical conference on the 10th anniversary of ICWC, Almaty, 320-344.
- Kostyakov, N. (1951). The basis for land reclamation. Moscow: Selkhozgiz.
- Vyshpolsky, F., Qadir, M., Karimov, A., Mukhamedjanov, H., Bekbaev, U., Paroda, R., Aw-Hassan, A., & Rarajeh, F. (2008). Enhancing the productivity of high-maganesium soil and water resources in central Asia through the application of phosphogypsum. Land Degradation Development, 19, 45-56.
- Karimov, A., Qadir, M., Noble, A., Vyshpolsky, F., & Anzelm, K. (2009). Development of Magnesium-Dominant Soils Under Irrigated Adriculture in Southern Kazakhstan. Pedosphere, 19, 331-343.
- Rozov, L. (1956). Reclamation soil science. Moscow: Selkhozgiz.
- Saparov, A. (2013). Soil Resources of the Republic of Kazakhstan: Current Status, Problems and Solutions. Novel Measurement and Assessment Tools for Monitoring and Management of Land and Water Resources in Agricultural Landscapes of Central Asia. Springer is part of Springer Skiense Business Media.
- Vyshpolsky, F., Mukhamedjanov, K., Bekbayev, U., Ibatullin, S., Yuldashev, T., Noble, A., Mirzabaev, A., Aw-Hassan, A., & Qadir, M. (2010). Optimizing the rate and timing of phosphogypsum application to magnesium-affected soils for crop yield and water productivity enhancement. Agricultural, Water Management, 97, 1277-1286.

This work is licensed under a Creative Commons Attribution 4.0 International License.
![]()
A New Edition of Web of Science
Journal Impact Factor
2022: 0.5
Five Year: 0.8
Journal is Indexed in

Cabells Whitelist
![]()


