Synthesis, Spectral Characterization and Computational Studies of Metal Chelates of 4-N-(2-Thienylidene)aminoantipyrine
Sherifa Rahim1, Arsha Antony1, George Lukose2,*, K. Mohanan3, I. Hubert Joe4 and R. Selwin Joseyphus2
1Department of Chemistry, St. John`s College, Anchal, Kollam-691 306, Kerala, India
2Department of Chemistry, Mar Ivanios College (Autonomous), Thiruvananthapuram-69501, Kerala, India
3Department of Chemistry, University of Kerala, Trivandrum-695 581, Kerala, India
4Department of Physics, Mar Ivanios College (Autonomous), Thiruvananthapuram-695015, Kerala, India
Corresponding Author. Email georgelukoseanchal@gmail.com
DOI : http://dx.doi.org/10.13005/ojc/310412
Article Received on :
Article Accepted on :
Article Published : 11 Nov 2015
Metal chelates of Schiff base derived from thiophene-2-aldehyde with 4-aminoantipyrine have been synthesized. The ligand and the complexes have been characterized by IR, molar conductance, magnetic moments, EPR, cyclic voltammetry, XRD and SEM measurements. Computational studies were also carried out. The geometry of the complexes was investigated by electronic spectral data and magnetic moment measurements. The metal complexes exhibit higher antibacterial activity than the free ligand.
KEYWORDS:Schiff base; IR; XRD; antibacterial activity
Download this article as:| Copy the following to cite this article: Rahim S, Antony A, Lukose G, Mohanan K, Joe I. H, Joseyphus R. S. Synthesis, Spectral Characterization and Computational Studies of Metal Chelates of 4-N-(2-Thienylidene)aminoantipyrine. Orient J Chem 2015;31(4). |
| Copy the following to cite this URL: Rahim S, Antony A, Lukose G, Mohanan K, Joe I. H, Joseyphus R. S. Synthesis, Spectral Characterization and Computational Studies of Metal Chelates of 4-N-(2-Thienylidene)aminoantipyrine. Orient J Chem 2015;31(4). Available from: http://www.orientjchem.org/?p=12590 |
Introduction
Heterocyclic Schiff bases are related to first row transition elements is beyond the ambit of our imagination. However, multidenadate Schiff bases have been widely used as ligands, because they can easily attach to metal ions due to the formation of high stability coordination compounds. Metal complexes of S, N and O containing ligands have attracted considerable attention because of their interesting physico-chemical properties and pounced biological actions. Schiff bases and their transition metal complexes have been used as anticancer, antitubercular, hypertensive, antibacterial and antifungal reagents 1-3. Transition metal complexes are used as catalyst for many organic reactions 4,5. Very few metal complexes of Schiff bases derived from thiophene-2-carboxaldehyde have been reported. One of the most important DNA related activity of the metal complexes is that some of the complexes showed the ability to cleave DNA activity. The interaction of transition metal complexes with DNA structure have been extensively studied for their usage as probes for DNA structure and their potential application, in chemotherapy. Copper(II) complexes have been reported to be active in DNA strand scission 6-8. Antipyrine and its derivatives has been a subject of numerous investigations due to their diverse biological activities 6-8. Thiophene derivative compounds exhibit a variety of biological activities broadening from antitumour, antibacterial, antifungal, anti-inflammatory and antiviral activities 9. Literature survey indicates that both the antipyrine and thiophene-2-carboxaldehyde are versatile moieties having various biological applications. Schiff base was formed by the condensation of thiophene-2-aldehyde and 4-aminoantipyrine namely 4-N-(2-thienylidene)aminoantipyrine (TAA), act as a neutral tridentate ligand. The structural characterization was studied by various spectral studies.
Material and Methods
Materials
The chemicals used for synthesis in this study were of A.R. grades (E-Merck). The solvents were purified by standard methods given by Weissbarger 10.
Physical Measurements
Elemental analysis (C, H, N) was obtained using Perkin Elmer elemental analyzer. The purity of ligand and the metal complexes were tested by TLC. Molar conductance measurements were carried out with 10-3 M solutions of the complexes in appropriate solvents at room temperature using a Systronics direct reading digital conductivity meter. Magnetic susceptibility measurements of complexes were measured at room temperature using a Magway MSB Mk1 susceptibility balance. The measurements were made with solid specimens. The standard used was Hg[Co(NCS)4] and diamagnetic corrections were carried out using Pascal’s constants. The infrared spectra of the compounds were recorded using Shimadzu 8201 PC FT infrared spectrophotometer and Perkin Elmer 817 infrared spectrophotometer. Far IR spectra were recorded at room temperature in the solid state on a Polytec FIR 30 Fourier spectrophometer using CsI discs. Electronic spectra of the complexes were recorded in suitable solvents in the range of 250-900 mm, using a Shimadzu 1601 UV-Visible spectrophotometer and a Hitachi 320 UV-Visible spectrometer. Electrochemical behaviour was studied with the help of a BAS CV-50 analyser employing glassy carbon as working electrode, Ag/AgCl as reference electrode and platinum wire as auxiliary electrode. The working media consisted of DMSO and Bu4NPF6 as supporting electrolyte. The X-ray diffraction pattern was carried out on a Siemens D 5005 model X-ray Spectrometer. Copper X-ray tubes, for which the wavelength of the strongest radiation (kα1) is approximately (Cu=1.54 Ǻ) is used for the diffraction study. Antibacterial activities of ligands and their complexes have been carried out by agar diffusion method.
Synthesis of ligand (TAA)
4-Aminoantipyrine (1 mmol) was dissolved in methanol (30 mL) to this thiophene-2-carboxaldehyde (1 mmol) dissolved in methanol (25 mL) was added slowly with constant stirring. The mixture was then refluxed on a water bath for 3 h. It was concentrated to about half of its original volume, cooled and allowed to crystallize and dried in vacuum. It was further purified by recrystallization from ethanol. Glittering crystals having orange-red colour was obtained.
Synthesis of Metal Complexes
Manganese(II) complex
Manganese(II) complex was prepared by a similar procedure adopted for the preparation of copper(II) complex, expect that the refluxing time used was about 5 h and metal: ligand ratio maintained was 1:2. The pH of the solution was adjusted to 6.5 using 1:1 alcoholic ammonia solution. The metal complex separated was filtered washed with ethanol and then dried in vacuum.
Cobalt(II) complex
This complex was also prepared in a similar manner as that of copper(II) complex, but the reaction mixture was refluxed for about 5 h to ensure completion of the reaction. The pH of the solution was adjusted to ~6.5 using 1:1 alcoholic ammonia solution. The metal-ligand ratio was 1:2 and the dark brown solid that crystallized on cooling, washed and filtered and dried in vacuum.
Nickel(II) complex
Nickel(II) complex was also prepared by adopting the procedure for the synthesis of cobalt(II) complex expect that the pH maintained was ~6.5. On adding the metal salt the ligand solution turned yellowish green. The reaction mixture was refluxed for about 3 h. The product obtained was filtered, washed with ethanol and dried in vacuum.
Copper(II) complex
The ligand, (5 mmol) dissolved in methanol (30 mL) was heated gently on a water-bath. Metal(II) chloride (5 mmol) dissolved in methanol (20 mL) was added. The pH of the mixture was adjusted to ~6.5, using 1:1 alcoholic ammonia solution. This solution was refluxed on the water-bath for about 4 h to ensure the completion of the reaction. The volume of the solution was then reduced to half of its initial volume. The brown product formed was filtered, washed with ethanol and dried in vacuum.
Zinc(II) complex
Methanolic solution of zinc(II) chloride was added gradually in small amounts with shaking to a hot methanolic solution of the ligand maintaining the metal-ligand ratio as 1:1. Care was taken to avoid the formation of metal hydroxide while adding the salt solution to the ligand solution. The reaction mixture was refluxed for 3 h and pH was maintained to ~6.5 and further refluxed for about 6 h. The complex obtained was filtered, washed with ethanol and dried in vacuum.
Results and Discussion
The elemental analysis and other details of the ligand and its metal complexes are tabulated in Table 1. All of them are insoluble in common organic solvents expect DMSO and DMF. Purity of the ligand and its complexes has been checked by TLC. Formation of
the complexes can be represented as follows: MCl2 + TAA → [M(TAA)Cl]Cl
MCl2 + 2TAA → [M(TAA)2]Cl2 [M= Mn(II),Co(II),Ni(II),Cu(II),Zn(II)]
Formulation of these complexes has been done on the basis of their elemental analytical data, molar conductance and magnetic susceptibility measurements. Analytical data indicated that condensation of thiophene-2-carboxaldehyde with 4-aminoantipyrine in metal complexes occurred in 1:1 and 1:2 molar ratios.
Table 1: The elemental analysis and other details of the TAA and its complexes.
|
Yield (%) |
Elemental analysis (%) |
Ωm(Ω-1cm2mol-1)DMSO | µeff(BM) | ||||
| C | H | N |
M |
||||
| TAA | 87 | 64.62(64.60) | 5.08(5.13) | 14.13(14.34) | – | – | – |
| [Mn(TAA)2]Cl2 | 68 | 53.34(53.42) | 4.20(4.13) | 11.66(12.88) | 7.62(7.66) | 116.4 | 5.97 |
| [Co(TAA)2]Cl2 | 63 | 53.04(53.24) | 4.17(4.42) | 11.60(12.52) | 8.13(8.23) | 117 | 4.82 |
| [Ni(TAA)Cl]Cl | 62 | 45.01(45.11) | 3.54(3.27) | 9.84(9.94) | 13.75(13.76) | 66.0 | D |
| [Cu(TAA)Cl]Cl | 67 | 44.50(44.40) | 3.50(3.43) | 9.73(9.37) | 14.72(14.88) | 54.5 | 1.91 |
| [Zn(TAA)Cl]Cl | 64 | 44.31(44.20) | 3.49(3.21) | 9.69(9.82) | 15.08(15.11) | 54.2 | D |
Optimized geometry
Density functional theory (DFT) method has been proved to be extremely useful in treating electronic structures of molecules. The quantum chemical computations of the molecule has been performed using Gaussian 09W program package 11 at the Becke3-Lee-Yang-Parr(B3LYP) level with the standard 6-31G(d) basis set. The optimized geometry corresponding to the minimum on the potential energy surface has been obtained by solving self-consistent field equation iteratively. The isolated molecule is considered in gas phase in the theoretical calculation; while many packing molecules are treated in condensed phase in the experimental measurement theoretically predicted optimized geometrical parameters of the studied ligand were listed in Table 2. The bond length of N4-C6 and N5-C18 shows increased bond length than the other C-N bond, which indicates the fairly large pi-electronic conjugated system. The C13-H34….O17 (2.10 Å) distances are slightly shorter than that of the Van der Waals separation between the O atom and the H atom indicating the existence of the C–H…..O interaction in TAA. Due to the presence of intramolecular H-bonding, the C–H bond lengths are very different in TAA molecule. The hydrogen bond would stabilize the ground state molecule. Most of the bond angles are almost equal having the value (=120º), and the remaining part of the molecule connected with the atom C14 are slightly deviated from the normal value which evident the possibility of the presence of electronic effect.
Natural bond orbital analysis
The Natural Bond Orbital (NBO) calculation was performed using NBO 5.0 program implemented in the Gaussian 09W program package at the DFT/B3LYP level in order to understand various second order interactions between the filled orbitals of one sub system and vacant orbitals of another sub systems, which is a measure of the delocalizationor hyper conjugation. In order to obtain a more complete picture of the electronic structure of the molecules in the TAA crystal (Table 3), the natural orbital interactions were analyzed12. The lowering of orbital energy due to the interaction between doubly occupied orbitals and unoccupied ones is a very convenient guide to interpret the molecular structure in the electronic point of view.
In energetic terms, hyperconjugation is an important effect 13,12 in which an occupied Lewis-type natural bond orbital is stabilized by overlapping with a non-Lewis type orbital (either one-center Rydberg or two-center antibonding NBO). This electron delocalization can be described as a charge transfer from a Lewis valence orbital (donor) with a decreasing of its occupancy, to a non-Lewis orbital (acceptor). The NBO 12analysis is already proved to be an effective tool for chemical interpretation of hyperconjugative interaction and electron density transfer from the filled lone pair electron. The hyper-conjugative interaction energy was deduced from the second-order perturbation approach.
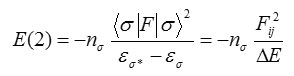
where <σ|F|σ2, or F2ij is the Fock matrix element between i and j NBO orbitals, εσ and εσ* are the energies of σ and σ* NBO’s, and nσ is the population of the donor s orbital. NBO theory can also be used to identify hydrogen bonding.
Among the most energetic donor–acceptor NBO interactions are those involving the p-type lone pair of the sulphur atom, LP2S36→π*(C29-C31), LP2S36→π*(C30-C32) antibonds having hyperconjugation energy contribution 23.18 and 20.03 kcalmol-1 respectively, these low ED values (0.33624 and 0.27125 e) reveals intramolecular charge delocalization. The intramolecular hyperconjugative interactions are formed by the orbital overlap between π(C8-C11) and π*(C6-C7) bond orbitals which results intramolecular charge transfer causing stabilization of the system. These interactions are observed as an increase in electron density in C-C antibonding orbital that weakens the respective bonds.
The strong intramolecular hyperconjugative interaction of π* electrons from (C6-C7) bonds to the π*(C8-C11) bond increases ED at the six conjugated π bonds (≈ 0.39 e), leading to stabilization of 214.62 kcal/mol-1. The magnitude of charges transferred from lone pair LP(2)O17→σ*(C3-N4), LP(1)N5→π*(C1-C2), and LP(1)N26→π*(C3-O17) shows that stabilization energy of about 30.85, 22.97 and 42.01 kcal/mol respectively, which clearly manifests the evidence for the elongation as well as weakening the bonds ring in the acetate group.
Table 2: Optimized geometrical parameters of TAA in B3LYP /6-31G(d,p) level
|
Bond length (Å) |
Bond angle (°) |
Dihedral angle (°) |
||||||||||||
|
Parameter |
Calcd. |
Parameter |
Calcd. |
Parameter |
Calcd. |
|||||||||
|
C1-C2 |
1.3699 |
C2-C1-N5 |
111.01 |
N5-C1-C2-C3 |
-6.38 |
|||||||||
|
C1-N5 |
1.3936 |
C2-C1-C22 |
127.29 |
N5-C1-C2-N26 |
-177.34 |
|||||||||
|
C1-C22 |
1.4921 |
N5-C1-C22 |
121.70 |
C22-C1-C2-C3 |
174.24 |
|||||||||
|
C2-C3 |
1.4648 |
C1-C2-C3 |
107.52 |
C22-C1-C2-N26 |
3.28 |
|||||||||
|
C2-N26 |
1.3915 |
C1-C2-N26 |
122.76 |
C2-C1-N5-N4 |
8.79 |
|||||||||
|
C3-N4 |
1.4136 |
C3-C2-N26 |
128.98 |
C2-C1-N5-C18 |
137.71 |
|||||||||
|
C3-O17 |
1.2285 |
C2-C3-N4 |
104.79 |
C22-C1-N5-N4 |
-171.79 |
|||||||||
|
N4-N5 |
1.4131 |
C2-C3-O17 |
131.09 |
C22-C1-N5-C18 |
-42.86 |
|||||||||
|
N4-C6 |
1.4203 |
N4-C3-O17 |
124.12 |
C2-C1-C22-H23 |
-122.86 |
|||||||||
|
N5-C18 |
1.4700 |
C3-N4-N5 |
110.13 |
C2-C1-C22-H24 |
-3.36 |
|||||||||
|
C6-C7 |
1.4015 |
C3-N4-C6 |
123.70 |
C2-C1-C22-H25 |
116.29 |
|||||||||
|
C6-C8 |
1.4016 |
N5-N4-C6 |
119.18 |
N5-C1-C22-H23 |
57.81 |
|||||||||
|
C7-C9 |
1.3947 |
C1-N5-N4 |
105.83 |
N5-C1-C22-H24 |
177.32 |
|||||||||
|
C7-H10 |
1.0849 |
C1-N5-C18 |
118.47 |
N5-C1-C22-H25 |
-63.03 |
|||||||||
|
C8-C11 |
1.3936 |
N4-N5-C18 |
113.67 |
C1-C2-C3-N4 |
1.32 |
|||||||||
|
C8-H12 |
1.0824 |
N4-C6-C7 |
120.92 |
C1-C2-C3-O17 |
-179.61 |
|||||||||
|
C9-C13 |
1.3954 |
N4-C6-C8 |
118.96 |
N26-C2-C3-N4 |
171.54 |
|||||||||
|
C9-H14 |
1.0868 |
C7-C6-C8 |
120.12 |
N26-C2-C3-O17 |
-9.39 |
|||||||||
|
C11-C13 |
1.3966 |
C6-C7-C9 |
119.73 |
C1-C2-N26-C27 |
-133.4 |
|||||||||
|
C11-H15 |
1.0866 |
C6-C7-H10 |
119.54 |
C3-C2-N26-C27 |
57.71 |
|||||||||
|
C13-H16 |
1.0863 |
C9-C7-H10 |
120.72 |
C2-C3-N4-N5 |
4.08 |
|||||||||
|
C18-H19 |
1.0984 |
C6-C8-C11 |
119.42 |
C2-C3-N4-C6 |
154.37 |
|||||||||
|
C18-H20 |
1.0915 |
C6-C8-H12 |
119.49 |
O17-C3-N4-N5 |
-175.08 |
|||||||||
|
C18-H21 |
1.0908 |
C11-C8-H12 |
121.08 |
O17-C3-N4-C6 |
-24.78 |
|||||||||
|
C22-H23 |
1.0967 |
C7-C9-C13 |
120.47 |
C3-N4-N5-C1 |
-7.84 |
|||||||||
|
C22-H24 |
1.0922 |
C7-C9-H14 |
119.32 |
C3-N4-N5-C18 |
-139.53 |
|||||||||
|
C22-H25 |
1.0972 |
C13-C9-H14 |
120.21 |
C6-N4-N5-C1 |
-159.67 |
|||||||||
|
N26-C27 |
1.283 |
C8-C11-C13 |
120.79 |
C6-N4-N5-C18 |
68.64 |
|||||||||
|
C27-H28 |
1.0959 |
C8-C11-H15 |
119.15 |
C3-N4-C6-C7 |
-126.78 |
|||||||||
|
C27-C29 |
1.4703 |
C13-C11-H15 |
120.05 |
C3-N4-C6-C8 |
53.23 |
|||||||||
|
C29-C30 |
1.4422 |
C9-C13-C11 |
119.46 |
N5-N4-C6-C7 |
21.03 |
|||||||||
|
C29-C31 |
1.3793 |
C9-C13-H16 |
120.26 |
N5-N4-C6-C8 |
-158.97 |
|||||||||
|
C30-C32 |
1.362 |
C11-C13-H16 |
120.28 |
C1-N5-C18-H19 |
-60.62 |
|||||||||
|
C30-H33 |
1.0855 |
N5-C18-H19 |
111.88 |
C1-N5-C18-H20 |
60.61 |
|||||||||
|
C31-H34 |
1.0801 |
N5-C18-H20 |
108.37 |
C1-N5-C18-H21 |
178.4 |
|||||||||
|
C31-S36 |
1.7248 |
N5-C18-H21 |
108.89 |
N4-N5-C18-H19 |
64.57 |
|||||||||
|
C32-H35 |
1.0816 |
H19-C18-H20 |
109.83 |
N4-N5-C18-H20 |
-174.19 |
|||||||||
|
C32-S36 |
1.738 |
H19-C18-H21 |
109.34 |
N4-N5-C18-H21 |
-56.4 |
|||||||||
|
H20-C18-H21 |
108.46 |
N4-C6-C7-C9 |
-179.18 |
|||||||||||
|
C1-C22-H23 |
112.03 |
N4-C6-C7-H10 |
1.97 |
|||||||||||
|
C1-C22-H24 |
108.41 |
C8-C6-C7-C9 |
0.82 |
|||||||||||
|
C1-C22-H25 |
111.76 |
C8-C6-C7-H10 |
-178.04 |
|||||||||||
|
H23-C22-H24 |
108.34 |
N4-C6-C8-C11 |
-179.79 |
|||||||||||
|
H23-C22-H25 |
107.6 |
N4-C6-C8-H12 |
-0.84 |
|||||||||||
|
H24-C22-H25 |
108.59 |
C7-C6-C8-C11 |
0.21 |
|||||||||||
|
C2-N26-C27 |
128.22 |
C7-C6-C8-H12 |
179.16 |
|||||||||||
|
N26-C27-H28 |
113.25 |
C6-C7-C9-C13 |
-1.03 |
|||||||||||
|
N26-C27-C29 |
134.7 |
C6-C7-C9-H14 |
179.85 |
|||||||||||
|
H28-C27-C29 |
111.83 |
H10-C7-C9-C13 |
177.81 |
|||||||||||
|
C27-C29-C30 |
118.78 |
H10-C7-C9-H14 |
-1.31 |
|||||||||||
|
C27-C29-C31 |
129.72 |
C6-C8-C11-C13 |
-1.05 |
|||||||||||
|
C30-C29-C31 |
111.49 |
C6-C8-C11-H15 |
179.57 |
|||||||||||
|
C29-C30-C32 |
113.51 |
H12-C8-C11-C13 |
-179.98 |
|||||||||||
|
C29-C30-H33 |
123.01 |
H12-C8-C11-H15 |
0.64 |
|||||||||||
|
C32-C30-H33 |
123.47 |
C7-C9-C13-C11 |
0.2 |
H28-C27-C29-C31 |
162.39 |
|||||||||
|
C29-C31-H34 |
127.59 |
C7-C9-C13-H16 |
-179.62 |
C30-C32-S36-C31 |
0.72 |
|||||||||
|
C29-C31-S36 |
111.92 |
H14-C9-C13-C11 |
179.31 |
C31-C29-C30-C32 |
0.75 |
|||||||||
|
H34-C31-S36 |
120.13 |
H14-C9-C13-H16 |
-0.51 |
C31-C29-C30-H33 |
179.8 |
|||||||||
|
C30-C32-H35 |
128.49 |
C8-C11-C13-C9 |
0.85 |
C27-C29-C31-H34 |
-8.37 |
|||||||||
|
C30-C32-S36 |
111.06 |
C8-C11-C13-H16 |
-179.33 |
C27-C29-C31-S36 |
178.63 |
|||||||||
|
H35-C32-S36 |
120.46 |
H15-C11-C13-C9 |
-179.78 |
C30-C29-C31-H34 |
172.81 |
|||||||||
|
C31-S36-C32 |
92.01 |
H15-C11-C13-H16 |
0.05 |
C30-C29-C31-S36 |
-0.19 |
|||||||||
|
C2-N26-C27-H28 |
179.67 |
C29-C30-C32-H35 |
178.98 |
|||||||||||
|
C2-N26-C27-C29 |
5.57 |
C29-C30-C32-S36 |
-0.96 |
|||||||||||
|
N26-C27-C29-C30 |
155.3 |
H33-C30-C32-H35 |
-0.06 |
|||||||||||
|
N26-C27-C29-C31 |
-23.44 |
H33-C30-C32-S36 |
180 |
|||||||||||
|
C27-C29-C30-C32 |
-178.21 |
C29-C31-S36-C32 |
-0.29 |
|||||||||||
|
C27-C29-C30-H33 |
0.84 |
H34-C31-S36-C32 |
-173.88 |
|||||||||||
|
H28-C27-C29-C30 |
-18.87 |
H35-C32-S36-C31 |
-179.23 |
|||||||||||
Table 3: Selected second-order perturbation energies → E(2) donor acceptor.
|
Donor |
ED |
Acceptor |
ED |
E(2) kcal/mol |
E(j)-E(i) a.u. |
F(i,j) a.u. |
| LP(2)S36 | 1.61082 | π*(C29-C31) | 0.33624 | 23.18 | 0.27 | 0.072 |
| π*(C30-C32) | 0.27125 | 20.03 | 0.27 | 0.067 | ||
| LP(2)O17 | 1.84343 | σ*( C2-C3) | 0.07905 | 18.46 | 0.70 | 0.104 |
| σ*(C3-N4) | 0.10192 | 30.85 | 0.64 | 0.127 | ||
| LP(1)N4 | 1.68758 | π*(C6-C7) | 0.39384 | 19.41 | 0.31 | 0.071 |
| π*(C3-O17) | 0.40679 | 42.01 | 0.30 | 0.103 | ||
| LP(1)N26 | 1.86179 | σ*(C27-C29) | 0.04948 | 15.25 | 0.79 | 0.100 |
| LP(1)N5 | 1.76334 | π*(C1-C2) | 0.28715 | 22.97 | 0.36 | 0.082 |
| π(C8-C11) | 1.66710 | π*(C9-C13) | 0.33923 | 19.83 | 0.28 | 0.067 |
| π(C8-C11) | 1.66710 | π*(C6-C7) | 0.39384 | 21.46 | 0.27 | 0.069 |
| π(C6-C7) | 1.66766 | π*(C9-C13) | 0.33923 | 20.39 | 0.29 | 0.069 |
| π (C1-C2) | 1.79475 | π*(C3-O17) | 0.40679 | 26.87 | 0.29 | 0.083 |
| π (C9-C13) | 1.66735 | π*(C8-C11) | 0.31882 | 20.51 | 0.29 | 0.069 |
| π(C6-C7) | 1.66766 | π*(C8-C11) | 0.31882 | 18.22 | 0.30 | 0.066 |
| π(C29-C31) | 1.80734 | π *(C30-C32) | 0.27125 | 16.94 | 0.29 | 0.063 |
| π(C29-C31) | 1.80734 | π *(N26-C27) | 0.15383 | 15.87 | 0.31 | 0.063 |
| π (C29-C31) | 1.80734 | π*(N26-C27) | 0.15383 | 15.87 | 0.31 | 0.063 |
| π (C30-C32) | 1.89124 | π*(C29-C31) | 0.33624 | 13.83 | 0.30 | 0.061 |
+ED Electron density
E(2) means energy of hyperconjugative interactions (stabilization energy)
E(j)-E(i) Energy difference between donor and acceptor i and j NBO orbitals
F(i, j) is the Fock matrix element between i and j NBO orbitals
HOMO and LUMO analysis
Frontier molecular orbitals play an important role in the optical and electronic properties. The HOMO represents the ability to donate an electron where LUMO as electron acceptors represents the ability to obtain the electron and the energy gap between the HOMO and LUMO characterizes the molecular chemical stability and chemical activity of the molecule (Fig. 1). HOMO – LUMO energy gap of the molecule is found to be 5.4919eV. The optimized structure of TAA in B3LYP/6-31G(d,p) is shown in Fig. 2.
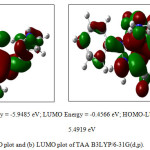 |
Figure 1: (a) HOMO plot and (b) LUMO plot of TAA B3LYP/6-31G(d,p). |
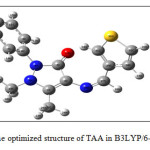 |
Figure 2: The optimized structure of TAA in B3LYP/6-31G(d,p). |
Characterization of ligand
The ligand as well as the complexes are intensively coloured and many of the useful bands are masked in the following absorption maxima in DMSO. The n→π* transition at 25,060 cm-1 and π→π* transition at 30,610 cm-1 on complexation to the n→π* transition is slightly red-shifted to 28,730 cm-1. The π→π* transition is red-shifted to 34,970 cm-1.
Infrared spectrum of the ligand recorded in KBr, exhibited an intense band at 1657 cm-1 which can be attributed to >C=O group of the pyrozolone ring. A medium intensity band appearing at 1590 cm-1 may be due to the >C=N group 12. Also the ring stretching band at 1425 cm-1 and the C-H bending band at 1217 cm-1 are due the thiophene moiety in the ligand.
The 1H NMR spectrum of the ligand, TAA recorded in DMSO-d6 is shown in Fig. 3. In the spectrum peaks ranging from 7.01-7.81 ppm are assignable to the aromatic ring protons. The aldehydic proton is observed at 8.4 ppm and the peak corresponding to C-CH3 and N-CH3 are observed at 2.80 and 3.4 ppm respectively.
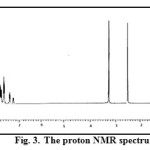 |
Figure 3: The proton NMR spectrum of TAA. Click here to View figure |
Structure of metal chelates
All the complexes are coloured except the zinc(II) complex. The complexes are insoluble in water but soluble in some organic solvents such as DMF and DMSO. Copper(II), nickel(II) and zinc(II) formed 1:1 complexes whereas manganese(II) and cobalt(II) formed 1:2 complexes. Both complexes were found to be electrolytic in nature. The former type of cationic complexes exhibited molar conductance in the range 54-66 ohm-1cm2mol-1 as expected for 1:1 electrolytic species in DMSO and the latter type in the range 86-87 ohm-1cm2mol-1 as expected for 1:2 electrolyte 14.
1H NMR spectrum
The 1H NMR spectrum of the zinc(II) complex the aromatic protons observed in the range 6.81-7.81 were slightly shifted by about 0.1-0.2 ppm. 1H NMR spectrum of complex is shown in Fig. 4. When compared to that of the free ligand, same type of shift is noticed in the case of C-CH3 and N-CH3 proton.
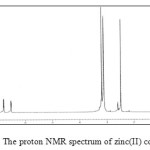 |
Figure 4: The proton NMR spectrum of zinc(II) complex. |
Infrared Spectra
The infrared spectral data of the metal complexes are given in the Table 4 along with the tentative assignments. The >C=O stretching frequency 1657 cm-1 is shifted to ~40 cm-1 indicating the coordination of the carbonyl oxygen. The band at 1590 cm-1,which is assigned to azomethine group, shifted to ~25 cm-1 in the complexes indicating the coordination of azomethine nitrogen. Also the ring stretching band at 1425 cm-1 and the C-H band at 1217 cm-1, due to thiophene in the TAA are shifted to 1410 and 1210 cm-1 respectively in the complexes indicate the coordination of the thiophene sulphur. The complexes showed new stretching bands15 occurred in the region at 510-530, 410-420, 331-340 and 310-320 cm-1 which are assigned to ν(M-O), ν(M-N), ν(M-S) and ν(M-Cl) vibrations respectively. The IR spectral data indicate that the ligand, TAA behave as tridentate with ONS donor sites and coordinated to the metal ions via azomethine nitrogen, carbonyl oxygen and thiophene sulphur atom.
Table 4: Infrared spectral bands of the ligand and its metal complexes (cm-1).
| Compound | ν(C=N) | ν(C=O) | ν(C-S)thiophenering | ν(M-O) | ν(M-N) | ν(M-Cl) | (M-S) |
| TAA | 1590 | 1657 | 1425 | – | – | – | – |
| [Mn(TAA)2]Cl2 | 1566 | 1615 | 1410 | 510 | 410 | – | 331 |
| [Co(TAA)2]Cl2 | 1565 | 1614 | 1416 | 522 | 420 | – | 340 |
| [Ni(TAA)Cl]Cl | 1561 | 1617 | 1412 | 515 | 417 | 319 | 338 |
| [Cu(TAA)Cl]Cl | 1568 | 1618 | 1416 | 525 | 411 | 313 | 333 |
| [Zn(TAA)Cl]Cl | 1567 | 1620 | 1413 | 530 | 421 | 311 | 336 |
Electronic spectra and magnetic studies
The diffused reflectance spectrum of the manganese(II) complex shows three bands at 21,739 – 21,980 cm-1 assignable to 6A1g → 4T1g, 6A1g → 4T2g and 6A1g → 4Eg transitions respectively. The magnetic moment value is found to be 5.97 BM which indicates an octahedral structure 15. The cobalt(II) complex shows three bands at 13,077, 16,651 and 21,903 cm-1. The band at 27,027 cm-1 refer to the charge-transfer band in the cobalt(II) complex. The bands observed are assigned to the transitions 4T1g(F)→4T2g(F), 4T1g(F)→4A2g(F) and 4T1g(F)→4T2g(P) respectively suggesting that there is an octahedral geometry around cobalt(II) ion. The magnetic moment value is found to be 4.82 BM is an indicative of octahedral geometry. The nickel(II) complex showed diamagnetic nature at room temperature supporting the square planar geometry. The copper(II) complex exhibits broad band centred ~13,513 cm-1 which can be assigned to 2B2g →2A1g transition. This transition along with the magnetic moment value of 1.91 BM suggest a distorted square planar geometry for copper(II) complex. The completely filled d orbital in zinc(II) complex and the absence of LFSE values are mainly responsible for the less extensive coordination chemistry of zinc(II). The zinc(II) complex is diamagnetic and according to the empirical formulae of this complex, a tetrahedral geometry is proposed.
EPR spectrum
The X-band EPR spectrum of copper(II) complex has been recorded in the solid state at room temperature and in DMSO at 77 K using DPPH as the ‘g’ marker. The EPR spectrum of the copper(II) complex at room temperature shows one intense absorption band in the high field and is isotropic due to the tumbling motion of the molecules. However, this complex at liquid nitrogen temperature showed well-resolved peaks with low intensities in the low field region and one intense peak in the high field region. From EPR data, various Hamiltonian parameters have been calculated for this complex (g||= 2.19, g^= 2.05, A|| = 150). It has been reported that g|| value of copper(II) complex can be used as a measure of the covalent character of the metal–ligand bond. If the value is more than 2.3, the metal–ligand bond is essentially ionic and the value less than 2.3 is indicative of covalent character16. Apart from this, the covalency parameter (α2) has been calculated using Kivelson and Neiman equation. The α2 value of 0.66 indicates considerable covalent character for the metal–ligand bond17. Also the trend g||>g^>ge observed for this complex indicated that the unpaired electron is most likely in the orbital. The empirical ratio g||/A|| is frequently used to evaluate distortions in tetra coordinated copper(II) complexes. The degree of geometrical distortion was ascertained by the parameter g||/A|| with the values less than 140 cm-1 associated with the square-planar structures, whereas higher values indicate distortion towards tetrahedron 18. For the present copper complexes, the g||/A|| value is 125 cm-1 in agreement with significant deviation from planarity. Based on these observations, a distorted square planar geometry is proposed for copper(II) complex.
Cyclic voltammetry
The electrochemical behaviour was examined by employing glassy carbon as the working electrode, Ag/AgCl as the reference electrode and platinum wire as the auxiliary electrode. The working media consisted of DMSO and Bu4NPF6 as supporting electrolyte. The measurements were carried out at room temperature in the potential range -2.0 to +2.0 V with a scan rate 40, 80 and 120 V/sec. The CV profile of (a) TAA and (b) [Cu(TAA)Cl]Cl are given in Fig. 5.
![Fig. 5: The CV of (a) ligand and (b) [Cu(TAA)Cl]Cl complex.](http://www.orientjchem.org/wp-content/uploads/2015/11/Vol31_No4_Synt_HUB_Fig5-150x150.jpg) |
Figure 5: The CV of (a) ligand and (b) [Cu(TAA)Cl]Cl complex. Click here to View figure |
The choice of the scan rate depends on the life time of the electro active species. In general the fate of an electroactive species produced in the forward scan is probed in the backward scan which helps to find whether the equilibrium is reversible, quasireversible or irreversible. A redox couple in which both the species exchange electrons with the working electrode is termed an electrochemically reversible couple. The number of electrons (n) transferred in the electrode reaction for are reversible couple can be determined from the separations between peak potentials i.e, ∆Ep = Epa – Epc = 0.059/nV (25 °C) where Epa is the anodic peak potential and Epc is the cathodic peak potential.For a one electron process, ∆Ep is ~0.059 V similarly for a reversible couple the ratio of anodic to cathodic peak current (ipa/ipc ) approaches one for all scan rates. The following results were obtained from the cyclic voltammogram for the ligand and its complex in the present investigation. In the voltammogram obtained for the ligand, a broad irreversible single electron responds was identified at -0.65 V, which is due to the reduction of the ligand. The single electron reversible couple identified at Epa 0.065 V and Epc = -0.012 V in the voltammogram of the complex may assigned to metal-centered Cu(II)/Cu(I) couple. At slower scan rate the peak separation (∆Ep) is close to 59 mev, indicating that the number of electron transferred is one (n = 1). It was also noted that the ratio of the anodic to cathodic peak current (ipa/ipc) approaches one at this scan rate. The electro chemical process is diffusion controlled the decomplexation and copper metal deposition on the electrode are not involved. From the above voltammetric data electron transfer process can be schematically represented as [CuII(TAA)Cl]Cl + 1e- → [CuI (TAA)Cl] + Cl–
Powder XRD
The X-ray diffractogram of the ligand exhibited 15 reflections between 2θ ranging from 5o to 60o with reflection maxima at 11.070o, which corresponds to an interplanar distance 7.9858 Å. The ligand has been successfully indexed to a tetragonal crystal system 19,20. The lattice constants have been calculated to be a=b=5.9416 Å and c = 6.9667 Å with a unit cell volume 246.6487 Å3 The XRD pattern of the nickel(II) complex also indicates crystallinity. The XRD pattern indicates the crystallinity of the TAA as well as nickel(II) complex. The observed Sin2θ values obtained has been compared with the calculated Sin2θ values. The lattice constant parameters are a = 10.3462 Ǻ, b = 6.9821 Ǻ, c = 4.2851 Ǻ and unit cell volume of 303.5378 Ǻ. The observed value of the complex fit well with the orthorhombic crystal system. The grain size of the ligand and its nickel(II) complex was calculated by Debye Scherer’s formula. The average grain sizes of these samples are found to be 65 and 87 nm respectively indicating that both exist in nanocrystalline phase. Single crystals of the metal complexes could not be isolated from any solutions.
SEM
The surface morphology of the metal complexes was studied by SEM. The SEM micrographs of the complexes show morphological structure in presence of small grains in uniform size. The particles of the complexes were agglomerated with controlled morpholy. Again all the complexes exhibit similar type morphology with brone-like structures.
Antimicrobial activity
The in vitro antibacterial and antifungal assay of the ligand and the complexes have been carried out against some bacterial and fungal species. From the results (Table 5) it is concluded that the copper(II) complexes were found to be the most potent bactericides when compared with the other metal complexes. All the compounds were found to have maximum inhibitory activity against B. substilus. But it was detected that, all the complexes were weakly active against E. coli. The metal complexes are more active than ligand as they may serve as a vehicle for activation of ligands as principal cyctotoxic species. Thus, the relationship between chelation and antimicrobial toxicity is very complex and the differences are expected to be a function of steric, electronic, and pharmakinetic factors 21. The antibacterial results obtained evidently shows that the activity of the Schiff bases became more pronounced when co-ordinated with the metal ions.
Table 5: Antibacterial activities of TAA and its metal complexes.
| Compound |
Zone of inhibition (mm) |
||||
| E. coli | S. aureus | B. substilus | K. pneumoniae | S. typhi | |
| TAA |
12 |
10 |
16 |
15 |
14 |
| [Mn(TAA)2]Cl2 |
14 |
12 |
20 |
19 |
15 |
| [Co(TAA)2]Cl2 |
15 |
15 |
18 |
17 |
15 |
| [Ni(TAA)Cl]Cl |
14 |
14 |
20 |
18 |
16 |
| [Cu(TAA)Cl]Cl |
16 |
16 |
24 |
20 |
18 |
| [Zn(TAA)Cl]Cl |
15 |
17 |
25 |
22 |
18 |
| Standard |
38 |
38 |
38 |
38 |
38 |
Based on the above results of elemental analysis, IR, electronic spectra, conductivity and magnetic moment measurements indicate the assigned geometrical structure of the metal complexes is shown in Fig. 6.
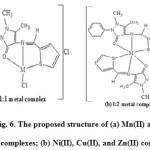 |
Figure 6: The proposed structure of (a) Mn(II) and Co(II) complexes; (b) Ni(II), Cu(II), and Zn(II) complexes. Click here to View figure |
Conclusion
Schiff base ligand obtained from the reaction of 4-aminoantipyrine and thiophene-2. Metal complexes have been synthesized using the Schiff base ligand and characterized by spectral and analytical data. Based on these data, an octahedral geometry for manganese(II) and cobalt(II) complexes whereas distorted square planar geometry for copper(II) complex has been assigned to the complexes except zinc complex which has tetrahedral geometry. A square planar geometry was proposed for nickel complex. The metal complexes have higher antimicrobial activity than the ligand.
References
- Stephens C.E., Felder T.M., Sowell J.W., Andrei G., Balzarini J., Snoeck R and Clercq De E., Bioorg. Med. Chem. 2001, 9, 1123.
- Faizul A., Satendra S., Lal K.S and Om P., J. Zhejiang Univ. Sci. B, 2007, 8, 446.
- Chohan Z.H., Arif M., Shafiq Z., Yaqub M and Supuran C.T., J. Enzyme Inhib. Med. Chem. 2006, 21, 95.
- Fenton D.E., Biocoordination Chemistry, Oxford University Press, Tokyo, 1995.
- Liu J., Huang J.W., Fu B., Zhao P., Yu H.C and Ji L.N., Spectrochim. Acta A, 2007, 67, 391.
- Nair M.K.H and Radhakrishnan P.K., Thermo. Chim. Acta, 1997, 292, 115.
- Parekh H.M and Patel M.N., Russ. J. Coord. Chem. 2006, 32, 431.
- Thangadurai T.D and Natarajan K., Transition Met. Chem. 2000, 25, 347.
- Bagihalli G.B., Patil S.A and Badami P.S., J. Iran. Chem. Soc. 2009, 6,259.
- Weissberger A., Proskauer P.S., Hiddick J.A and Troops B.E., Organic Solvents, Wiley Interscience, New York, 1956.
- Gaussian et al., Gaussian’09 Software, Inc., Wallingford, 2009.
- Glendening E.D., Badenhoop J. K., Reed A. E., Carpenter J. E., Bohmann J. A., Morales C.M & Weinhold F., NBO 5.0, Theoretical Chemistry Institute, University of Wisconsin, Madison, 2001.
- Weinhold F., Nature, 2001, 411, 539.
- Geary W.J., Coord. Chem. Rev., 1971, 7, 81.
- Nakamoto K., Infrared and Raman spectra of Inorganic and Coordination compounds.
- Kamalakannan P and Venkappayya D., Russ. J. Coord. Chem., 2002, 28, 423.
- Kivelson D and Neiman R., J. Chem. Phys., 1961, 35, 149.
- Daniel V.P., Murukan B., Kumari B.S and Mohanan K., Spectrochim. Acta A, 2008, 70, 403.
- Cullity B.D., Elements of X-ray diffraction, Addison Wisely Pub., Second Edn., 1978.
- D’Eye R.W.M and Wait E., X-ray Powder Photography in Inorganic Chemistry, London, Butterworth’s, 1960.
- Sönmez M., Levent A and Sekerci M., Russ. J. Coord. Chem., 2005, 30, 655.

This work is licensed under a Creative Commons Attribution 4.0 International License.
![]()
A New Edition of Web of Science
Journal Impact Factor
2022: 0.5
Five Year: 0.8
Journal is Indexed in

Cabells Whitelist
![]()


