Synthesis and characterization of lanthanum oxide and lanthanumoxid carbonate nanoparticles from thermolysis of [La(acacen)(NO3)(H2O) complex
DOI : http://dx.doi.org/10.13005/ojc/310464
Download this article as:
![]()
In this investigation, we report facile synthesis of transition metal oxides (La2C2O5 and La2O3) as nanoparticles. The process contained two steps: first preparation of complex [La(acacen)(NO3)(H2O)](1) where acacen= acetylacetonatoethylenediamine. Then the precursors were calcination. In first step, complex (1) synthesized using a methanolic solution of La (NO3) 3and acetylacetonatoethylenediamine. Then desired product was collected by suction filtration and characterized using Fourier transform infrared (FT-IR), Ultra Violet-Visible (UV-vis) spectroscopy and cyclic voltammetry (CV) method for electrochemical studies. The next step to prepare nanoparticles, amount of compound (1) put in silica gel and oleic acid solution for 4-hours. Then compound (1) was placed in a furnace with a temperature of 600, 700, 800 and 900°C. After calcination of title compound, this sample studied using XRD (X-ray Diffraction)and SEM (Scanning Electron Microscopy)techniques. Particle size for several diffraction and average crystallite size were measured from the XRD data based on Debye- Scherrerʼequation. The X-ray diffraction patterns at room temperature revealed that, highly pure and crystallized Lanthanum oxide nanoparticles as La2C2O5and La2O3formula with orthorhombic phases in 600°C and 900°C respectively, with an average particle size of about less than 100nm for both nano-oxide. SEM figure show that the particles have same morphology with a uniform porous surface.
KEYWORDS:nanoparticle; X-ray Diffraction; morphology; orthorhombic
Introduction
In recent years, the synthesis of inorganic materials with specific size and morphology has attracted considerable attention. Their excellent physical and chemical properties in various fields, such as solar cells, catalysis, photo detectors, sensors, light emitting diodes and laser communication, have made them attractive1–4 and promising materials. It is well documented that materials with nano-scale grain size show different properties relative to the same material in bulk form 5–7. Preparation of various nano-materials have many different synthetic approaches such as chemical vapor deposition (CVD), thermal evaporation, chemical bath deposition, laser ablation, hydrothermal, homogeneous precipitation in an organic matrix, sonochemical and sol–gel method 8–15.The synthesis, production and manipulation of materials on the Nano scale is one of the favorite areas of research which also attracts the industrialists for designing and fabricating new functional materials with novel special properties 1,2. Among the lanthanides, lanthanum has been extensively examined for its unique properties7–12 and lanthanum has been synthesized in various compositions such as La(OH)313, LaF35, La2(CO3)314, LaPO415–17, LaBO318, LaOF 19, La2Sn2O720, La2O321 nanoparticles.
Lanthanum oxide (La2O3) powders have a lot of attractive properties for industrial and technological applications such as: 1- Nanometer lanthanum oxide can be used in piezoelectric materials to increase product piezoelectric coefficients and improve product energy conversion efficiency; 2- Nano-lanthanum oxide can be used for the manufacture of precision optical glass, high-refraction optical fiber, all kinds of alloy materials; 3- Nano-lanthanum oxide can be used for the preparation of organic chemical products catalysts, and in automobile exhaust catalyst; Nanometer Lanthanum oxide can improve the burning rate of propellant, is a promising catalyst; 4-As regards the photoelectric conversion efficiency of nano-lanthanum oxide is high, it can be used in light-converting agricultural film; 5- Also, nano-lanthanum oxide can be used in electrode materials and in light-emitting material (blue powder), hydrogen storage materials, laser materials etc.
In the present work, we report the synthesis of [La(acacen)(NO3)(H2O)](1), then this compound has been convert to Lanthanum oxides nanoparticle as La2CO5 at 600°C and La2O3 at 900°C.
Experimental
Material and Characterization
All chemicals and solvents were reagent grade or better, obtained from Merck, and used without further purification. Infrared spectra (4000–250 cm−1) of solid samples were taken as 1% dispersion in KBr pellets using a JASCO FT-IR 460 PLUS. Electronic absorption spectra in DMF solution were taken at room temperature on a JASCO 7850 spectrometer. Cyclic voltammograms were recorded using a SAMA500. Three electrodes were utilized in this system: a glassy carbon working electrode, a platinum wire auxiliary electrode and an Ag wire reference electrode. The glassy carbon working electrode was manually cleaned with 1-μm diamond polish prior to each scan. The supporting electrolyte, 0.1 M tetrabutylammonium hexafluorophosphate (TBAH), was recrystallized twice from ethanol-water (1/1) and vacuum-dried at 110◦C overnight. A sweep rate of 100–500 mVs−1 was used for all the scans. Ferrocene was used as an internal standard to compensate for the junction potential variability among experiments.
The thermal behavior was measured with a PL-STA 1500 apparatus. XRD analysis was conducted on a Philips diffractometer of X’pert company with graphite monochromatic Cu Kα radiation (λ = 1.54056 Å). The crystallite sizes of selected samples were estimated using the Scherrer method.
SEM images of the samples were collected on Philips XL30 equipped with an EDX microanalysis (Tarbiat Modares Uni.).
Synthesis of [La (acacen) (H2O) (NO3)]
To a methanolic solution (10 ml) of La (NO3) 3 (0.1 M) was added dropwise aqueous solution acetylacetonatoethylenediamine (0.1 M). The resulting solution was stirred at 55–60◦C for 2h. The solid (desired product) was collected by suction filtration, washed with MeOH solution, then air dried (Yield %34). Anal. Calc: C, %32. 22; H, %5.86,; N, %9. 4). Found: C, 32.12; H, 5.73; N, 9.54.IR (KBr, cm−1): 3419 and 2928 ν(CH), 1644 ν(N-O), 1530- ν(C=C) and ν(C=N),3454 ν(O-H), 1303 ν(conjugated NO3–), 900ν(C-O)
Synthesis of nanoparticles (La2CO5 (2) and La2O3 (3))
Lanthanum oxide nanoparticles were prepared from [La (acacen) (H2O) (NO3)] (1) using the physical method. First 1.0 g of compound (1) dissolved in oleic acid solution (5mL) as a surfactant, then calcinated at 600˚C and 900˚C for 4h,to get La2CO5 and La2O3 nanoparticlesrespectively. The final products were collected and washed with distilled water and absolute ethanol several times, dried in air and kept for further characterization.
Results and Discussion
FT-IR spectroscopy
The broad bands at 2600-3000 cm-1and 1712 cm−1 assigned to stretching vibration of O-H and C=O group sin oleic acid respectively (Fig 1a).As it can be observed in Fig.1 all the bands of the oleic acid and [La (acacen) (H2O) (NO3)](1) were disappeared when the product was calcinated in 900 °C (Fig1c) and only broad band was appeared that attributed to lanthanum oxide (Fig1c). The strong band at 500 cm-1 is assigned to the ν(La-O), indicating formation of La2O3(3).
Strong bandsat1585,1505 and 1625cm-1, related to the stretching vibrations of C = C, C = N, C = O can be shared on acacen ligand[82]. And stretching frequency observed in the1374 cm-1at attributed to NO3–group22. Weak absorptions in theregion3158and 3226cm-1assigned to N-H vibrations of the acacen ligand22.
FT-IR spectra of oleic acid showed in theFig1b. The broad band observed at 2925-2000 cm-1, attributed to overlap of stretching vibration frequency of the acidic OH screw with CH bands. The bonds observed at3006 cm-1, 1711cm-1, 1378 cm-1 and 1465 cm-1assign to CH, C=O, CH2 and CH3 groups, respectively.
![Fig1. FT-IR spectra of a) oleic acid b) [La (acacen) (H2O) (NO3)] (1) c) La2O3 (3) in KBr pellets.](https://www.orientjchem.org/wp-content/uploads/2015/12/Vol31_No4_Synt_Hami_Fig1-150x150.jpg) |
Figure1: FT-IR spectra of a) oleic acid b) [La (acacen) (H2O) (NO3)] (1) c) La2O3 (3) in KBr pellets. |
Electronic Excitation Study
The electronic spectrum of the [La (acacen) (H2O) (NO3)] (1) showed in Fig2. Absorption bands in 217 and 319 nm can be assigned to the intraligand π→π* transition of the aromatic ring and n→π* transition of the acacen and nitrate ligands, respectively. There was any transition in visible region due to Lanthanum (III) has d0 electron configurations.
 in DMF(1)](https://www.orientjchem.org/wp-content/uploads/2015/12/Vol31_No4_Synt_Hami_Fig2-150x150.jpg) |
Figure 2: UV-vis absorption spectra of [La(acacen)(H2O)(NO3)](5×10-5M) in DMF(1) Click here to View figure |
Electrochemical Studies
Cyclic voltammetry was performed in an DMF solution of [La(acacen)(H2O)(NO3)](1) with 0.1 M TBAH as a supporting electrolyte at scan rate 100-500 mV s-1 (Fig. 3). In this voltammogram, two quasi-reversible reduction couples at -0.458 and -0.690 V are assigned to the reduction of acacen ligand, by analogy to other acacen complexes23. In comparison with free acacen, the reduction couples shift to more positive potentials due to the coordination of acacen ligand to the La(III) center.
 in DMF, 0.1 M TBAH as a supporting electrolyte](https://www.orientjchem.org/wp-content/uploads/2015/12/Vol31_No4_Synt_Hami_Fig3-150x150.jpg) |
Figure 3: Cyclic voltammogram of [La(acacen)(H2O)(NO3)](1) in DMF, 0.1 M TBAH as a supporting electrolyte |
X-ray Diffraction
Fig 4 and 5 show the representative XRD pattern of La2CO5 in the absence and presence of oleic acid at 600°C respectively. It is obvious that all the diffraction peaks can be indexed to orthorhombic phase La2CO5 (LCSD Card Number 4242).Compared with the standard diffraction pattern. Maximum diffraction observed at 2θ=29.67° and (103) as miller indices, Fig 4. In addition, the distance between crystalline planes is d=3Å. Also the intense and sharp diffraction peaks with any signals of impurities were attributed to high purity of the product. As can be seen in Fig 5. maximum diffraction is in 2θ=29.90° with (103) as miller indices and d=3.1 Å, with addition of oleic acid.
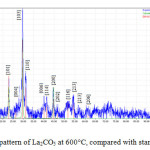 |
Figure 4: XRD pattern of La2CO5 at 600°C, compared with standard sample Click here to View figure |
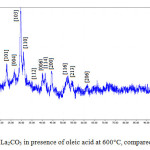 |
Figure 5: XRD pattern of La2CO5 in presence of oleic acid at 600°C, compared with standard sample |
Also particle size for several diffraction and average crystallite size that were measured from the XRD data based on Debye- Scherrerʼequation for La2CO5 in absence and presence of oleic acid at 600°C show in Table 1 and 2 respectively. As can be seen in Table 1, the compound has nano-sized in the range of nanoparticles (below 100 nm).
Table 1: Particle and average crystallite size of La2CO5in absence of oleic acid at 600°C
|
2θ |
B |
Size(nm) |
Average size(nm) |
|
3.71 |
0.006 |
23.1 |
|
|
22.92 |
0.009 |
17.32 |
25.02 |
|
29.67 |
0.005 |
34.65 |
Table 2: Particle and average crystallite size of La2CO5in presence of oleic acid at 600°C
|
2θ |
B |
Size(nm) |
Average size(nm) |
|
3.77 |
0.007 |
19.8 |
|
|
22.95 |
0.013 |
11.55 |
15.58 |
|
29.90 |
0.010 |
15.4 |
[La(acacen)(H2O)(NO3)] calcinated to La2O3 in a furnace at 900C°. Fig 6. Show XRD pattern of La2O3 at 900°C. Nano lanthanum oxide has orthorhombic system with diffraction maximum intensity at 2θ =39.80 and Miller indices (1 1 1) with distance between the plates d= 2.98Å (Table 3).
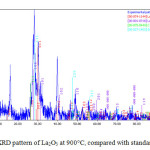 |
Figure 6: XRD pattern of La2O3 at 900°C, compared with standard sample Click here to View figure |
Table 3: Particle and average crystallite size of La2O3at 900°C
|
2θ |
B |
Size(nm) |
Average size(nm) |
|
15.94 |
0.015 |
86.62 |
|
|
28.68 |
0.019 |
36.47 |
56.43 |
|
39.80 |
0.006 |
46.2 |
Surface Morphology
The morphology of the La2CO5 nanoparticles was characterized using scanning electron microscope (SEM) at 600°C. Fig. 7 and 8 show the SEM images of La2CO5 in absence and presence of oleic acid respectively. As can be seen the images are clear examples and nano-carbonate oxide relatively spherical, porous and beneath the high porosity for use as a catalyst for much is suitable. So that the particle size is found 29.0-35.73 nm and 22.33-26.89 nm respectively that in order to the effect of surfactants on the image more uniform and stronger link between particle surface area that can provide a better view.
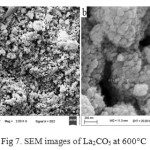 |
Figure 7: SEM images of La2CO5 at 600°C Click here to View figure |
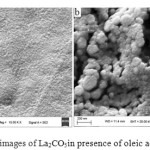 |
Figure 8: SEM images of La2CO5in presence of oleic acid at 600°C |
La2O3 have spherical shape with porous surface and particle size 24.56- 13.40 nm. Fig 9.
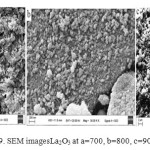 |
Figure 9: SEM imagesLa2O3 at a=700, b=800, c=900˚C Click here to View figure |
Conclusion
Metals, rare earths, has a strong tendency to combine with non-metallic element such as oxygen, nitrogen, carbon and hydrogen, and various factors such as geometry and central atom, the structural features of the ligand molecules, with a solvent can play key roles in the formation of structures them.
The nano-sized particles have different properties than the bulk material can be explained by the fact that the smaller the particle size, the number of at swill be a higher.
As a result, the surface energy of atoms within a material volume with a different energy and this will cause different properties. The unique properties of nanometer particles, not only because of their high level, but also for other reasons such as changes in the crystal lattice, the link between nuclear energy and so is also relevant. It should be noted that the production of nano-materials and the geometric arrangement of atoms is consistent with the changes in particle size, particle size reduction increases the effect of the level. Increased surface to volume ratio of nanoparticles causes the atoms in the surface atoms than the particle size, the particles have physical properties. This feature greatly increases the reactivity of nanoparticles.
In summary, we prepared Lanthanum oxide nanoparticles in the presence and absence Oleic acid as a surfactant. The size of these nanoparticles was measured using XRD and SEM. The images of nano lanthanum oxide at elevated temperatures (600,700, 800 and 900ºC) observed that in all the images of the particles are almost spherical, with uniform and porous or phology and particle size are almost identical.
Acknowledgments
The authors are grateful to the University of Sistan and Baluchestan University for partial financial support.
References:
- Singh, V.P.; Singh, R.S.; Thompson, G.W.; Jayaraman, V.; Sanagapalli, S.; Rangari, V.K. Sol. Energy Mater. Sol. Cells 2004, 81, 293-303
- Shahverdizadeh, G.H.; Morsali, A. J. Inorg. Organomet. Polym. 2011, 21, 694-699
- Payehghadr, M.; Safarifard, V.; Ramazani, M.; Morsali, A. J. Inorg. Organomet. Polym. 2012, 22, 543-548.
- Hashemi, L.; Hosseinifard, M.; Amani, V.; Morsali, A. J. Inorg. Organomet. Polym. 2013, 23, 519-524.
- Marban, G.; Lopez, A.; Lopez, I.; Valdes-Solis, T. Appl. Catal. B Env. 2010, 99, 257
- Valdes-Solis, T.; Marban, G.; Fuertes, A. B. Catal. Today 2006, 116, 354-360.
- Jones, S. D.; Neal, L. M.; Everett, M. L.; Hoflund, G. B.; Weaver, E. H. H. Appl. Sur. Sci. 2010, 256, 7345-7353.
- Wu, Y.; Yang, P. Chem. Mater. 2000, 12, 605-607.
- Iijima, S. Nature 1991, 354, 56-58.
- Morales, A. M.; Lieber, C. M. Science. 1998, 279, 208-211.
- Suciu, C.; Gagea, L.; Hoffmann, A. C.; Mocean, M. Chem. Eng. Sci. 2006, 61, 7831-7835.
- Salavati-Niasari, M.; Hosseinzadeh, G.; Davar, F. J. Alloys Compd. 2011, 509, 134-140.
- Ranjbar, M.; Çelik, Ö.; Mahmoudi Najafi, Sheshmani, S. H., Akbari Mobarakeh, N. J. Inorg. Organomet.Polym. 2012, 22, 837-844
- Ranjbar, M.; Malakooti, E.; Sheshmani, S. J. Chem. 2013, Vol. 2013, Article ID 560983, 6 pages doi: 10.1155/2013/560983
- Khorasani-Motlagh, M.; Noroozifar, M.; Ahanin-Jan, A. J. Iran. Chem. Soc. 2012, 9, 833-839.
- Averbuch-Pouchatand M. T.; Durif, A. World Scientific Publishing Co. Pte. Ltd., Singapore City, 1996.
- Hammas, I.; Horchani-Naifer K.; Ferid, M. Journal of Rare Earths, 2010, 28, No. 3, 321-328.
- Meiser, F.; Cortez, C.; Caruso, F. Angewandte Chemie, 2004, 43, No. 44, 5954-5957.
- Onoda, H.; Nariai, H.; Moriwaki, A.; Maki, H.; Mo- tooka, I. J. Mat.Chem, 2002, 12, No. 6, 1754-1760 .
- Onoda, H.; Funamoto, T. Adv. Mat.Phy. and Chem, 2012, 2, No. 1, 50-54.
- Rajesh, K.; Shajesh, P.; Seidei, O.; Mukundan, P.; Warrier, K. G. K. Adv. Fun. Mat, 2007, 17, No. 10, 1682-1690
- Onoda, H.; Taniguchi, K.; Tanaka, I., Micro and Meso. Mat., 2008, 109, No. 1-3, 193-198.
- Onoda, H.; Matsui, H.; Tanaka, I. Mat. Sci. Eng. B, 2007, 141, No. 1-2, 28-33.


![]()


