Relationship dynamic viscosity and inverse absolute temperature to the concentrated solutions
Ioana Stanciu
University of Bucharest, Faculty of Chemistry,Department of Physical Chemistry, 4-12 Elisabeta Blvd, 030018, Bucharest, Romania
Corresponding Author Email :istanciu75@yahoo.com
DOI : http://dx.doi.org/10.13005/ojc/310419
Article Received on :
Article Accepted on :
Article Published : 25 Nov 2015
This paper presets the study of the rheological characteristics of the concentrated polyethylene-polypropylene copolymer solutions over the temperature range of 313-363 K and for shear rates between 3 and 1312 s-1. The measurements were performed on a Haake VT 550 rotational rheometer with a HV1 sensor. The rheology of the concentrated solutions is influenced by the shear rate, temperature and concentration of the tested copolymer. We have used a successful model that describes the rheological behaviour of the concentrated solutions in comparison to other models that do not consider the copolymer’s concentration. The parameter A reaches a peak for the 10% solution and a minimum for the 3% solution. The parameter B displays close values for all of the studied solutions.
KEYWORDS:Relationship; Dynamic Viscosity; Concentrated Solutions; Rheology
Download this article as:| Copy the following to cite this article: Stanciu I. Relationship dynamic viscosity and inverse absolute temperature to the concentrated solutions. Orient J Chem 2015;31(4). |
| Copy the following to cite this URL: Stanciu I. Relationship dynamic viscosity and inverse absolute temperature to the concentrated solutions. Orient J Chem 2015;31(4). Available from: http://www.orientjchem.org/?p=12734 |
Introduction
The base oils have a Newtonian behaviour in that the viscosity is independent of the temperature and the shear rate. The polymers that are added into the oil may change the solution’s rheological parameters and influence the oil’s viscosity according to the concentration and the shear rate [1-3]. At high shear rates of 106 s-1, in many industrial applications we notice a temporary reduction in the viscosity due to the alignment of those polymer molecules with the shear rate and the temperature. High shear rates are important for the starting resistance and those shear rates are related to the oil pumping into the carter. In order to understand the performance of the viscous polymer solution over a wide range of shear rates, it is necessary to determine the efficacy of a certain additive [4-8].
The polyethylene-propylene polymer that is being used here is formed of some 45% units of ethylene concentrated in the middle of the chain (the polymer is produced inside a tubular reactor that provides for the control of the ethylene units positions along the chain). At low temperatures, the polymer’s segments tend to connect considerably and the solution’s viscosity decreases. The rheological behaviour of the polyethylene-propylene copolymer has been studied by many researchers [9-11]. The rheological behaviour depends on the shear rate at temperatures above 240oC and on the aggregation of various solvents [12-16]. All those studies were performed at high temperatures and low shear rates.
The equation models in the speciality literature showing the dependence of the dynamic viscosity natural logarithm on the absolute temperature are [16-18]:
Guzman
dlnΦ/dT = W/RT2 (1)
Arrhenius
dlnην1/3/dT = k/T2 (2)
Fulcher
ln η = A +B/(T +C) (3)
Litovitz
ln η = A +a/RT3 (4)
Girifalco
ln η = C +(B/T)+(A/T2) (5)
Valzen
ln η = B[(1/T) – (1/T0)] (6)
The purpose of this study is to research the dependence of the dynamic viscosity natural logarithm on the inverse absolute temperature for the polyethylene-propylene copolymer in the SAE 10W oil. At concentrations of 3, 6, 10 and 12% of the polyethylene-propylene additive, we measured the viscosity for some shear rates from 105 to 106 s-1 using a rotational rheometer. The experimental results have been interpreted with other rheological models that are not available in the speciality literature. Using a linear fitting of the lines, we obtained the parameters A and B and the correlation coefficient R2.
Materials and Methods
The polyethylene-propylene copolymer is Paratone 8900 marketed by Exxon Chemical. The physical and the chemical properties are: physical state – solid, form – bales and beads, colour – natural opaque, brown in case of oil extended grades, odour – weak paraffinic, pH value – n/a, relative density – 860 – 900 kg/m3.
The physical and the chemical properties of the SAE 10W oil are: form – homogeneous liquid, yellow-brown, odour – specific, density (15oC) – 0.875-0.910 kg/m3, kinematics viscosity at 40oC – 90 cSt, kinematic viscosity at 100oC – 8 cSt, dynamic viscosity (20ºC) – 65 cP, viscosity index – 70-100, solubility in organic solvents, petroleum, fat, water-insoluble, flash point > 200ºC, melting point – (-10) (-15)ºC, amount of coke – 0.03 – 0.5 %. The utilized SAE 10W oil is mostly paraffinic and contains 75% saturated hydrocarbons. The 3, 6, 10 and 12% solutions have been prepared at the room temperature for several weeks, using continuous mixing. To find the rheological characteristics of the concentrate polymer solutions, we made use of a Haake VT 550 rotational rheometer. This Haake VT 550 rheometer includes an HV1 sensor that provides for the application of some shear rates from 3 to 1312 s-1 over the 313-363 K temperature range.
Results and Discussion
The figure 1 shows the dependence of the dynamic viscosity natural logarithm on the inverse absolute temperature for the 3% solution of the polyethylene-polypropylene copolymer over the 313-363K temperature range and the said shear rates.
The 3% solution of the polyethylene-polypropylene copolymer has been studied over the entire temperature range and the shear rates from 145.8 s-1 to 1312 s-1, while we could not determine the graph at a shear rate of 145.8 s-1 because we only had a few values for the solution’s dynamic viscosity. The line slopes are close but low. To show the dependence of the dynamic viscosity natural logarithm on the inverse absolute temperature, we have used the experimental database to determine the equation (7) where the parameters A and B depend on the solution’s concentration and the solvent’s and the polymer’s nature and type.
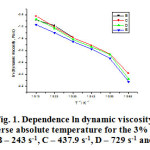 |
Figure 1: Dependence ln dynamic viscosity Versus inverse absolute temperature for the 3% solution at shear rates: B – 243 s-1, C – 437.9 s-1, D – 729 s-1 and E – 1312 s-1 |
The equation that shows the dependence of the dynamic viscosity natural logarithm on the inverse absolute temperature is:
lnη=A +B/T (7)
where A is lnη0 and B is the slope.
The table 1 shows the shear rates range for which we represented the dependence of the dynamic viscosity natural logarithm on the inverse temperature for the 3% solution of polyethylene-polypropylene copolymer, the parameters A and B derived from the equation (7), the correlation coefficients derived from that equation and the statistical correlation coefficients.
Table 1: The shear rate, the parameters A and B derived from the equation (7), the correlation coefficients obtained by polynomial fitting and the statistical correlation coefficients for the 3% copolymer polyethylene-polypropylene solution
|
Shear rate, s-1 |
A |
B |
Correlation coefficient, R2 (equation 7) |
Correlation coefficient, R2 statistical |
|
243 |
-0.3426 |
-0.3710 |
-1.0000 |
– |
|
437.9 |
-0.0286 |
-0.4874 |
-0.9976 |
0.9714 |
|
729 |
-0.0895 |
-0.5017 |
-0.9973 |
0.9430 |
|
1312 |
-0.3065 |
-0.4702 |
-0.9889 |
0.9303 |
As one can see from the table 1, the parameter A displays negative values at the shear rates of 243 s-1 and 1312 s-1 and negative values close to zero for 437.9 s-1 and 729 s-1. The parameter B that stands for the slope has close but low values for the entire shear rates range. The correlation coefficients have values close to one, which shows that the dynamic viscosity natural logarithm features a linear dependence on the inverse absolute temperature. The statistically found correlation coefficients are close to one and could not be calculated for a shear rate of 243 de s-1.
The figure 2 shows the dependence of the dynamic viscosity natural logarithm on the inverse absolute temperature for the 6% solution of polyethylene-polypropylene copolymer over the temperature range of 313-363K and high shear rates.
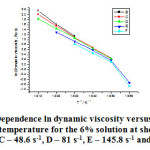 |
Figure 2: Dependence ln dynamic viscosity versus inverse absolute temperature for the 6% solution at shear rates: B – 27 s-1, C – 48.6 s-1, D – 81 s-1, E – 145.8 s-1 and F – 243 s-1 |
The 6% solution of polyethylene-propylene copolymer has been studied at all the temperatures and the shear rates from 9 s-1 to 1312 s-1,while we could not study it for the shear rates of 9 s-1, 16.2 s-1, 437.4 s-1, 729 s-1 and 1312 s-1 because we had few values for the solution’s dynamic viscosity. The line slopes are close but low for all of the shear rates on the graph.
The table 2 shows the shear rates for which we plotted the dependence of the dynamic viscosity natural logarithm on the inverse absolute temperature for the 6% solution of polyethylene-polypropylene copolymer, the parameters A and B derived from the equation (7), the correlation coefficients derived from that equation and the statistical correlation coefficients.
As seen in the table 2, the parameter A is positive for low shear rates. The parameter B, which stands for the slope, has close but low values for the whole range of the shear rates. The correlation coefficients have values close to one, which indicate that the dependence of the dynamic viscosity natural logarithm on the inverse absolute temperature is linear for the 6% solution. The statistically found correlation coefficients are close to one and could not be calculated for the shear rates of 27 s-1 and 243 s-1. Unlike the 3% solution, the 6% solution features positive and close to each other parameters.
Table 2: The shear rate, the parameters A and B derived from the equation (7), the correlation coefficients obtained by polynomial fitting and the statistical correlation coefficients for the 6% copolymer polyethylene-polypropylene solution
|
Shear rate, s-1 |
A |
B |
Correlation coefficient, R2 (equation 7) |
Correlation coefficient, R2 statistical |
|
27 |
2.6545 |
-0.5064 |
-0.9991 |
– |
|
48.6 |
2.4345 |
-0.4390 |
-0.9997 |
0.9992 |
|
81 |
2.2519 |
-0.4025 |
-0.9998 |
0.9968 |
|
145.8 |
2.3922 |
-0.4934 |
-0.9856 |
0.9399 |
|
243 |
2.5885 |
-0.5517 |
-0.9773 |
– |
The figure 3 shows the dependence of the dynamic viscosity natural logarithm on the inverse absolute temperature for the 10% solution of polyethylene-polypropylene copolymer, over the temperature range of 323-363K and low shear rates.
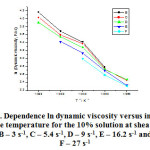 |
Figure 3: Dependence ln dynamic viscosity versus inverse absolute temperature for the 10% solution at shear rates: B – 3 s-1, C – 5.4 s-1, D – 9 s-1, E – 16.2 s-1 and F – 27 s-1 Click here to View figure |
We only studied the 10% solution of polyethylene-polypropylene copolymer for the temperature range of 323-363K and the shear rates from 3 s-1 to 48.6 s-1, and we could not plot the dependence graph for 48.6 s-1 because we only had a few values for the solution’s dynamic viscosity. The line slopes are close and similar to the 3 and 6% solutions’. The table 3 shows the shear rates for which we managed to plot the dependence of the dynamic viscosity natural logarithm on the inverse absolute temperature for the 10% solution of polyethylene-polypropylene copolymer, the parameters A and B derived from the equation (7), the correlation coefficients derived from that equation and the statistically found correlation coefficients.
Table 3: The shear rate, the parameters A and B derived from the equation (7), the correlation coefficients obtained by polynomial fitting and the statistical correlation coefficients for the 10% copolymer polyethylene-polypropylene solution
|
Shear rate, s-1 |
A |
B |
Correlation coefficient, R2 (equation 7) |
Correlation coefficient, R2 statistical |
|
3 |
4.6152 |
-0.4431 |
-0.9890 |
– |
|
5.4 |
4.4372 |
-0.4014 |
-0.9909 |
0.9775 |
|
9 |
4.2850 |
-0.3681 |
-0.9935 |
0.9833 |
|
16.2 |
4.1947 |
-0.3736 |
-0.9971 |
– |
|
27 |
4.0007 |
-0.3445 |
-0.9941 |
– |
As seen in the table 3, the parameter A displays higher values for the 6% solution, at the said shear rates. The parameter B, which stands for the slope, has close values but lower than the ones for the 6% solution, for all of the shear rates. The correlation coefficients have values close to one, which indicate that the dynamic viscosity natural logarithm has a linear dependence on the inverse absolute temperature for the 10% solution. The statistically found correlation coefficients are close to one and could not be calculated for the shear rates of 3 s-1, 16.2 s-1 and 27 s-1. Unlike the 6% solution, the 10% solution features a positive and higher parameter A. The figure 4 shows the dependence of the dynamic viscosity natural logarithm on the inverse absolute temperature for the 12% solution of polyethylene-polypropylene copolymer over the temperature range of 333 – 363 K and low shear rates.
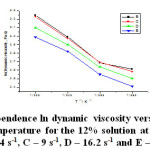 |
Figure 4: Dependence ln dynamic viscosity versus inverse absolute temperature for the 12% solution at shear rates: B – 5.4 s-1, C – 9 s-1, D – 16.2 s-1 and E – 27 s-1 Click here to View figure |
The 12% solution of polypropylene-polyethylene copolymer has only been studied over the temperature range of 333 – 363K and the shear rates from 3 s-1 to 48.6 s-1, but we did not plot the dependence graph for 3 s-1 and 48.6 s-1 as we had a few values of the dynamic viscosity. The line slopes are close to each other but lower than for the 10% solution.
The table 4 shows the shear rates range for which we determined the dependence of the dynamic viscosity natural logarithm on the inverse absolute temperature for the 12% solution of polyethylene-polypropylene copolymer, the parameters A and B derived from the equation (7), the correlation coefficients derived from that equation and the statistically found correlation coefficients.
Table 4: The shear rate, the parameters A and B derived from the equation (7), the correlation coefficients obtained by polynomial fitting and the statistical correlation coefficients for the 12% copolymer polyethylene-polypropylene solution
|
Shear rate, s-1 |
A |
B |
Correlation coefficient, R2 (equation 7) |
Correlation coefficient, R2 statistical |
|
5.4 |
3.4372 |
-0.2207 |
-0.9760 |
– |
|
9 |
3.4216 |
-0.2210 |
-0.9863 |
– |
|
16.2 |
3.2992 |
-0.2049 |
-0.9931 |
– |
|
27 |
3.1938 |
-0.2006 |
-0.9928 |
– |
As seen in the table 4, the parameter A displays positive values, yet lower than for the 10% solution at the said shear rates. The parameter B, which stands for the slope, has close values but higher than for the 10% solution over the entire shear rates range. The correlation coefficients have values close to one, which indicates that the dynamic viscosity natural logarithm has a linear dependence on the inverse absolute temperature for the 12% solution. We could not calculate the statistical correlation coefficients for any shear rate. Unlike the 10% solution, the 12% solution displays parameters which are close in value, but lower and positive. The concentrated solution could not be studied for the temperatures of 313K and 323K because it was very viscous.
The 3 to 6% solutions of polyethylene-polypropylene copolymer have been studied at high shear rates and the entire temperature range, while the 10% and 12% solutions have been studied at low shear rates and high temperatures. The parameter A is negative for the 3% solution, while positive and low for all the others. The parameter B increases with the increase in the solution’s concentration. The correlation coefficients determined from the equation (7) are close to one, which indicates that the dynamic viscosity natural logarithm goes down with the increase in the inverse absolute temperature for all of the solutions.
Conclusions
The rheological characteristics of the polyethylene-polypropylene copolymer solution have been calculated over the temperature range of 313 – 363K shear rates from 3 to 1312 s-1. The measurements have been carried out on a Haake VT 550 rheometer with an HV1 rotational sensor. The rheology of the concentrate solutions is influenced by the shear rate, the temperature and the concentration of the tested copolymer. The paper presents a model that describes the rheological behaviour of the concentrated solutions in comparison to other models that do not take into account the copolymer’s concentration. The parameter A reaches a peak for the 10% solution and a minimum for the 3% solution. The parameter B has similar values for all of the solutions.
Reference
- Metznew, A. B.; Adv. Chem. Eng. 1956, 1, 77-79.
- Erickson, D. C.; Dongqing, L.; White, T. M.; Gao, J.; Ind. Eng. Chem. Res. 2001, 40, 3523-3529.
- Govindan, S.; Vasanthakumari, R.; Radja Sacravarthy, P; International Journal of Emerging Technology and Advanced Engineering. 2012, 2, 7-9.
- Al-Shammari, B.; Al-Fariss, T.; Al-Sewailm, F.; Elleithy, R.; Journal of King Saud University – Engineering Sciences. 2011, 23, 9–14.
- Menon, N.; Nagel, S. R.; Venerus, D. C.; Physical review letters. 1994, 73, 963-965.
- Li, S.; Polym. Eng. Sci. 1997, 37,18.
- Kucks, M. J.; Ou-Yang, H. D.; Rubin, I. D.; Macromolecules. 1993, 26, 3846.
- Han, H. D.; Rao, D. A.; J. Appl. Polym. Sci. 1979, 24, 225.
- Allal, A.; Moha-Ouchane, M.; Boned, C.; Physics and Chemistry of Liquids. 2001, 39, 1-30.
- Joshi, R. M.; Pegg, M. J.; Fuel. 2007, 86, 143-151.
- Gold, P. W.; ASchmidt, H.; Dicke, J.; Loos, C.; Assmann C.; Journal of Synthetic Lubrication 2001, 18,51-79.
- Pensado, A. S.; PComuñas, M. J.; Lugo, L. L.; Fernández, J.; Industrial & engineering chemistry research, 2006, 45, 2394-2404.
- Corcione, M; Energy Conversion and Management. 2011, 52, 789-793.
- Boned, C.; Zéberg-Mikkelsen, C. K.; Baylaucq, A.; Daugé, P.; Fluid phase equilibria 2003, 212,143-164.
- Knežević, D.; Savić, V.; Facta universitatis-series: Mechanical Engineering. 2006, 4, 27-34.
- Cheng, N. S.; Industrial & engineering chemistry research. 2008, 47, 3285-3288.
- Fischer, P.; Rehage, H.; Langmuir 1997, 13, 7012-7020.
- Susa, D.; Lehtonen, M.; Nordman, H.; IEEE Transactions on. 2005, 20,197-204.

This work is licensed under a Creative Commons Attribution 4.0 International License.
![]()
A New Edition of Web of Science
Journal Impact Factor
2022: 0.5
Five Year: 0.8
Journal is Indexed in

Cabells Whitelist
![]()


