Effects of Shear Rate and Inhibitors on Wax Deposition of Malaysian Crude Oil
N. Ridzuan*, F. Adam and Z. Yaacob
Faculty of Chemical Engineering and Natural Resources, Universiti Malaysia Pahang, 26300 Gambang, Pahang, Malaysia. Corresponding aAuthor Email: norida@ump.edu.my
DOI : http://dx.doi.org/10.13005/ojc/310417
Article Received on :
Article Accepted on :
Article Published : 26 Nov 2015
Wax deposition can cause a serious problem in crude oil flow assurance, especially in deep water operation due to the long chain of n-paraffin. This paper examines the effects of two factors on the deposition process, which are shear rate and different types of inhibitors. 10 mL of four different types of wax inhibitors (cocamide diethanolamine (C-DEA), diethanolamine (DEA), poly(ethylene-co-vinyl acetate) (EVA) and poly (maleic anhydride-alt-1-octadecene) (MEA) were injected into a crude oil vessel where the temperature of cold finger and water bath were set at 5°C and 50°C, respectively. The rotation speed was operated at different ranges between 0 and 600 rpm. From the result, it was found that the amount of total wax deposit decreased when shear rate increased. EVA showed a strong effect to inhibit wax formation with 33.33% reduction of wax deposit at 400 rpm as compared to other inhibitors.
KEYWORDS:Wax inhibitor; wax deposition; shear rate; cold finger
Download this article as:| Copy the following to cite this article: Ridzuan N, Adam F, Yaacob Z. Effects of Shear Rate and Inhibitors on Wax Deposition of Malaysian Crude Oil. Orient J Chem 2015;31(4). |
| Copy the following to cite this URL: Ridzuan N, Adam F, Yaacob Z. Effects of Shear Rate and Inhibitors on Wax Deposition of Malaysian Crude Oil. Orient J Chem 2015;31(4). Available from: http://www.orientjchem.org/?p=12742 |
Introduction
The deposition of wax from crude oil in sub sea can occur along the pipeline that is connected from the offshore, as well as to the onshore 1–4. Waxes are linear hydrocarbons with more than 16 carbon atoms 5. n-paraffin chains will crystalize and adhere to each other inside the pipeline to form wax 6. The deposition phenomenon occurs when the operating temperature of the pipeline is below the wax appearance temperature (WAT), where the long linear n-paraffin chains of waxy crude come into contact with the circumference of the pipeline7.
Wax precipitation can be divided into three stages; nucleation, crystal growth and agglomeration 4. Crystallized wax gives severe problems in oil production such as a reduction in pipe diameter and even sometimes can block pipes. Therefore, it influences crude transportation capacity 8. These problems can cause losses of billions of dollars yearly to the petroleum industry 1. In an oil and gas reservoir, any n‒paraffin will be in solution form at high temperature and pressure. The normal surrounding temperature in the seabed can achieve around 4°C, therefore it is easy to cause wax deposition 9.
To minimize wax deposition, many techniques have been introduced through removal and prevention, such as chemical, mechanical and thermal methods. In this study, chemical method was chosen to reduce the rate of solid deposition. The effectiveness of a particular paraffin inhibitor is different for different well. Therefore, the best inhibitor needs to be determined for each well individually 10. Four different types of inhibitors were used in this study, which are cocamide‒diethanolamine (C-DEA), diethanolamine (DEA), poly(ethylene-co-vinyl acetate) (EVA) and poly(maleic anhydride-alt-1-octadecene) (MEA). C-DEA and DEA comprise of hydroxyl groups, whereas EVA and MA consist of acetate and ester group, respectively. It is believed that the addition of an inhibitor in a crude sample can weaken solid deposit through van der Waals bonding, which results in an easy removal of the deposit by shear forces flow streams11.
A polymer inhibitor contains wax‒like portions that allow the molecules to incorporate into the wax deposit structure. This type of in inhibitor also has other structural features that can alter and disrupt crystallization and network growth of crystal wax. However, for hydroxyl group, it can act as a surfactant, which is a good oil-in-water emulsifier that can prevent gelling problem in crude oil and also can act as an inhibitor. Different types of inhibitors have been widely studied for wax deposition problem. It has been found that different inhibitors will give different effect on wax deposition rate12–14. Aside from the type of inhibitor, shear rate in the flow line also gives significant influence on deposition rate. Previous works found that if shear rate increased, the amount of total deposition decreased 8,15. Therefore, the objective of the present work is to gain a better understanding on how wax inhibitor and shear rate affect the rate of wax deposition in Malaysian crude oil.
Material and Methods
Materials
EVA (vinyl acetate 25 wt.%, melt index 19 g/10 min), DEA (purity 99.5%), C-DEA, cyclohexane (purity 99.5%), acetone (purity 99.5%), MEA with average Mn 30,000-50,000, heptane (purity 99.5%) and petroleum ether were obtained from Sigma-Aldrich. Raw crude oil was kindly supplied by PETRONAS Refinery from Kerteh, Terengganu, Malaysia.
Preparation of polymer solvent
EVA and MEA solutions (400 ppm) were prepared by dissolving an appropriate amount of solid EVA and MEA in cyclohexane under continuous stirring at 60°C for 1 h. DEA and C-DEA inhibitors, supplied by Sigma-Aldrich, were used at pure liquid concentration.
Physical property analysis
The following are the equipment used for physical analysis study.
Table 1: Summary of a list of equipment used for physical analysis
|
Equipment |
Usage |
| Differential scanning calorimeter | To determine the WAT of the crude oil sample. |
| Cloud point and pour point apparatus model Koehler | To determine the pour point of the crude oil sample. |
| Brookfield rotational digital model DV-III (spindle no. 31) | To determine the rheology behaviour of the crude oil sample. |
| Gas pycnometer model Micromeritics AccuPyc II 1340 | To measure density. |
Cold finger Experimental set up and Analysis
Fig. 1 shows the cold finger apparatus that was fabricated to evaluate the rate of wax deposition of crude oil. This device is suitable to correlate wax deposition data to the temperature differences between the bulk oil and wall 4,10,15.
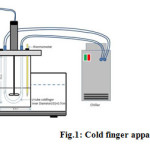 |
Figure 1: Cold finger apparatus set up Click here to View figure |
Methods of Analysis
First, the cold finger was placed within the center of a stainless steel jar filled with 300 mL of crude oil. The crude samples need to be conditioned above the WAT for thermal treatment in an oven for 1 h to solubilize any precipitated wax. An impeller was also attached at the middle of the cold finger to make the field flow influences both the shear stress field and the rate of heat transfer at the cold finger surface.
The cold finger and jar were then placed inside a heating water bath to control the crude oil temperature. The heating bath temperature was initially fixed with a predefined temperature of 50°C. The connection of the cold finger in the cooling bath circulation system was set up while the crude oil was heated up. The cold fluid valve was opened to condition the cold finger after it has reached the thermal equilibrium of the bath and jar. Crude oil with and without wax inhibitor were tested in the cold finger experiment. The stirring rate can be adjusted depending on research purpose. The experiment was carried out for 2 h to presume the aging effect upon the wax deposited onto the cold finger. Visual observations were made for the physical characteristics of the deposits. The deposit was then scrapped from the cold finger, weighed and saved for further analysis 4,15.
Paraffin inhibition efficiency
Paraffin inhibition efficiency (PIE) was calculated using Eq. 1:
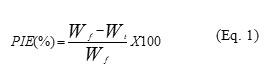
Where Wf is the reference amount of wax deposit without chemical treatment in gram (g) Wt and is the amount of paraffin deposit with chemical treatment in gram (g) 12. Four different shear rates were studied.
Results and Discussion
Characteristics of crude oil sample
The details of the crude oil sample characteristics used in this study such as viscosity, density, specific gravity, WAT, pour point temperature and wax content are shown in Table 2 below.
Table 2: Physical properties of Malaysian crude oil sample
|
Sample Name |
Medium Light |
| Viscosity at 40°C (mPa.s) |
5.18 |
| Density (abs)(g/cm3) |
0.8505 |
| SG sample |
0.8505 |
| °API |
34.87 |
| WAT(°C) |
33 |
| Pour point (°C) |
3 |
| Wax content at 20°C (wt.%) |
20.66 |
Fig. 2 presents the results of cold finger testing for Malaysian crude oil with four different chemical inhibitors. The chemical inhibitor performance is given as a function of four difference shear rates ranged from 0−600 rpm. The test was conducted at constant temperature, experimental duration and amount of inhibitor of 5°C, 2 h and 10 mL, respectively. Wax deposit was found to decrease significantly when the shear rate increased at the shear condition from 0‒400 rpm. This trend is suggested due to the decrease of crude oil viscosity surrounding the cold finger 13,16. Minimum wax was observed at 400 rpm for all chemical inhibitors.
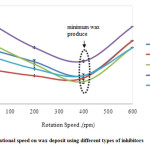 |
Figure 2: Effect of rotational speed on wax deposit using different types of inhibitors Click here to View figure |
The cold finger temperature was set below its wax appearance temperature. Therefore, it is believed that the crude oil at the cold finger area will show non-Newtonian behaviour. By introducing stirring rate, the heat transfer produced by the stirring of the impeller to the cold finger increased. This activity changed the internal energy of both systems involved, which is from non-Newtonian to Newtonian region. Nevertheless, changing the temperature around the cold finger also changed the rheology of the wax deposit. However, when the samples were stirred rapidly at the shear rate of 600 rpm, the amount of deposit increased slightly. This happens due to the shear thickening fluid behaviour resultant from a very viscous liquid. The non‒Newtonian behaviour increased the tendency of the wax to precipitate out from the crude oil to form waxes through crystallization process. Once the crystals have formed, the tendency of the crystal to aggregate is higher.
Above the pour point temperature, the crude oil behaves as a Newtonian character. At this condition, the crude oil is in the liquid form. Below pour point temperature, the crude oil region changed from Newtonian to non‒Newtonian fluid region due to the presence of solid particles 17. The viscosity of the crude oil is influenced by two factors; crude oil temperature and shear rate 16. The presence of chemical inhibitor at low temperature would help the wax to alter crystal growth and surface characteristic by incorporation into the wax structure. The capability of the wax to stick to each other would be lower due to van der Waals interaction. Therefore, the solubility of chemical inhibitor in crude oil will play a major role in viscosity reduction 18.
Table 3 shows the performance inhibitor efficiency (%PIE) of each chemical inhibitor. EVA inhibitor shows the best performance to reduce and inhibit wax formation. The PIE data were calculated using Eq. 1. The order of inhibitor performance is:
EVA > MEA > DEA > C−DEA
EVA has a polar group along the polymeric chain, which contributes to better performance of the polymer additives as a wax crystallization modifier 19,20. The strong van der Waals interaction between EVA and wax (C28H58) influences the inhibitor performance. Although MEA also has a polar group, but the interaction of the molecules of MEA with wax molecules is weaker than EVA. This interaction is based on the radial distribution function (rdf) analysis 11.
For the results of DEA and C-DEA wax deposit, it can be suggested that DEA and C-DEA could not give strong van de Waals interaction because these inhibitors possess a hydroxyl group (OH) that could not incorporate into the wax molecules. A molecular dynamic simulation on the interaction of DEA and C-DEA with n-paraffin should be conducted for better understanding.
Fig. 3 represents the wax deposit formed on the cold finger by varying the stirring rate. As shown in the figures, the deposit had approximately 1 mm thickness for 0 rpm. The deposit layer seems smooth and soft gel wax was observed as shown in Fig. 3 (a). It can be easily scratched off from the cold finger u-tube. As shown in Fig. 3 (b) to (c), once the shear rate was introduced at the range of 200 rpm to 400 rpm, the thickness and wax deposit amount were reduced and it became easier to scratch off compared to the wax obtained at 0 rpm.
As shown in Table 3, 400 rpm gave the best performance with 33.33% of PIE value based on the weight and surface area basis when EVA was used as the inhibitor. However, the performance at 600 rpm was suddenly outperformed where the amount of deposit obtained increased more than the control sample. The control sample is the crude oil without the addition of any inhibitor.
Table 3: The results of performance inhibitor efficiency
|
%PIE / Type of Inhibitor |
Performance Inhibitor Efficiency (%PIE) |
|||||
|
No Inhibitor |
EVA |
DEA |
MEA |
C-DEA |
||
|
0 |
NA |
23.08 |
NA |
7.69 |
NA |
|
|
Shear rate (rpm) |
200 |
15.38 |
30.77 |
17.95 |
23.08 |
0.00 |
|
400 |
30.77 |
33.33 |
37.18 |
30.77 |
14.87 |
|
|
600 |
NA |
NA |
0.00 |
0.00 |
NA |
|
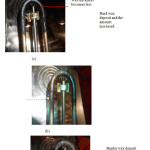 |
Figure 3: Example of changes of deposit thickness with increasing shear rate using EVA inhibitor at (a) 0 rpm, (b) 200 rpm, (c) 400 rpm and (d) 600 rpm |
Effect of pour point temperature on crude oil sample
Table 4 presents pour point temperature using four different inhibitors in the crude oil. Pour point is the lowest temperature at which the crude oil flows freely under its own weight because of the crystallization of waxes or paraffin 13,21. From the table, EVA inhibitor shows the lowest pour point value compared to other inhibitors. However, when DEA and C-DEA were used as inhibitors, the pour point obtained changed from 10°C to 19°C and 20°C, respectively. This value confirmed that different types of inhibitors can affect and increase the pour point of crude oil. The higher value of pour point temperature suggests higher probability of solid crystallization process, whereby it can increase the viscosity of crude oil and cause flow problems. Therefore, different rates of crystal growth are affected by different types of chemical inhibitors 16.
Strong van der Waals interaction between wax and the functional group in EVA is suggested as a reason in the decrease of WAT and increase of wax solubility as discussed in our previous work 11.
Table 4: Pour point temperature of crude oil with different types of chemical inhibitors
| Crude oil with different types of inhibitors |
No inhibitor |
EVA
|
MEA
|
DEA |
C-DEA |
|
Temperature (°C) |
10 |
5 |
8 |
19 |
20 |
Conclusions
EVA inhibitor shows the best performance to reduce wax formation based on paraffin inhibitor efficiency value. This study found that as the stirring rate increased, the amount of wax deposit was observed to be decreased with the present of inhibitors. This activity changed the internal energy of both systems involved, which is from non‒ Newtonian to Newtonian region. The minimum shear rate was found at 400 rpm for every experiment. Once exceeded
the minimum point, wax content would start to increase due to the shear thickening fluid behaviour resultant from a very viscous liquid.
Acknowledgments
The authors would like to express high appreciation to Universiti Malaysia Pahang and the Ministry of Higher Education, Malaysia, through Research Acculturation Grant Scheme (RAGS-RDU 121414) for having this research project successfully conducted.
References
- Misra S., Baruah S. and Singh, K., SPE Production and Facilities, 1995, 10, 50–54.
- Jang Y. H., Blanco M., Creek J., Tang Y. and W. a Goddard, The Journal of Physical Chemistry. B, 2007, 111, 13173–9.
- H. S. Lee, Computational and Rheological Study of Wax Deposition and Gelation in Subsea Pipelines (2008), PhD Thesis;The University of Michingan,
- J. D. S. T. dos Santos, A. C. Fernandes and M. Giulietti, Journal of Petroleum Science and Engineering, 2004, 45, 47–60.
- M. D. C. Garcia, L. Carbognani, A. Urbina and M. Orea, Petroleum Science and Technology, 1998, 16, 1001–1021.
- J. Hilbert, Presented at SPE Asia Pacific Oil and Gas Conference and Exhibition held in Brisbane, Queensland, Australia.18-20 October 2010. SPE-133948-MS., 2010,. 18–20.
- Zougari M. I. and Sopkow T., Industrial and Engineering Chemistry Research, 2007, 46, 1360–1368.
- D. W. Jennings and K. Weispfennig, Energy and Fuels, 2006, 20, 2457–2464.
- K. Wang, C. Wu, J. L. Creek, P. J. Shuler and Y. Tang, Petroleum Science and Technology, 2003, 21, 369–379.
- M. Lashkarbolooki, F. Esmaeilzadeh and D. Mowla, Journal of Dispersion Science and Technology, 2011, 32, 975–985.
- N. Ridzuan, F. Adam and Z. Yaacob, Presented at International Petroleum Technology Conference held in Kuala Lumpur, Malaysia,10-12 December 2014., paper IPTC-17883-MS.2014
- O. Bello, S. Fasesan, C. Teodoriu and K. Reinicke, Petroleum Science and Technology, 2006, 24, 195–206.
- K. S. Pedersen and H. P. Rønningsen, Energy and Fuels, 2003, 17, 321–328.
- K.-S. Wang, C.-H. Wu, J. L. Creek, P. J. Shuler and Y. Tang, Petroleum Science and Technology, 2003, 21, 369–379.
- D. W. Jennings and K. Weispfennig, Energy and Fuels, 2005, 19, 1376–1386.
- T. J. Behbahani, a. Dahaghin and K. Kashefi, Petroleum Science and Technology, 2011, 29, 933–941.
- A. M. Elsharkawy, T. a. Al-Sahhaf and M. a. Fahim, Fuel, 2000, 79, 1047–1055.
- M. Badger and H. Schobert, Carbon, 1998, 461–465.
- C. Wu, J. Zhang, W. Li and N. Wu, Fuel, 2005, 84, 2039–2047.
- A. L. . Machado, F. . Elizabete and G. Gaspar, Journal of Petroleum Science and Engineering, 2001, 32, 159–165.
- L. M. Alghanduri, M. M. Elgarni, J.-L. Daridon and J. a. P. Coutinho, Energy and Fuels, 2010, 24, 3101–3107.

This work is licensed under a Creative Commons Attribution 4.0 International License.
![]()
A New Edition of Web of Science
Journal Impact Factor
2022: 0.5
Five Year: 0.8
Journal is Indexed in

Cabells Whitelist
![]()


