The application of differential scanning calorimetry as a mean to determine the oxidative stability of vegetable oils and its comparison with Rancimat
Yousef Ramezan1, Mehrdad Ghavami1*, Manochehr Bahmaei2, Mohammad Hadi Givianrad3, Amir Hooman Hemmasi4
1Department of Food Science and Technology, Science and Research branch, Islamic Azad University, Tehran, Iran
2Faculty of Chemistry, Tehran North Branch, Islamic Azad University, Tehran, Iran
3Department of Marine Chemistry, Science and Research branch, Islamic Azad University, Tehran, Iran
4Department of Wood and Paper Science Engineering, Science and Research branch, Islamic Azad University, Tehran, Iran
Corresponding author; Email: ghavamim1@gmail.com
DOI : http://dx.doi.org/10.13005/ojc/310316
Article Received on :
Article Accepted on :
Article Published : 29 Jul 2015
Differential scanning calorimetry (DSC) and Rancimat apparatus have been used to evaluate the oxidative stability of eight different edible vegetable oils. Rancimat apparatus was operated at 110 ⁰C with an air flow of 18-20 L/hand measures the induction period (IP) of the selected samples. The DSC technique involved the oxidation of the samples in an oxygen flow DSC cell when the cell temperature was set at isothermal temperatures of 100, 110, 120 and 130 ⁰C. Oxidative induction time (T0) determined by the time, where a rapid exothermic reaction were occurred between oil and oxygen. The results showed that unsaturated edible oils are more susceptible to oxidation in short time, than saturated one. Furthermore, the results indicated that there is a good correlation (p<0.0001) between DSC T0 and the Rancimat values.
KEYWORDS:Oxidative stability; Oxidative induction time; DCS; Induction period; Rancimat
Download this article as:| Copy the following to cite this article: Ramezan Y, Ghavami M, Bahmaei M, Givianrad M. H, Hemmasi A. H. The application of differential scanning calorimetry as a mean to determine the oxidative stability of vegetable oils and its comparison with Rancimat. Orient J Chem 2015;31(3). |
| Copy the following to cite this URL: Ramezan Y, Ghavami M, Bahmaei M, Givianrad M. H, Hemmasi A. H. The application of differential scanning calorimetry as a mean to determine the oxidative stability of vegetable oils and its comparison with Rancimat. Orient J Chem 2015;31(3). Available from: http://www.orientjchem.org/?p=10115 |
Introduction
The oxidation form referred to auto oxidation, which is detectable only in the advance stage of process. The auto oxidation of oils and fats is the main cause of their deterioration and the most important problems in storage and processing technology of such food (1). Lipid oxidation that leads to a decrease in the shelf life has been recognized as a problem in the food industry. The residence time to oxidation is expressed as induction period (IP) (2). Numerous instrumental and chemical methods have been used for determination of oxidative stability over decades. The Schaal Oven Test (OST) and the Active Oxygen Methods (AOM) have been widely applied to evaluate the oil stability (3).
Elevated temperature in the presence of pure oxygen or normal air, in excess, are used to determine the induction period in a short time (4). Currently, oxidative stability of oils and fats can be determined by two commercially available equipments recommended by AOCS (5). The Rancimat manufactured by Metrohm Ltd. (Herisau, Switzerland) and the Oxidative Stability Instrument (OSI) by Omniom Inc. (Rockland, MA; 6).
Rancimat apparatus is based on the work of Pardun and Korall (1972) and involves continuous measurement of the conductivity of water receiving volatiles from heated oil through which a constant stream of controlled filtered air is passed (7,8).
Thermal analysis is an accelerated method, which determines the oil stability and the antioxidant activity (9). Recently, Differential Scanning Calorimetry has been applied to determine the oils and fats oxidation stability by several researchers (10, 11, 12, 13, 14, 15, and 16). The end point of DSC was taken at the time were a rapid exothermic reaction of oil and oxygen has occurred (15).
Thermal Analytical techniques such as DSC can also be used to determine melting profile characteristics and crystallization like heat of translation , phase diagram, fatty material contain and fraud identify in fat and butter (17).
The aim of the present study was to evaluate the oxidative stability of eight different oils selected according to their fatty acid composition using DSC and correlate with the results obtained with Rancimat apparatus.
Materials and Methods
Sunflower, canola, refined-bleached-deodorized palm olein (RBDPOO) and soybean oils were obtained from Savola Behshahr Oil Company in Tehran, and other edible oils consisting of maize, peanut and coconut were purchased from Tehran local market. All the chemicals and solvents used were of analytical grades purchased from Merck chemical company (Darmstadt, Germany).
Fatty acid composition by gas chromatography (GC)
Gas liquid chromatography was used to determine the component fatty acids. Fatty acids were converted into their methyl esters using transesterification methods of oils with sodium methoxide as catalyst according to AOCS method (18). Agilent- technologies 6890 N gas chromatograph equipped with a flame ionization detector and a capillary column (120m X25 mm ID-BPX 700. 250) (USA). Capillary column with temperature programming was used to determine the fatty acid composition according to AOCS method (19). Helium was used as the carrier gas.
Standard chemical analyses
Free fatty acids (FFA), Iodine (IV), Peroxide (PV), Anisidine (AV) and Totox (TxV) values of the samples were determined according to AOCS method (4).
Rancimat analysis
The induction period of the samples were evaluated by Metrohm Rancimat apparatus model 743(Herisau/ Switzerland) and determination was obtained as defined in AOCS Official Method cd 12b-92 (4). The instrument was operated at 110 °C with an air flow rate of 18-20 L/h. The induction period was recognized by a sharp change in the slope on the chart. A tangent was drawn from the slope to intersect an extension of the baseline and the distance of this intersection from the start was a measure of the induction time.
DSC analysis
The oxidative induction times for the eight different edible oils were determined by Setaram instrumentation 7 differential scanning calorimeter, 69300 caluire (France). Pure indium (melting temperature 156.6 ⁰C, Hf = 28.45 J/g) was used to calibrate the instrument and the baseline was obtained with an empty open aluminum pan. Edible oil samples of 5.0±0.5 mg were weighed into the open aluminum pans and placed in the equipment’s sample chamber. The isothermal temperatures was programmed at four different temperatures (100, 110, 120 and 130 ⁰C), and then purified oxygen (99.8%) was passed through the sample enclosure at 50 ml/min. The DSC induction time (T0) of the oxidation reaction corresponded closely to intersection of the extrapolated baseline and the tangent line (leading edge) of the exotherm.
Statistical Analysis
All the experiments were performed in triplicate orders. The data were analyzed with Minitab 16 software. Person correlations compared the values obtained for DSC induction times (T0) and Rancimat values. These correlations were applied, since they measure the strength and direction of their linear relationship, describing the direction and degree to which variable is linearly related to others.
Results and Discussion
The fatty acids composition of eight different edible oils is shown in Table 1. It was observed that sunflower oil is unsaturated and coconut oil is the saturated oils among the eight edible oils as tabulated in the Table 2. Table 2 presents the Chemical Characteristics of the oils as an indicated sun flower oil has the highest and coconut oil has the lowest iodine value. Oxidation reaction is an exothermic reaction; evaluation of oxidative stability time (T0) by DSC was measured by extrapolation in exothermic curves such as Fig. 1. When nitrogen (99.99%) is passed through the sample, no exothermic reaction was observed. While an exothermic curve was detected when pure oxygen (99.98 %) is passed through the sample.
Table1: Fatty acid composition of eight different edible oils
|
Canola |
Coconut | Maize | Peanut | RBDPOoa | Sesame | Soybean | Sunflower | |
| C8:0 |
0.00 |
7.18 |
0.00 |
0.00 |
0.00 |
0.00 |
0.00 |
0.00 |
| C10:0 |
0.00 |
6.50 |
0.00 |
0.00 |
0.00 |
0.00 |
0.00 |
0.00 |
| C12:0 |
0.01 |
47.60 |
0.00 |
0.02 |
0.18 |
0.00 |
0.00 |
0.00 |
| C14:0 |
0.05 |
17.72 |
0.03 |
0.09 |
0.09 |
0.07 |
0.09 |
0.07 |
| C16:0 |
5.26 |
9.10 |
10.96 |
9.81 |
43.13 |
8.75 |
11.12 |
6.43 |
| C18:0 |
2.36 |
2.90 |
2.23 |
3.99 |
4.39 |
5.05 |
4.80 |
4.00 |
| C18:1 |
62.16 |
6.70 |
30.71 |
40.44 |
38.25 |
36.97 |
22.83 |
22.78 |
| C18:2 |
18.65 |
1.75 |
54.56 |
41.81 |
11.41 |
47.18 |
52.21 |
63.81 |
| C18:3 |
8.45 |
0.00 |
0.71 |
1.70 |
0.67 |
1.27 |
7.03 |
0.68 |
| C20:0 |
1.63 |
0.00 |
0.23 |
0.08 |
0.14 |
0.19 |
0.18 |
0.16 |
| Others |
1.43 |
0.55 |
0.57 |
2.06 |
1.74 |
0.52 |
1.74 |
2.07 |
a RBDPOo, refined-bleached- deodorized palm olein.
Table2: Chemical Characteristics of eight different edible oilsa
|
Oil |
IV(g I2/100 g oil) |
PV (meq/ kg oil) |
AnV |
TxV |
FFA (%) |
|
Canola |
111.54± 0.64 |
4.71± 0.01 |
1.15± 0.01 |
10.57± 0.01 | 0.95± 0.01 |
|
Coconut |
7.52± 0.02 |
0.11± 0.01 |
1.04± 0.01 |
1.26± 0.04 | 0.93± 0.02 |
|
Maize |
121.61± 0.55 |
1.23± 0.04 |
2.17± 0.05 |
4.63± 0.14 | 0.05± 0.00 |
|
Peanut |
109.76± 0.04 |
6.75± 0.07 |
3.42± 0.02 |
16.92± 0.17 | 0.42± 0.00 |
|
RBDPOob |
49.55± 0.06 |
11.61± 0.16 |
0.87± 0.02 |
24.10± 0.35 | 0.15±0.00 |
|
Sesame |
116.48± 0.05 |
5.42± 0.02 |
1.97± 0.02 |
12.81± 0.08 | 0.41±0.02 |
|
Soybean |
128.53± 0.34 |
0.39± 0.01 |
3.20± 0.03 |
3.98± 0.00 | 0.04±0.00 |
|
Sunflower |
131.77± 0.31 |
0.71± 0.02 |
9.38± 0.06 |
10.81± 0.10 | 0.04±0.00 |
a Each value in the table represents the mean value± standard deviation of triplicate analyses.
b RBDPOo, refined-bleached- deodorized palm olein.
Abbreviation: IV: iodine value; PV: peroxide value; AnV: anisidine value; Tx V: Totox value; FFA: free fatty acids.
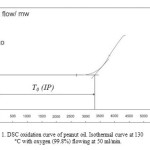 |
Figure1: DSC oxidation curve of peanut oil. Isothermal curve at 130 °C with oxygen (99.8%) flowing at 50 ml/min. |
Mean values of DSC T0 and Rancimat IP are presented in Table 3. The Rancimat values ranged from 192.30 to 1831.20 min. At the same temperature (110 °C) DSC provided lower oxidative induction time as compared with Rancimat values. The difference between DSC and Rancimat is due to the lower sample size requirement (5.0±0.5 mg) for DSC against the Rancimat method (3.0±0.5 g). Moreover, the ratio of surface to volume should be considered as an important parameter. In DSC method pure oxygen (99.99%) is passed through the sample, but in the Rancimat normal air after passing through the air filter is applied.
Coconut oil and RBDPOo with lower iodine value showed significantly (p<0.05) higher induction time than unsaturated oils such as sunflower, peanut, maize and soybean oils. In sesame oil high amount of endogenous antioxidants such as sesamol and sesaminol together with tocopherols make this oil resistant to oxidation (13); in connection with canola oil high amount of oleic (62.16 %) acid might be stabilize this oil against the oxidation.
With 10 °C increasing in isothermal temperature, T0 significantly (p<0.05) decreased to half order of previous column (e.g. 120 to 130 °C) this phenomena is agreed with Q10 law in rate of chemical reaction with increasing temperature (Table 3).
Table3: Differential scanning calorimetry (DSC) oxidative induction time (T0) and Rancimat induction periods (IP) of various edible oilsa
|
Oil |
DSC T0 (min)b |
Rancimat IP(min) |
|||
|
100 °C |
110 °C |
120 °C |
130 °C |
110 °C |
|
|
Canola |
601.92± 0.11Ca | 302.34± 0.65Cb | 171.54± 0.04Cc | 99.87± 0.05Cd | 615.00± 0.85Ce |
|
Coconut |
1829.88± 0.19Aa | 997.96± 0.33Aa | 554.64± 0.40Ab | 327.33± 0.92Ac | 1831.20± 1.70Ad |
|
Maize |
584.61± 0.07Ea | 288.25± 0.35Eb | 169.35± 0.08Dc | 87.20± 0.05Ed | 502.80± 0.85De |
|
Peanut |
195.24± 0.04Ba | 122.95± 0.07Gb | 82.22± 0.38Ec | 55.75± 1.09Fd | 481.50± 2.12Be |
|
RBDPOoc |
838.90± 0.09Ga | 421.25± 1.62Bb | 256.09± 0.10Bc | 135.37± 0.05Bd | 1140.90± 0.42Ee |
|
Sesame |
599.81± 0.04Da | 296.60± 0.84Db | 170.72± 0.08Cc | 94.75± 0.11Dd | 611.40± 0.85Ce |
|
Soybean |
130.60± 0.09Ha | 73.21± 0.15Hb | 45.94±0.15Fc | 22.49± 0.02Hd | 192.30± 0.42Ge |
|
Sunflower |
319.81± 0.09Fa | 150.55± 0.63Fb | 71.16± 0.94Gc | 41.20± 0.05 Gd | 271.80± 0.85Fe |
aMeans within each column with different letters (A-H) are significantly (p<0.05) different. Means within each row with different letters (a-e) are significantly (p<0.05) different
bEach value in the table presents the mean of three measurements.
cBDPOo, refined-bleached- deodorized palm olein.
The Pearson coefficient of correlation is the measure of degree of linier relationship between two variables. The DSC T0 showed high correlation with the Rancimat values, independent of edible oil source (Table 4). The Pearson coefficient of correlation is higher than 0.96 for each comparison. Liner regression equations were proposed in Table 5, because there is high association between DSC T0 and Rancimat values. It is difficult to determine one regression equation for finding the relationship between both methods, because edible oils have the different chemical composition and sources.
Table4: Pearson correlation coefficient matrix between DSC (T0) and Rancimat (IP)a
| DSC 100 | DSC 110 | DSC 120 | DSC 130 | |
| DSC 100 |
_ |
_ |
_ |
_ |
| DSC 110 |
0.998 |
_ |
_ |
_ |
| DSC 120 |
0.996 |
0.998 |
_ |
_ |
| DSC 130 |
0.991 |
0.997 |
0.997 |
_ |
| Rancimat 110 |
0.963 |
0.966 |
0.977 |
0.973 |
a significance at 0.01 level (p<0.01). DSC100, DSC at isothermal temperature 100 °C; DSC110, DSC at isothermal temperature 110 °C; DSC120, DSC at isothermal temperature 120 °C; DSC130, DSC at isothermal temperature 130 °C; Rancimat 110; Rancimat at isothermal temperature 110 °C.
Table5: Relationship between Rancimat induction periods (IP) and DSC (T0) at for different isothermal temperaturesa
|
Indicator (Y) |
Indicator (x) |
Regression equation |
p-value |
|
| Rancimat 110 | DSC 100 | IP (Rancimat 110) = 92.5 + 0.962 T0 (DSC 100) |
0.0001 |
|
| DSC 110 | IP (Rancimat 110) = 118 + 1.770 T0 (DSC 110) |
0.0001 |
||
| DSC 120 | IP (Rancimat 110) = 92.4 + 3.230 T0 (DSC 120) |
0.0001 |
||
| DSC 130 | IP (Rancimat 110) = 116 + 5.460 T0 (DSC 130) |
0.0001 |
||
a significance at 0.0001 level (p<0.0001). DSC100, DSC at isothermal temperature 100 °C; DSC110, DSC at isothermal temperature 110 °C; DSC120, DSC at isothermal temperature 120 °C; DSC130, DSC at isothermal temperature 130 °C; Rancimat 110; Rancimat at isothermal temperature 110 °C.
Conclusion
In this research we found that there is an excellent correlation between DSC T0 and Rancimat values. This study also revealed that DSC method is an accurate, reliable and fast method, which could be regarded as a suitable technique for the evaluation of oxidative stability in oils and fats. Therefore, DSC method might be recommended as an accelerated method for assessing the oxidative stability, due to its time saving, simplicity and the fact that small quantity of substrate might be required to carry out the tests. Consequently, this method might replace the presently used Rancimat in research and quality control laboratories related to food industries.
Acknowledgement
The authors are grateful to Laboratory Complex of the Islamic Azad University Science and Research Branch for using of the DSC instruments and Savola Behshahr Oil Company in Tehran.
References
- Kowalski, B. (1989). Thermochim. Acta. 1989, 156, 347–358.
- Arain, S.; Sherazi, S.T.H.; Bhanger, M.I.; Talpur., F.N.; Mahesar, S.A. Thermochim. Acta. 2009, 484, 1–3.
- Wan, P. J. Accelerated stability methods. In K. Warner, & N. A. M. Eskin (Eds), Methods to assess quality and stability of oils and fat-containing foods. Champaign, Illinios: American Oil Chemists’ Society. 1995, 179–189.
- Velasco, J.; Andersen, M.L.; Skibsted, L.H. Food Chem. 2004, 85, 623–632.
- AOCS (1992). Official methods and recommended practices of the American Oil Chemists Society. D. firestone (Ed.), Champaign, USA (A.O.C.S. Official Method Cd 12b-92: Oxidative Stability Index).
- Akoh, C. C. J. Am. Chem. Soc.1994, 71, 211–216.
- Ghavami, M.; Gharachorloo, M. J. Food Tech. Nutr. 2006, 3(2), 2-8.
- Farhoosh, R. J. Am. Chem. Soc. 2007, 87, 865–869.
- Kowalski, B. (1993). Themochim. Acta. 1993, 213, 135–146.
- Cross, C. K. J. Am. Chem. Soc. 1970, 47, 229–230.
- Hassel, R. L. (1976). J. Am. Chem. Soc. 1976, 53, 179–181.
- Raemy, A.; Froelicher, I.; Loelinger, J. Thermochim. Acta. 1987, 114, 159–164.
- Tan, C. P.; Che Man, Y. B.; Selamat, J.; Yusoff, M. S. A. Food Chem. 2002, 76, 385–389.
- Giuffrida, F.; Destaillats, F.; Egart, M.H; Hug, B.; Golay, P.A.; Skibsted, L.H.; Dionisi, F. Food Chem. 2007, 101, 1108–1114.
- Pardauil, J.J.R.; Souza, L.K.C.; Molfetta, F.A.; Zamian, J.R.; Filho, G.N.R.; Costa, C.E.F.D. Bioresource Technology. 2011, 102, 5873–5877.
- Srisuwan, Y.; Baimark, Y. Orient. J. Chem. 2014, 30, 63- 69.
- Sheibani, A; Ghotbaddini, N; Bahraman, B; Sadeghi, F. Orient. J. Chem. 2014, 30, 1205- 1209.
- AOCS (1995a). Official methods and recommended practices of the American Oil Chemists Society. 4th ed. Champaign, USA (A.O.C.S. Official Method Ce 2-66: Preparation of methyl esters of long chain fatty acids).
- AOCS (1995b). Official methods and recommended practices of the American Oil Chemists Society. 4th ed. Champaign, USA (A.O.C.S.Official Method Ce 1-62: Fatty acid composition by gas chromatography).

This work is licensed under a Creative Commons Attribution 4.0 International License.
![]()
A New Edition of Web of Science
Journal Impact Factor
2022: 0.5
Five Year: 0.8
Journal is Indexed in

Cabells Whitelist
![]()


