Synthesis, structural visualization, spectroscopic, and thermal studies of charge transfer Cu(II), Ni(II) and Zn(II) bromides-carbamide complexes at elevated temperature
Khlood Abou-Melha1*, Moamen S. Refat2,3, and Khaled M. Elsabawy2,4
1Chemistry Department, Q1 Faculty of Science of Girls, Abha, King Khalid University, Abha,
2Department of Chemistry, Faculty of Science, Taif University, 888 Taif, Kingdom Saudi Arabia
3Department of Chemistry, Faculty of Science, Port Said, Port Said University, Egypt
4Materials Science Unit, Chemistry Department, Faculty of Science, Tanta University, 31725, Tanta-Egypt.
Corresponding Author Email: kaboumelha@yahoo.com
DOI : http://dx.doi.org/10.13005/ojc/310336
Article Received on :
Article Accepted on :
Article Published : 09 Sep 2015
In the present study, the composition and structure of Cu(II), Ni(II) and Zn(II) compounds resulted from the chemical reactions of copper(II), nickel(II) and zinc(II) bromide salts with carbamide in aqueous media at 95 oC have been investigated, using IR, electron spin resonance ESR and x-ray powder diffraction spectroscopy as well as thermal analysis TG/DTG/DSC. The Cu2(OH)3Br, [Ni2(NCO)2(H2O)2(Br)2], and ZnCO3.xH2O compounds were achieved by a novel synthetic route through with a low cost precursor like carbamide. The infrared spectra of the results indicate absence of the individual bands of carbamide, but exhibited of the distinguished bands of hydroxyl, isocyanate, NCO, and ionic carbonate, CO32– for Cu(II), Ni(II) and Zn(II) compounds, respectively. Visualized investigations were performed to confirm crystal structure, validity and stability of the product compounds. A general reaction mechanisms describing the preparation of Cu(II), Ni(II), and Zn(II) compounds were discussed.
KEYWORDS:carbonate CO32–; Isocyanate ion; Infrared spectra; X-ray; carbamide
Download this article as:| Copy the following to cite this article: Abou-Melha K, Refat M. S, Elsabawy K. M. Synthesis, structural visualization, spectroscopic, and thermal studies of charge transfer Cu(II), Ni(II) and Zn(II) bromides-carbamide complexes at elevated temperature. Orient J Chem 2015;31(3). |
| Copy the following to cite this URL: Abou-Melha K, Refat M. S, Elsabawy K. M. Synthesis, structural visualization, spectroscopic, and thermal studies of charge transfer Cu(II), Ni(II) and Zn(II) bromides-carbamide complexes at elevated temperature. Orient J Chem 2015;31(3). Available from: http://www.orientjchem.org/?p=10708 |
Introduction
Carbamide is physiologically very important. It is the chief nitrogenous product of protein metabolism. Carbamide has a melting point of 132 °C, soluble in water and ethanol, but insoluble in ether. Carbamide is used for preparing formaldehyde-Carbamide resin (plastics) [1], barbiturates [2], and fertilizers [3-6]. Carbamide is also extensively used in the paper industry to soften cellulose and has been used to promote healing in infected wounds and many other applications in the field of medicine [7-9]. Some metal-carbamide complexes have pharmaceutical application, e.g., the platinum-carbamide complex which is used as antitumor [10].
Yamaguchi and Stewart [11, 12] were assigned all of the observed frequencies in the spectra of carbamide and carbamide-d4. The two vibrations of the frequencies at 1686 and 1603cm-1 were assigned as the 1686 cm-1 band due to CO stretching vibration and the 1603 cm-1 band for NH2 bending motion. The calculations studied by Yamaguchi showed that for the band at 1686 cm-1, the contribution of the NH2 bending motion is greater than that of CO stretching motion. The infrared bands of carbamide-d4 observed at 1245 and 1154 cm-1 are assigned to ND2 bending vibrations. This assignment is consistent with the observed depolarization degrees of the Raman lines. The 1464cm-1 frequency of carbamide is assigned to the CN stretching vibration. The corresponding frequency of carbamide-d4 is observed at 1490cm-1. The 1150cm-1 band is assigned to NH2 rocking vibrations.
The reactions between transition metal ions and carbamide at room temperature have been studied extensively [13-17]. The infrared spectra of these complexes clearly indicated that carbamide molecule behaves as a mono dentate ligand and coordinates to the metal ions through the oxygen atom and not the nitrogen atom.
The nature of the reaction products depend strongly on the type of metal ions and so the metal salt used. The novelty in our previously studies [18-27] were oriented to the reaction of carbamide ligand with different metals such as Co(II), pb(II), Sn(II), Cr(III), Fe(III), Au(III), Sn(IV), V(V) and Mo(IV) at high temperature which demonstrate that the types of metal ions beside their anions have a pronounced effect on the nature of the reaction products. The published papers were trended for the reaction of carbamide with different metal salts at elevated temperature lead to discovering a novel method for preparation pbCO3 and CoCO3 [21], lanthanide carbonates [23,27], limonite, FeO(OH) [20], 2ZnCO3.3Zn(OH)2 [19], SnOCl2.2H2O [18], (Cr2O3, MnO2, MoO3 and WO3) oxides resulted from a novel oxidation reduction reaction between (K2CrO4 or K2Cr2O7), KMnO4, Na2MoO4 and Na2WO4, respectively, with carbamide in an aqueous solution at ~ 85 oC [27].
The sunshine side in this study was undertaken to identify the nature of the reaction mechanisms of the products resulted during the reaction of carbamide with CuBr2,NiBr2 or ZnBr2 at 95 oC for 16 hrs in aqueous media. The reaction products were isolated as solids and characterized well by X-ray diffraction reinforced and supported with visualization studies as well as spectroscopic and thermal analyses tools.
Experimental
Materials and synthesis
All chemicals used throughout this work were analytical pure. The Cu2(OH)3Br, [Ni2(NCO)2(H2O)2(Br)2], and ZnCO3.xH2O compounds were prepared by mixing an aqueous solutions (100 ml) of 0.1 M of carbamide with 0.01 M of the respective CuBr2,NiBr2 or ZnBr2 salts. The mixtures were heated at 95 oC for 16 hrs in a hot plate. The solid products compounds were filtered off, washed several times with hot water, dried at 80 oC in an oven for 3 hours and then placed in vacuo over anhydrous calcium chloride. The yields of the obtained Cu(II), Ni(II), and Zn(II) compounds were varied in the range 63-to-77% depending upon the type of metal as well as on the counter ions associated with the metal ion. The elemental analyses for Cu2(OH)3Br, [Ni2(NCO)2(H2O)2(Br)2], and ZnCO3.xH2O compounds (Table 1) obtained during the reaction of carbamide with the respective metal bromide salts almost the same and indicate the absence of nitrogen element.
Instruments
The elemental analyses of carbon, hydrogen and nitrogen contents were performed by the microanalysis unit at Cairo University, Egypt, using a Perkin Elmer CHN 2400 (USA). The infrared spectra with KBr discs were recorded on a Shimadzu FT-IR Spectrophotometer (4000–400 cm-1) in Taif University. The electron spin resonance (ESR) spectrum for copper(II) compound was performed on Jeol, JES-FE2XG, ESR-spectrometer, Frequency 9.44 GHz with Jeol Microwave unit. The thermal studies TG/DTG/DSC were carried out on a SCINCO DSC 1500 STA in Taif University, which was calibrated with indium metal. The X-ray diffraction patterns for the selected charge-transfer complexes were recorded on X ‘Pert PRO PANanalytical X-ray powder diffraction, target copper with secondary monochromate. Carbonate content in the zinc(II) compound was determined by dissolving a sample of each product in excess standard HCl and the excess of HCl was determined using standard sodium carbonate [28]. The percentage of Cu(II), Ni(II), and Zn(II) within their compounds were determined gravimetrically method till constant weight and stable formula.
Results and Discussion
Infrared Spectra
The reaction of aqueous solutions of carbamide with bromide salts of copper(II), nickel(II), and zinc(II) at 95 oC produces a green, light green, and white solid crystalline products, respectively. The infrared spectra of carbamide as well as the reaction products of different Cu(II), Ni(II) and Zn(II) salts with carbamide at elevated temperature were obtained from potassium bromide discs. The spectra of free carbamide ligand, copper(II), nickel(II), and zinc(II) compounds are shown in Fig. 1a-d, respectively. The infrared spectra show no bands due to any of the reactants and of coordinated carbamide.
In case of zinc carbonate hydrated compound, a group of bands characteristic for the ionic carbonate, (CO3)2-, is appeared [29]. Based on this fact, along with that obtained from elemental analysis data as well as the volumetric determination of (CO3)2- group with standard solution of HCl and beside that the infrared spectrum of the commercially obtained ZnCO3 is the same as that of the product resulted from the reaction between zinc(II) bromide and carbamide at 95 oC. The infrared assignments agree quite well with those known [29] for the ionic carbonate (CO3)2-. The (CO3)2- ion is planar and therefore, it belongs to the D3h symmetry. It is expected to display four modes of vibrations, A`1 + A“2 + 2E` (E` is a doubly degenerate motion). The vibration A`1 is only Raman active while the other n2, n3 and n4 are infrared active. The stretching vibrations of the type; n(C-O); n3(E`) is observed as a medium band in the range of ˜ 1500-1370 cm-1 while the stretching vibration n(C-O); n1(A`1) is observed in the region ~1050 cm-1 as a medium-to-weak band. It should be indicated here that this motion (A`1) should be infrared inactive, its weak appearance in the spectrum of MCO3 could be related to weak solid-solid interactions causes the symmetry of CO32- to be lowered than D3h. The out of plane of vibration d(OCO); n2(A“2) is observed in the range of ~830 cm-1 as a medium strong band while, the angle deformation bending vibration d(OCO); n4(E`) appear in the range of 690 cm-1 as a medium strong. The infrared spectra of zinc(II) carbonate hydrate, ZnCO3.xH2O (Fig. 1d) show that, some these products are hygroscopic and its clearly have moisture water. The band related to the stretching vibration nas(O-H) and ns(O-H) of H2O are observed as expected at 3441 and 3353 cm-1, respectively. At room temperature the coordination compounds of Zinc(II) ion with urea have been studied extensively [30,31] and it was found that, in these complexes, urea coordinated through its oxygen atom forming the [Zn(urea)2X2] where (X = Cl–, NO3– or CH3COO–). At high temperature the role of Zn(II) ions in decomposing the coordination urea in the form of [Zn(urea)2X2] could be understood as follows;
![Fig. 1: Infrared spectra of a- Urea, b- Cu2(OH)3Br, c- [Ni2(NCO)2(H2O)2(Br)2] and d- ZnCO3.H2O compounds](http://www.orientjchem.org/wp-content/uploads/2015/09/Vol31_No3_Synt_Khld_Fig1-150x150.jpg) |
Figure 1: Infrared spectra of a- Urea, b- Cu2(OH)3Br, c- [Ni2(NCO)2(H2O)2(Br)2] and d- ZnCO3.H2O compounds Click here to View figure |
Metallic hydroxy salts with the composition M2(OH)3X (M = Cu, Co; X = organic anion) [32-34] have been extensively studied because of their interesting magnetic properties, that are strongly dependent on the structure and molecular ordering of intercalated anions, as well as, the interlayer distance determined by them. Accordingly, the properties of those materials can be easily manipulated, such that can be considered tunable magnetic materials [34]. So, it is reported in this paper a new cheap and simple method for preparation of copper hydroxybromide, an interesting member of this class of layered materials. The infrared spectrum of copper hydroxyl bromide, Cu2(OH)3Br, compound has some characteristic vibrational modes which are expected in the IR spectrum. In the specific case of the metal-oxygen bond, medium peaks are expected between 496 and 407 cm‑1. Medium intensity vibrational modes associated to the Cu–O–H bond should appear in the interval at 815, 844 and 1110 cm-1 [35]. The narrow bands at 3523 and 3405 cm-1 corresponds to stretching symmetric and asymmetric OH groups. The frequency of the vibrational modes attributed to Cu–O–H bonds are depend on the degree of hydrogen bonding and were found at 777, 681 and 534 cm-1 [34]. In this study, the decomposition of coordinated carbamide in aqueous media at ~ 95 oC forming the new compound, [Cu2(OH)3Br may be understood as follows. It is well known [30, 36] that Cu(II) forms with urea the complex ion [Cu(urea)4]2+ at room temperature. Accordingly, in our case the parent complex [Cu(urea)4](Br)2 is formed. This parent complex may decompose at high temperature according to the following equation;
![]()
The reaction of nickel nitrate with urea in water was studied at 40° by the isothermal method [37]. The ternary solubility diagram of the Ni(NO3)2-Urea-H2O system is presented. The solid phases in the system have the compounds of Ni(NO3)2.2(NH2)2CO.2H2O, Ni(NO3)2.4(NH2)2CO, and Ni(NO3)2.10(NH2)2CO. All solubility of solid phases were determined at 30° and confirmed by an X-ray structural method. Complexes of N-ally urea (NAU) with cobalt(II) and nickel(II) halides and perchlorates have prepared and characterized by electrical conductance, magnetic susceptibility [38]. The infrared spectra of N-allyl urea complexes with Ni(II) and Co(II) salts, [Co(NAU)2X2]; (X= Cl–, Br–, and I–), [Ni(NAU)4X2]; (X=Cl–, Br–), [Ni(NAU)4](ClO4)2 and [Ni(NAU)6](ClO4)2 are reported [39]. A negative shift in the frequencies of n(C=O) and d(NH2) bands, and a positive shift in the frequency of n(C-N) band, suggest that carbonyl oxygen is the donor site.
The infrared spectrum of [Ni2(NCO)2(H2O)2(Br)2] complex clearly indicates the absence of bands due to the coordinated carbamide and the presence of very strong bands characteristic for isocyanate ions at 2220 ν(NCO−) cm-1 and 644 δ(NCO−) cm-1 [40] and for coordinated water at the 1629, 3642 and 3434 cm-1 respectively, for δ(H2O), nas(O-H) and ns(O-H) of H2O. At room temperature the nickel(II)-urea complex is formulated as [Ni(urea)4]2+ [37, 38]. At high temperature this complex may undergo the following reaction; where (X =Br–).

Electron Spin Resonance
The ESR tool of analysis is useful in discuss the geometry and state of electrons in metal ion of the compounds. In this paper, the ESR spectrum of the Cu(II) compound (Fig. 2). The solid-state ESR spectra of some of the compounds exhibit axially symmetric g-tensor parameters with g||> g┴> 2.0023, indicating that the copper site has a dx2–y2 ground-state characteristic of tetrahedral, square-planar, or octahedral stereochemistry. The g||> g┴ for synthesized copper(II) hydroxylbromide, Cu2(OH)3Br, indicates a distorted octahedral. In axial symmetry, the G-values are given by Eq. 1.
G= (g||-2)/(g┴-2) = 4 → (1)
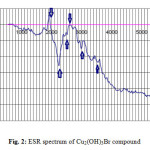 |
Figure2: ESR spectrum of Cu2(OH)3Br compound Click here to View figure |
Where G is the exchange interaction parameter, according to literature, for the considerable exchange interaction process between Cu(II) centers in the solid state the value of G ≤ 4. The Giso. Value obtained for Cu(II) compound is estimated to be 2.3850 which satisfy the above mentioned parameter. The giso value was evaluated by using the relation giso = 1/3 g|| + 2/3 g┴, and these calculated values are in agreement with an orbital non-degenerate state.
The values of g|| were calculated for assigned arrows peaks in Fig.2 and found to be 1.934, 2.2512 and 3.0016 respectively.
This trend of increasing in g|| values was observed with V. P. Singh [41] who was studying the electronic and ESR spectra of Cu(II) halo-hydrazones complexes and indicated that each complex exhibits a six-coordinate tetragonally distorted octahedral geometry in the solid state and in DMSO solution. The ESR spectra of most of the Cu-complexes reported in [41] are typically isotropic type at room temperature (300 K) in solid state as well as in DMSO solution. However, all the Cu-complexes have the trend g|| > g┴, observed in all the complexes measured. The same trend was observed in Fig.2 all values of g|| > g┴ which reflect that all axial position in the monoclinic crystal form of Cu2(OH)3Br are effectively by the magnetic field by ratio higher than those of perpendicular positions (g┴). The unusual behavior of isocyanate and halide complexes of copper (II) was repored by Chughtai et al. [42] were investigated the magnetic effects on the geometry of some salts of the isocyanato and halo-cuprate(II) anion involving tetraethylammonium and other bulky cations.
Table 1: Elemental analyses data of Mn(II), Cd(II), Mg(II) and Ca(II) carbonate compounds.
| Compounds | Color. |
Elemental analyses/ Found (Calc.) |
|||||||
|
%C |
%H |
%Metal |
% CO32– |
||||||
|
Calc. |
Found |
Calc. |
Found |
Calc. |
Found |
Calc. |
Found |
||
| Cu2(OH)3Br | green | — | — | 1.17 | 1.12 | 49.26 | 48.97 | — | — |
| [Ni2(NCO)2(H2O)2(Br)2] | Light green | 6.05 | 5.99 | 1.01 | 1.00 | 29.55 | 29.43 | — | — |
| ZnCO3.H2O | white | 8.37 | 8.21 | 1.41 | 1.32 | 45.60 | 45.33 | 41.84 | 40.47 |
They proposed that the -N=C=O isocyanate and halo cuprate (II) entities are arrayed about the copper in a square planar (or pseudo octahedral) manner in the blue isomer and in a tetrahedral (though probably distorted tetrahedral) crystal form.
Table 2: Selective bond lengths and angles inside unit cell of Cu2(OH)3Br compound
|
atom1 |
atom2 |
d1-2 |
atom3 |
d1-3 |
angle^ 213° |
|
Cu1 |
O3 |
1.9899 |
O3 |
1.9899 |
180.000 |
|
O3 |
1.9899 |
O1 |
2.3297 |
107.925 |
|
|
O3 |
1.9899 |
O1 |
2.3297 |
72.075 |
|
|
O3 |
1.9899 |
O1 |
2.3297 |
107.925 |
|
|
O1 |
2.3297 |
O1 |
2.3297 |
180.000 |
|
|
Cu2 |
Cu1 |
0.0000 |
O3 |
1.9899 |
0.000 |
|
Cu1 |
0.0000 |
O3 |
1.9899 |
0.000 |
|
|
Cu1 |
0.0000 |
O1 |
2.3297 |
0.000 |
|
|
Cu1 |
0.0000 |
O1 |
2.3297 |
0.000 |
|
|
O3 |
1.9899 |
O3 |
1.9899 |
180.000 |
|
|
O3 |
1.9899 |
O1 |
2.3297 |
72.075 |
|
|
O3 |
1.9899 |
O1 |
2.3297 |
107.925 |
|
|
O3 |
1.9899 |
O1 |
2.3297 |
107.925 |
|
|
O3 |
1.9899 |
O1 |
2.3297 |
72.075 |
|
|
O1 |
2.3297 |
O1 |
2.3297 |
180.000 |
|
|
O1 |
1.9004 |
O2 |
1.9173 |
105.366 |
|
|
O1 |
1.9004 |
Br1 |
2.1175 |
96.010 |
|
|
O2 |
1.9173 |
Br1 |
2.1175 |
156.476 |
|
|
Cu3 |
1.9004 |
Cu1 |
2.3297 |
99.545 |
X-Ray diffraction (XRD) and structural analysis measurements
The X-ray diffraction measurements (XRD) were carried out at room temperature on the fine ground powders of pure products resulted from reaction of metal bromide with urea in the range (2θ =2-70o) using Cu-Kα radiation source and a computerized X-ray diffractometer with two theta scan technique. The accurate analysis of XRD indicated that the first compound is Cu2(OH)3Br which has A2XY3 structure type with monoclinic crystal form as clear in Fig. 3. The lattice parameters were calculated and found to be a = 6.154, b = 6.813 and c = 9.114 Å for monoclinic structure of P121/c1 space group respectively. By the same technique the analysis of XRD of compound II resulted from reaction of zinc bromide with urea was found ZnCO3.H2O trigonal crystal structure with 32/m space group and lattice parameters a = 4.672 and c = 15.0199Å respectively as clear in assigned figure Fig. 3a.
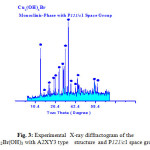 |
Figure 3: Experimental X-ray diffractogram of the Cu2Br(OH)3 with A2XY3 type structure and P121/c1 space group Click here to View figure |
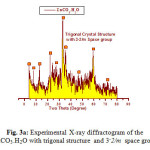 |
Figure 3a: Experimental X-ray diffractogram of the ZnCO3.H2O with trigonal structure and 3–2/m space group Click here to View figure |
The analysis of Fig.3b which describes experimental XRD-profile of polycrystalline phases exist together with nickel-complex proved that the highest figure of merit (F) was for monoclinic phase with P212121 space group. The last product produced from nickel bromide with urea reaction was formulated and confirmed to be [Ni2(NCO)2(H2O)2(Br)2] complex with rhombohedra unit cell with lattice parameters a =19.0711, b=10.4231 and c = 8.9876 Å respectively and P212121 space group.
![Fig.3b: Experimental X-ray diffractogram of the [Ni2(NCO)2(H2O)2(Br)2] complex](http://www.orientjchem.org/wp-content/uploads/2015/09/Vol31_No3_Synt_Khld_Fig3b-150x150.jpg) |
Figure 3b: Experimental X-ray diffractogram of the [Ni2(NCO)2(H2O)2(Br)2] complex Click here to View figure |
Structural visualization
Visualized studies of crystal structure were made by using Diamond Molecular Structure version 3.2 packages, Germany and Mercury 2.3-BUILD RC4-UK. A visualization study made is concerned by matching and comparison of experimental and theoretical data of atomic positions, bond distances, oxidation states and bond torsion on the crystal structure formed. The visualized studies for compound I (Cu2(OH)3Br) as model of urea precursor reactions confirmed that there are very good fitting between experimental XRD of Cu2(OH)3Br see Fig. 3a and visualized XRD-pattern Fig. 4.
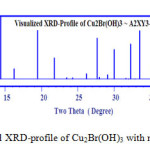 |
Figure 4: Visualized XRD-profile of Cu2Br(OH)3 with monoclinic crystal form Click here to View figure |
Table 2 displays some selective bond distances and angles inside unit cell of (Cu2(OH)3Br) compound as it cleat there is two different types of copper atoms nominated as Cu1 and Cu2 ,three types of oxygen atoms symbolized as O1,O2 and O3 respectively .And finally only one type of bromide .One can observe that copper linked with oxygen recording 1.98 ,2.3297 ,1.91 Å for Cu1-O3,Cu2-O1 and Cu2-O1 respectively .These observations confirmed that there are more one oxidation state for copper which consistent and support ESR-data reported in the present manuscript.
Furthermore Figs. 5, 6 together with Table 2 confirm that the obtained compound I is hundred percent Cu2(OH)3Br with A2XY3 structure type and monoclinic crystal form.
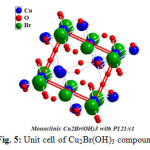 |
Figure 5: Unit cell of Cu2Br(OH)3 compound Click here to View figure |
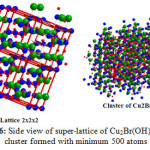 |
Figure 6: Side view of super-lattice of Cu2Br(OH)3 and cluster formed with minimum 500 atoms Click here to View figure |
Fig. 3b shows experimental polycrystalline XRD-profile recorded for [Ni2(NCO)2(H2O)2(Br)2] complex. It was notified that the most intense reflection peak is located at two theta ~ 42.22 with [214] Muller index. This peak has highest figure of merit (F) ~288.17 accompanied with maximum multiplicities = 8 respectively as shown and tabulated in Table.3 which shows also some visualized selected XRD-diffraction data with its d-spacing inside unit cell of Ni-Isocyanate-Bromide complex.
Fig.7 shows the visualized XRD-profile of evaluated rhombohedra nickel-complex with intense diffraction peak lies at two theta value ~ 42.15° which is nearly identical to that induced in the experimental XRD-profile Fig.3b.
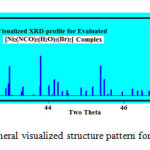 |
Figure 7: Rhomboheral visualized structure pattern for Nickel-complex Click here to View figure |
Fig.8 displays ball-stick and fill-space models for Ni-NCO-Br complex with minimum 78 atoms inside visualized unit cell of nickel-isocyanate-bromide complex .Furthermore 2x2x2 super unit cell was built up to confirm validity of rhombohedral structure of nickel complex [Ni2(NCO)2(H2O)2(Br)2] as stable valid structure form.
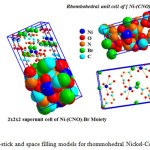 |
Figure 8: Ball-stick and space filling models for rhommohedral Nickel-Complex Click here to View figure |
To complete visualization investigations with good fitting between theoretical and experimental studies many of structural parameters were analyzed carefully such as bond lengths, torsion on angles and symmetry operations.
Table 3: Some selected visualized XRD-data inside Ni-complex lattice
|
No |
2q |
d Å |
F |
h |
k |
l |
Multi. |
|
1 |
40.014 |
2.2515 |
174.46 |
3 |
4 |
1 |
8 |
|
2 |
40.041 |
2.2500 |
86.34 |
0 |
0 |
4 |
2 |
|
3 |
40.262 |
2.2381 |
174.29 |
8 |
1 |
1 |
8 |
|
4 |
40.333 |
2.2344 |
53.53 |
1 |
0 |
4 |
4 |
|
5 |
40.418 |
2.2299 |
127.87 |
0 |
3 |
3 |
4 |
|
6 |
40.518 |
2.2246 |
193.46 |
6 |
3 |
1 |
8 |
|
7 |
40.707 |
2.2147 |
125.94 |
1 |
3 |
3 |
8 |
|
8 |
40.753 |
2.2123 |
199.69 |
4 |
4 |
0 |
4 |
|
9 |
41.087 |
2.1951 |
339.81 |
0 |
1 |
4 |
4 |
|
10 |
41.198 |
2.1894 |
99.15 |
2 |
0 |
4 |
4 |
|
11 |
41.201 |
2.1893 |
128.27 |
5 |
3 |
2 |
8 |
|
12 |
41.278 |
2.1854 |
113.48 |
0 |
4 |
2 |
4 |
|
13 |
41.372 |
2.1806 |
39.05 |
1 |
1 |
4 |
8 |
|
14 |
41.427 |
2.1779 |
150.34 |
6 |
0 |
3 |
4 |
|
15 |
41.562 |
2.1711 |
209.58 |
1 |
4 |
2 |
8 |
|
16 |
41.566 |
2.1709 |
135.72 |
2 |
3 |
3 |
8 |
|
17 |
42.023 |
2.1483 |
83.48 |
4 |
4 |
1 |
8 |
|
18 |
42.086 |
2.1453 |
162.63 |
8 |
2 |
0 |
4 |
|
19 |
42.220 |
2.1388 |
288.17 |
2 |
1 |
4 |
8 |
|
20 |
42.397 |
2.1302 |
112.82 |
5 |
2 |
3 |
8 |
|
21 |
42.407 |
2.1298 |
65.14 |
2 |
4 |
2 |
8 |
|
22 |
42.445 |
2.1280 |
90.79 |
6 |
1 |
3 |
8 |
|
23 |
42.608 |
2.1202 |
10.56 |
3 |
0 |
4 |
4 |
|
24 |
42.874 |
2.1076 |
88.29 |
7 |
2 |
2 |
8 |
|
25 |
42.936 |
2.1048 |
162.07 |
7 |
3 |
0 |
4 |
|
26 |
42.967 |
2.1033 |
178.51 |
3 |
3 |
3 |
8 |
|
27 |
43.029 |
2.1004 |
14.73 |
8 |
0 |
2 |
4 |
|
28 |
43.286 |
2.0885 |
85.98 |
5 |
4 |
0 |
4 |
|
29 |
43.324 |
2.0868 |
98.15 |
8 |
2 |
1 |
8 |
|
30 |
43.603 |
2.0741 |
30.88 |
3 |
1 |
4 |
8 |
Tables 4a,4b describe some selected bond distances and structural parameters of visualized [Ni2(NCO)2(H2O)2(Br)2] complex concerned by the two different types of nickel atoms inside unit cell of Ni-isocyanate- bromide complex symbolized as Ni1 and Ni2 .
Table 4a: Selective bond lengths and angles for Nickel-type one inside crystal lattice of [Ni2(NCO)2(H2O)2(Br)2] complex.
|
Atom1 |
Atom2 |
d1-2 |
Atom3 |
d1-3 |
Angle^ 213° |
|
Ni1 |
O2 |
2.2163 |
O1 |
2.3540 |
85.828 |
|
O2 |
2.2163 |
O3 |
2.3788 |
95.915 |
|
|
O2 |
2.2163 |
O4 |
2.3805 |
81.709 |
|
|
O1 |
2.3540 |
O3 |
2.3788 |
99.428 |
|
|
O1 |
2.3540 |
O4 |
2.3805 |
89.254 |
|
|
O1 |
2.3540 |
O5 |
2.5380 |
166.246 |
|
|
O1 |
2.3540 |
O6 |
2.7991 |
124.131 |
|
|
O3 |
2.3788 |
O4 |
2.3805 |
170.837 |
|
|
O3 |
2.3788 |
O5 |
2.5380 |
80.488 |
|
|
O3 |
2.3788 |
O6 |
2.7991 |
82.229 |
|
|
O4 |
2.3805 |
O5 |
2.5380 |
91.781 |
|
|
O4 |
2.3805 |
O6 |
2.7991 |
95.371 |
|
|
O4 |
2.3805 |
C2 |
3.2780 |
95.466 |
|
|
O4 |
2.3805 |
C1 |
3.3074 |
107.172 |
|
|
O5 |
2.5380 |
O6 |
2.7991 |
42.121 |
|
|
O5 |
2.5380 |
C2 |
3.2780 |
82.690 |
|
|
O5 |
2.5380 |
N2 |
3.3262 |
121.033 |
|
|
O6 |
2.7991 |
C2 |
3.2780 |
123.912 |
|
|
O6 |
2.7991 |
C1 |
3.3074 |
102.946 |
|
|
O6 |
2.7991 |
N2 |
3.3262 |
82.627 |
|
|
C2 |
3.2780 |
C1 |
3.3074 |
125.474 |
|
|
C2 |
3.2780 |
N2 |
3.3262 |
136.858 |
|
|
C2 |
3.2780 |
Br2 |
3.5118 |
66.637 |
|
|
C1 |
3.3074 |
N2 |
3.3262 |
21.681 |
|
|
C1 |
3.3074 |
N3 |
3.4102 |
127.934 |
|
|
C1 |
3.3074 |
C3 |
3.4375 |
72.827 |
|
|
N2 |
3.3262 |
N3 |
3.4102 |
129.667 |
|
|
N2 |
3.3262 |
C3 |
3.4375 |
71.802 |
|
|
N2 |
3.3262 |
Br3 |
3.4409 |
69.972 |
|
|
N3 |
3.4102 |
C3 |
3.4375 |
58.067 |
|
|
N3 |
3.4102 |
Br3 |
3.4409 |
64.749 |
|
|
C3 |
3.4375 |
Br3 |
3.4409 |
20.550 |
|
|
C3 |
3.4375 |
C4 |
3.4695 |
169.096 |
|
|
C3 |
3.4375 |
Br2 |
3.5118 |
19.615 |
Table 4b: Selective bond lengths and angles for Nickel-type two inside crystal lattice of [Ni2(NCO)2(H2O)2(Br)2] complex.
|
Atom1 |
Atom2 |
d1-2 |
Atom3 |
d1-3 |
Angle^ 213° |
|
|
Ni2 |
O2 |
2.2163 |
O1 |
2.3540 |
85.828 |
|
|
O2 |
2.2163 |
O3 |
2.3788 |
95.915 |
||
|
O2 |
2.2163 |
O4 |
2.3805 |
81.709 |
||
|
O1 |
2.3540 |
O3 |
2.3788 |
99.428 |
||
|
O1 |
2.3540 |
O4 |
2.3805 |
89.254 |
||
|
O1 |
2.3540 |
O5 |
2.5380 |
166.246 |
||
|
O3 |
2.3788 |
O4 |
2.3805 |
170.837 |
||
|
O3 |
2.3788 |
O5 |
2.5380 |
80.488 |
||
|
O3 |
2.3788 |
O6 |
2.7991 |
82.229 |
||
|
O4 |
2.3805 |
O6 |
2.7991 |
95.371 |
||
|
O4 |
2.3805 |
C2 |
3.2780 |
95.466 |
||
|
O5 |
2.5380 |
O6 |
2.7991 |
42.121 |
||
|
O5 |
2.5380 |
C2 |
3.2780 |
82.690 |
||
|
O5 |
2.5380 |
C1 |
3.3074 |
142.688 |
||
|
O6 |
2.7991 |
C2 |
3.2780 |
123.912 |
||
|
O6 |
2.7991 |
C1 |
3.3074 |
102.946 |
||
|
O6 |
2.7991 |
N2 |
3.3262 |
82.627 |
||
|
C2 |
3.2780 |
C1 |
3.3074 |
125.474 |
||
|
C2 |
3.2780 |
N2 |
3.3262 |
136.858 |
||
|
C2 |
3.2780 |
N3 |
3.4102 |
20.883 |
||
|
C1 |
3.3074 |
N2 |
3.3262 |
21.681 |
||
|
N2 |
3.3262 |
Br3 |
3.4409 |
69.972 |
||
|
N3 |
3.4102 |
C3 |
3.4375 |
58.067 |
||
|
C3 |
3.4375 |
Br2 |
3.5118 |
19.615 |
||
|
Br3 |
3.4409 |
C4 |
3.4695 |
151.929 |
||
|
Br3 |
3.4409 |
Br2 |
3.5118 |
0.965 |
||
|
C4 |
3.4695 |
Br2 |
3.5118 |
152.889 |
||
As it clear from table. 4a Ni1 linked with six different types of oxygen atoms nominated as ( O1,O2,O3,O4,O5 and O6 ) recording bond lengths equal to 2.35 ,2.21 ,2.37 ,2.38,2.53 and 2.7 Å respectively . These data confirmed that the average density of positively charge focused on the nickel atoms (Ni1 ,Ni2) are varying as environmental neighboring atoms is changed [43,44,45,46,47 and 48] . Similar behavior was observed with nickel type two (Ni2) as reported and tabulated in Table. 4b.
Tables 5a,b,c are describing the bonding between different six oxygen atoms symbolized as O1,O2,O3,O4,O5 and O6 with other neighboring atoms.
Table 5a: Selective bond lengths and angles for oxygen-type one and two inside crystal lattice of [Ni2(NCO)2(H2O)2(Br)2] complex.
|
Atom1 |
Atom2 |
d1-2 |
Atom3 |
d1-3 |
Angle^ 213° |
|
O1 |
C1 |
1.5699 |
Ni1 |
2.3540 |
113.381 |
|
C1 |
1.5699 |
N2 |
2.4450 |
26.238 |
|
|
Ni1 |
2.3540 |
N2 |
2.4450 |
87.732 |
|
|
Ni1 |
2.3540 |
N1 |
2.5670 |
138.350 |
|
|
N2 |
2.4450 |
N1 |
2.5670 |
52.545 |
|
|
N1 |
2.5670 |
O2 |
3.1136 |
147.959 |
|
|
N1 |
2.5670 |
Br3 |
3.2513 |
88.778 |
|
|
O2 |
3.1136 |
Br3 |
3.2513 |
60.344 |
|
|
O2 |
3.1136 |
O4 |
3.3260 |
55.607 |
|
|
Br3 |
3.2513 |
Br2 |
3.3401 |
0.415 |
|
|
O4 |
3.3260 |
Br1 |
3.7856 |
68.950 |
|
|
O4 |
3.3260 |
C3 |
3.8837 |
104.240 |
|
|
Br2 |
3.3401 |
O3 |
3.6104 |
41.659 |
|
|
O3 |
3.6104 |
C3 |
3.8837 |
25.148 |
|
|
N2 |
3.7160 |
Br1 |
3.7856 |
55.508 |
|
|
N2 |
3.7160 |
C3 |
3.8837 |
124.003 |
|
|
Br1 |
3.7856 |
C3 |
3.8837 |
172.426 |
|
|
O2 |
C2 |
1.6985 |
Ni1 |
2.2163 |
113.050 |
|
C2 |
1.6985 |
N3 |
2.5538 |
24.073 |
|
|
C2 |
1.6985 |
N2 |
3.7713 |
144.904 |
|
|
C2 |
1.6985 |
O5 |
3.8485 |
78.412 |
|
|
Ni1 |
2.2163 |
N3 |
2.5538 |
90.987 |
|
|
Ni1 |
2.2163 |
N4 |
2.5826 |
137.048 |
|
|
Ni1 |
2.2163 |
O5 |
3.8485 |
38.872 |
|
|
N3 |
2.5538 |
N4 |
2.5826 |
49.096 |
|
|
N3 |
2.5538 |
O4 |
3.0096 |
119.498 |
|
|
N3 |
2.5538 |
O5 |
3.8485 |
61.597 |
Table 5b: Selective bond lengths and angles for oxygen-type three (O3) and four (O4) inside crystal lattice of [Ni2(NCO)2(H2O)2(Br)2] complex.
|
Atom1 |
Atom2 |
d1-2 |
Atom3 |
d1-3 |
Angle^ 213° |
|
O3 |
C3 |
1.6531 |
Ni1 |
2.3788 |
115.812 |
|
C3 |
1.6531 |
Br3 |
2.4697 |
26.193 |
|
|
Ni1 |
2.3788 |
Br3 |
2.4697 |
90.396 |
|
|
Ni1 |
2.3788 |
Br2 |
2.4844 |
92.434 |
|
|
Br3 |
2.4697 |
Br2 |
2.4844 |
2.101 |
|
|
Br3 |
2.4697 |
Br1 |
2.5914 |
53.881 |
|
|
Br2 |
2.4844 |
Br1 |
2.5914 |
51.780 |
|
|
Br2 |
2.4844 |
N3 |
3.0939 |
81.686 |
|
|
Br1 |
2.5914 |
N3 |
3.0939 |
85.186 |
|
|
N3 |
3.0939 |
O5 |
3.1788 |
66.971 |
|
|
N3 |
3.0939 |
O2 |
3.4143 |
45.881 |
|
|
O5 |
3.1788 |
O2 |
3.4143 |
71.321 |
|
|
O5 |
3.1788 |
O6 |
3.4195 |
33.825 |
|
|
O6 |
3.4195 |
N2 |
3.4224 |
72.863 |
|
|
O6 |
3.4195 |
Br2 |
3.4545 |
77.670 |
|
|
N2 |
3.4224 |
Br2 |
3.4545 |
79.334 |
|
|
Br2 |
3.4545 |
Br3 |
3.4892 |
1.406 |
|
|
Br3 |
3.4892 |
C1 |
3.7954 |
98.048 |
|
|
O1 |
3.6104 |
C2 |
3.6560 |
79.927 |
|
|
O1 |
3.6104 |
C1 |
3.7954 |
24.311 |
|
|
C2 |
3.6560 |
C1 |
3.7954 |
103.535 |
|
|
O4 |
C4 |
1.6867 |
Ni1 |
2.3805 |
116.044 |
|
Ni1 |
2.3805 |
O2 |
3.0096 |
46.781 |
|
|
Ni1 |
2.3805 |
N2 |
3.3206 |
104.291 |
|
|
O2 |
3.0096 |
N2 |
3.3206 |
72.947 |
|
|
O2 |
3.0096 |
O1 |
3.3260 |
58.617 |
|
|
O2 |
3.0096 |
O5 |
3.5333 |
71.549 |
|
|
O2 |
3.0096 |
O5 |
3.6483 |
109.215 |
|
|
O2 |
3.0096 |
N3 |
3.7248 |
112.789 |
|
|
N2 |
3.3206 |
O1 |
3.3260 |
67.984 |
|
|
O1 |
3.3260 |
O5 |
3.5333 |
90.105 |
|
|
O5 |
3.5333 |
O5 |
3.6483 |
112.165 |
|
|
N3 |
3.7248 |
N1 |
3.8015 |
107.084 |
|
|
N3 |
3.7248 |
O6 |
3.8405 |
73.985 |
Table 5c: Selective bond lengths and angles for oxygen-type five (O5) and six (O6) inside crystal lattice of [Ni2(NCO)2(H2O)2(Br)2] complex
|
Atom1 |
Atom2 |
d1-2 |
Atom3 |
d1-3 |
Angle ^213° |
|
O5 |
O6 |
1.9333 |
Ni1 |
2.5380 |
76.180 |
|
O6 |
1.9333 |
O3 |
3.1788 |
79.928 |
|
|
Ni1 |
2.5380 |
O3 |
3.1788 |
47.565 |
|
|
O3 |
3.1788 |
N3 |
3.4616 |
55.343 |
|
|
N3 |
3.4616 |
O4 |
3.5333 |
86.911 |
|
|
O4 |
3.5333 |
N1 |
3.6039 |
140.302 |
|
|
O4 |
3.5333 |
O4 |
3.6483 |
110.280 |
|
|
N1 |
3.6039 |
C2 |
3.8820 |
129.654 |
|
|
N1 |
3.6039 |
C4 |
3.9892 |
82.932 |
|
|
O4 |
3.6483 |
N3 |
3.7458 |
74.220 |
|
|
O2 |
3.8485 |
C2 |
3.8820 |
25.380 |
|
|
O2 |
3.8485 |
C4 |
3.9892 |
72.740 |
|
|
C2 |
3.8820 |
C4 |
3.9892 |
55.599 |
|
|
O6 |
O5 |
1.9333 |
Ni1 |
2.7991 |
61.700 |
|
O5 |
1.9333 |
O3 |
3.4195 |
66.246 |
|
|
Ni1 |
2.7991 |
O3 |
3.4195 |
43.573 |
|
|
Ni1 |
2.7991 |
O4 |
3.8405 |
38.107 |
|
|
O3 |
3.4195 |
O4 |
3.8405 |
81.382 |
|
|
O3 |
3.4195 |
C4 |
3.8459 |
103.848 |
|
|
O3 |
3.4195 |
Br1 |
3.8722 |
71.947 |
|
|
O3 |
3.4195 |
N1 |
3.9880 |
140.086 |
|
|
O4 |
3.8405 |
C4 |
3.8459 |
25.352 |
|
|
C4 |
3.8459 |
Br1 |
3.8722 |
125.685 |
|
|
C4 |
3.8459 |
N1 |
3.9880 |
81.126 |
|
|
Br1 |
3.8722 |
N1 |
3.9880 |
73.355 |
Accurate analysis of these tabulated data enhance to understand why [Ni2(NCO)2(H2O)2(Br)2] complex is stable and valid specially at the point of view in which torsion on angles inside unit cell still within normal ranges [44,46 and ,47] recording minimum torsion (2.1° ) for angle Br2-O3-Br3 which is nearly linear and maximum is for C3-O1-Br1 which equal 172.4° , which is also very close to (180°) linear angle . As reported in [44,47] if the torsion on angle inside unit cell of crystal lattice within the normal range (5-10 %) of the angle value whatever the angle, is enhancing stability of the proposed structure .
Thermal analysis studies
The thermogravimetric analyses (TG/DTG/DSC) curves for the copper hydroxybromide, [Ni2(NCO)2(H2O)2(Br)2] and ZnCO3.xH2O in nitrogen atmosphere are illustrated in Figs 9. There is one step event leading to a total weight loss of 38% at 300 °C which attributed to the removal of hydrogen bromide and one water molecules. The final decomposition product was detected as copper(II) oxide. Also, The [Ni2(NCO)2(H2O)2(Br)2] complex has a sharp decomposition peak at 375 oC with weight loss about 24% due to the loss of the two coordinated water molecules, one nitrogen and on carbon monoxide molecules. The residual moieties consists of mixture from nickel(II) oxide and nickel(II) bromide contaminated with few carbon atoms. Additionally, Fig. 9 shows typical curves for thermogravimetric (TG), differential scanning calorimetry (DSC) and differential thermogravimetric analysis (DTG) of the decomposition of the zinc carbonated hydrate together with the mass spectra of the evolved gases at various temperatures. The thermal decomposition of the sample takes place in temperature ranges of 100-to-200 oC and 200-to-800 oC with mass loss corresponding to hydrated water molecules and carbon dioxide gas. Only the fragment ions of H2O and CO2 can be detected in the mass spectra during the course of the thermal decomposition.
![Fig. 9: TG/DTG/DSC curves of a- Cu2(OH)3Br, b- [Ni2(NCO)2(H2O)2(Br)2] and c- ZnCO3.H2O compounds](http://www.orientjchem.org/wp-content/uploads/2015/09/Vol31_No3_Synt_Khld_Fig9-150x150.jpg) |
Figure 9: TG/DTG/DSC curves of a- Cu2(OH)3Br, b [Ni2(NCO)2(H2O)2(Br)2] and c- ZnCO3.H2O compounds Click here to View figure |
References
- Feldman, D.; Barbalata, A. “Synthetic Polymers”, Chapman & Hall, London, 1996.
- Finar, I.L. “Organic Chemistry”, Longman group limited, London, 1973, p. 460.
- Rahman, M.J.; Bozadjiev, P.; Polovski, Y. Fert. Res. 1994, 38(2), 89.
- George, S.; Chellapandian, M.; Sivasankar, B.; Jayaraman, K. Bioprocess Eng. 1997, 16(2), 83.
- Wang, X.J.; Douglas, L.A. Agrochimica. 1996, 40(5-6), 209.
- Yerokun, O.A. S. Afr. J. plant soil. 1997, 14(2), 63.
- Heinig, R. SOFW J. 1996, 122(14), 998.
- Gnewuch, C.T.; Sosnovsky, G. Chem. Rev. 1997, 97(3), 829.
- Miyagawa, C.I. Drug Intell. & Clin. Pharma. 1986, 20, 527.
- Sugimura, M.; Kameyama, Y.; Hashimoto, T.; Kobayashi, T.; Muramatsu, M. Chem. Abs. 1990, 112, 63.
- Yamaguchi, A.; Miyazawa, T.; Shimanouchi, T.; Mizushima, S. Spectrochim. Acta. 1957, 10, 170.
- Stewart, J.E. J. Chem. Phys. 1957, 26, 248.
- Srivastava, P.C.; Aravindaksahn, C. Z. Phys. Chem. Leipzig. 1983, 264, 61.
- Schafer, M.; Curran, C. Inorg. Chem. 1966, 5, 256.
- Zarli, B.; Dall’Olio, G.; Sindellari, L. J. Inorg. Nucl. Chem. 1976, 38, 491.
- Barbier, J.P.; Hugel, R.P. J. Inorg. Nucl, Chem. 1977, 39, 2283.
- Barbier, J.P.; Hugel, R. Inorg. Chimica Acta. 1974, 10, 93.
- Teleb, S.M.; Refat, M.S.; Sadeek, S.A. Ukrainian Chem. J. 2004, 68(5), 35.
- Sadeek, S.A.; Refat, M.S. J. Coord. Chem. 2005, 58(18), 1727.
- Sadeek, S.A.; Refat, M.S.; Teleb, S.M. J. Korea, Chem. Soc. 2004, 48(4), 358.
- Refat, M.S.; Teleb, S.M.; Sadeek, S.A. Spectrochim. Acta A, 2004, 60, 2803.
- Refat, M.S.; Sadeek, S.A.; Teleb, S.M. J. Argen. Chem. Soc. 2004, 92(4-6), 23.
- Refat, M.S. Synth. React. Inorg. Met.-Org. Chem. 2004, 34(9), 1605.
- Nour, E.M.; Teleb, S.M.; Al-Khososy, N.A.; Refat, M.S. Synth. React. Inorg. Met-Org. Chem. 1997, 27(4), 505.
- Refat, M.S.; Sadeek, S.A. Latvian J. Chem. 2005, 4, 343.
- Refat, M.S.; Sadeek, S.A.; Nasr, D.E. Bull. Chem. Technolog. Maced. 2005, 24(2), 153.
- Teleb, S.M.; Refat, M.S. Bull. Chem. Technolog. Maced. 2006, 25(1), 57.
- Vogel, A.I. “Qualitative Inorganic Analysis”, John wiely & Sans, Inc. New York, 1987.
- Nakamoto, K. “Infrared and Raman Spectra of inorganic and coordination compounds“, 3rd edn (New York: Wiley Interscience), 1978.
- Penland, R.B.; Mizushima, S.; Curran, C.; Quagliano, J.V. J. Amer. Chem. Soc. 1957, 79, 1575.
- Yar, O.; Lessinger, L. Acta Crystallogr., Sect. C Cryst. Struct. Commun. 1995, C 51(11), 2282.
- Bruschini, C.S.; Hudson, M.J. Access in Nanoporous Materials; Pinnavaia, T.J.; Thorpe, M.F. eds.; Plenum Press: New York, 1995, p. 161.
- Pereira, D.C.; de Faria, D.L.A.; Constantino, V.R.L.; J. Braz. Chem. Soc. 2006, 17, 1651.
- Aguirre, J.M.; Gutiérrez, A.; Giraldo, O.; J. Braz. Chem. Soc. 2011, 22(3), 546.
- Secco, E.; Worth, G. Can. J. Chem. 1987, 65, 2504.
- Yamaguchi, A.; Miyazawa, T.; Shimanouchi, T.; Mizushima, S. Spectrochim. Acta. 1957, 10, 170.
- Boobekova, S.; Rysmendeev, K.R. Univ. Fiz.-Mat. Estestv-Nauk. 1969, 3, 84.
- Singh, P.P.; Pande, I.M. Can. J. Chem. 1972, 50, 2603.
- Davies, M.; Hallam, H.E. Trans. Faraday Soc. 1950, 47, 1170.
- Nakamoto, K. “Infrared and Raman Spectra of Inorganic and Coordination Compounds, Part A Theory and Applications in Inorganic Chemistry“, Wiley, New York, 2009.
- Singh, V.P. Spectrochim Acta Part A. 2008, 71, 17-22.
- Chughtai, A.R.; Keller, R.N. J. Inorg. Nucl. Chem. 1969, 31, 633.
- Kawamura, M.; Shimada, S. Inorg. Chim. Acta. 2007, 360, 2162.
- 44. Elsabawy, K.M.;Refat, M.S. J. Comput. Meth. Molecular Design. 2011, 1(4), 1-13.
- Wozniak, K.; Krygowski, T.M.; Kariuki, B.; Jones, W. J. Mol. Struct. 1991, 248, 331-343.
- Elsabawy, K.M. Cryogenics. 2011, 51, 452.
- Elsabawy, K.M.; El-Newehy, M.H. Appl. Surf. Science. 2011, 258, 1345.
- Sabolović, J.; Kaitner, B. Inorg. Chim. Acta. 2008, 361(8), 2418.

This work is licensed under a Creative Commons Attribution 4.0 International License.
![]()
A New Edition of Web of Science
Journal Impact Factor
2022: 0.5
Five Year: 0.8
Journal is Indexed in

Cabells Whitelist
![]()


