Irrigation Water Quality Evaluation of Aldelam Groundwater
Abdullah A. Alsheikh
Riyadh collage of technology Environment Technology Dept., P.O Box: 42826 Riyadh 11551 King dome of Saudi Arabia Correspondence Author Email: aalsheikh1@tvtc.gov.sa
DOI : http://dx.doi.org/10.13005/ojc/310357
Article Received on :
Article Accepted on :
Article Published : 31 Jul 2015
Good quality water helps to maintain agricultural productivity and sustain soil fertility. Agricultural activities in Saudi Arabia depend on surface water and groundwater as the main sources for irrigation. Groundwater is the main source used for irrigation purposes in this area. This study was done to evaluate the status of groundwater quality and its suitability for irrigated agriculture. To achieve this objective, water samples from fourteen wells were collected from different areas of Aldelam in May and July of 2011. The water quality of these wells in the study area was estimated from different water quality parameters such as chloride, bicarbonate, sodium, calcium, total dissolved solids (TDS), EC, pH, sodium adsorption ratio, and percentage of sodium. The results showed that the overall concentration of all the ions was very high, but the sodium hazard in the well water was moderate. About 78 percent of the wells had suitable water quality for boron, and they had a concentration below the permissible limit for crop irrigation. TDS in the groundwater ranged between 1114.88 to 2897.71 ppm during the investigation period. High EC and low SAR in all the wells showed that the water from these wells could be used for irrigation purposes with special management.
KEYWORDS:Groundwater; quality; boron; irrigation; Saudi Arabia
Download this article as:| Copy the following to cite this article: Alsheikh A. A. Irrigation Water Quality Evaluation of Aldelam Groundwater. Orient J Chem 2015;31(3). |
| Copy the following to cite this URL: Alsheikh A. A. Irrigation Water Quality Evaluation of Aldelam Groundwater. Orient J Chem 2015;31(3). Available from: http://www.orientjchem.org/?p=10122 |
Introduction
The quality of groundwater is determined by the physical and chemical characterization of groundwater, which is the major source of water for domestic, agricultural, and industrial purposes in many countries. Groundwater quality has recently begun to be of concern as the population has expanded and more water demands have to be provided. Intensive agricultural activities have increased the demand on groundwater resources in Saudi Arabia. There are no perennial streams or rivers in Saudi Arabia. Therefore, the main water sources are underground water aquifers, rainfall, and seawater desalination [1]. There are increasing needs for water, as there is rapid growth of population and agricultural activities are increasing around the country [2]. According to an estimate, more than 80% of the water demand in the agricultural sector is currently being met from non-renewable groundwater sources, which are the main source of irrigation water. About 90 % of it is consumed in agricultural activity [3]. To meet the growing demand of water for the domestic, industrial, and agricultural sectors, exploration of alternative sources of water, especially for use in agriculture, is important. In Saudi Arabia, there are increasing needs of water, as there is rapid growth of the population and agricultural activities are increasing around the country [2]. Saudi Arabia is an arid country with limited water supplies. About 80-85% of water supplies come from groundwater, which is essentially classified as a non-renewable water resource [4]. In arid regions such as Saudi Arabia, limited water resources (groundwater and surface water) and a sensitive desert environment are major features of its ecosystems. Saudi Arabia depends mainly on groundwater and sea water desalination to cover its needs for drinking water and irrigation [5].
The suitability of irrigation water depends upon many factors including the quality of the water, soil type, salt-tolerant characteristics of the plants, climate, and drainage characteristics of the soil [6]. The determination of major ions, such as carbonate, bicarbonate, magnesium, calcium, sulphate, and hardness are important to measure irrigation water quality [7]. Among the major cations are sodium, calcium, and magnesium, which influence the suitability of groundwater for human consumption, agricultural irrigation, and other purposes. Some crops are sensitive to boron, so it is often included in the analysis. Some of these cations are beneficial for crop production at low concentrations. Otherwise, they affect properties of soil, cause toxicity to plants, and make management practices difficult [8]. To deal with such problems, information concerning the quality of irrigation water and its effect on soils and crops is necessary. The importance of water quality becomes more significant in arid climates due to the lack of natural leaching of deposited salts and a high rate of evaporation [9]. Keeping in mind the importance of water quality assessment, a study regarding the groundwater quality of the Dalamm aquifer, Saudi Arabia, was carried out to classify groundwater from wells on the basis of different criteria. The quality of some water is not suitable for irrigating crops. Irrigation water must be compatible with both the crops and soils to which it will be applied. The total dissolved solid contents in groundwater may vary from 20 mg/l in areas of high rainfall to over 100,000 ppm in some desert brines of Karanth,[10].
In this study, because many of the wells are still in use the groundwater of the Aldelam area was evaluated for quality of irrigation water. The following were determined: total amount of dissolved salts (TDS) in the water, sodium adsorption ratio (SAR), sodium concentration (Na%), electrical conductivity (μmhos/cm), and amounts of individual chemicals, such as, chloride (Cl), sodium (Na), nitrate (NO3), calcium (Ca), potassium (K), magnesium (Mg), boron (B), iron (Fe), and sulfate (SO4). They were measured to identify the characteristics that are important for plant growth, to determine acceptable levels of concentrations, and to choose irrigation techniques to avoid crop damage. In the future, water demand for agricultural developments in the Aldelam area will have to come from local groundwater resources.
Materials and Methods
Study area
The study area was located between longitudes 47° 6′ 23.00″E and 47° 10′ 7.82″ E and 23°49′ 36.50″ N and 24° 3′ 17.14″ N (Fig. 1). It is located in the middle part of Saudi Arabia, south of Riyadh, Saudi Arabia’s capital. The map of Aldelam is shown in Figure 1. Most of the people of the area meet their demands for irrigation, drinking, and domestic water supply by tapping the deep aldelam aquifer. Depths of the monitoring wells ranged from 100 to 700 m below the surface.
The Aldelam area is a flat plain and it has many farms. It is covered by alluvial deposits belonging to the quaternary period, and the Aldelam aquifer constitutes the principal groundwater aquifer of the area. These deposits are gravel, sand, clay, and sabkha. The climate of the region is an arid type with low winter rain and a dry, very hot summer. The most important economic activity of this area is agriculture, and the major crops are date trees and alfalfa. The irrigation system is mostly fed by the deep groundwater
Water sampling, processing, and analysis
Field research was conducted to evaluate the suitability of groundwater for irrigated agriculture of the Aldelam area. A total of 14 groundwater samples were collected from various sites based on a field survey. Figure 1 shows the groundwater sampling locations zones. The experimental design was a randomized complete block. Groundwater samples were collected during the months of May and July in the year of 2011. The samples were taken from the wells after pumping them about 30 minutes, and then the samples were collected in clean polyethylene bottles. Prior to collection, the sample bottles were rinsed three to four times using sampling water. The water samples were taken by pumping, so the sample was representative and contamination from the surface was avoided. The samples were stored in an ice box during transportation. Collected samples were transported to the laboratory the same day and stored at 4◦C. Some parameters, including electrical conductivity (EC) and pH, were measured in the field immediately after the collection of the samples using portable field meters.
The TDS values displayed by the conductivity/TDS meter were calculated from the specific conductance of the groundwater and could be approximated by the following equation (e.g., [11] :
TDS = ke EC (1)
Where TDS is expressed in milligrams per liter and EC is the electrical conductivity in microsiemens per centimeter at 25 ৹C (specific conductance). The correlation factor ke varies between 0.55 and 0.8. The ke for samples measured using the conductivity/ TDS meter in this study was 0.64 regressed from the TDS vs. specific conductance data. Each sample was divided into two portions: one for cation analysis and the other for anion analysis.
The chemical analyses of the groundwater samples were carried out at the Faculty of King-Abdulaziz-City-for-Science-and-Technology, where the samples for cation analysis were filtered at 0.45 µm and preserved (pH < 2) using ultrapure HCl in the laboratory. And also samples for anions were filtered through 0.45 µm. Anion constituents were analyzed by ion chromatography (IC, DX-120, DIONEX), and other cationic constituents were analyzed by ICP-MS (Ultramass 700, Varian), AA (5100PC, Perkin Elmer), and ICP (ICP-IIIS, Shimadzu) following USEPA standard methods.
Ground water quality
Various irrigational parameters used to evaluate quality of irrigation water for sustainability of agriculture use are: sodium adsorption ratio (SAR) and percentage of sodium (Na %). SAR is defined by Karanth [10]. It was estimated by the following formula :
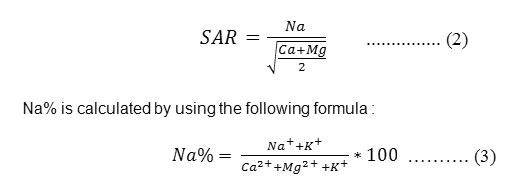
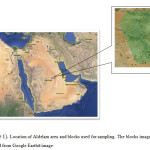 |
Figure1: Location of Aldelam area and blocks used for sampling. The blocks image was obtained from Google Earth® image. Click here to View figure |
Results and Discussion
The groundwater from the study area showed that it had no color, odor, or turbidity. The results of the chemical analysis of groundwater samples of the study area of Aldelam are presented in Table 1, and the statistical parameters like minimum, maximum, mean, and the standard deviation values of the water samples also are given in Table 1. The data of the chemical results showed a considerable variation, which reflected their chemical composition.
Table 1 shows that the pH of groundwater in this area ranges from 7.33 to 8.11 with an average of 7.69. Inspection of these values (Table 1) reveals that all samples lie within the permissible range of 6.0 – 8.5 [12], [13] .
Electrical Conductivity (EC)
Electrical conductivity is an indication of the concentration of total dissolved solids and major ions in a given irrigation and drinking water body. The well water samples showed a wide variation in the samples collected from the same area, and they ranged between 1742 and 4572 μS/cm with an average value of 2904.64 μS/cm. It is easy to presume from the EC values (Table 1) that the irrigation water of the study area is unsuitable for irrigation purposes as it falls under the category of high to very high salinity. Salinization in the end makes groundwater inadequate for the growth and productivity of many crops [14]. Based on the EC values, we found that 64.29 % of the wells are in the range of 1500-3000 micromhos/cm and 35.71 % of the wells are above 3000 micromhos/cm (Table 2). The EC values of the majority of the samples are higher than the permissible limit [1]. High EC in water leads to formation of saline soil, whereas high Na content in water causes alkaline soil [15].
Table 1: Chemical composition of groundwater of the Aldelam area.
|
well NO |
pH |
EC |
TDS |
Na |
K |
Mg |
Ca |
F |
Br |
NO3 N |
SO4 |
SAR |
|
µS/cm |
ppm |
ppm |
ppm |
ppm |
Ppm |
ppm |
Ppm |
ppm |
ppm |
|||
|
1 |
7.66 |
2203.00 |
1409.92 |
76.67 |
6.67 |
57.67 |
181.00 |
11.86 |
Nil |
83.50 |
651.14 |
7.02 |
|
2 |
7.47 |
4527.67 |
2897.71 |
180.33 |
17.33 |
95.67 |
189.67 |
10.46 |
Nil |
59.59 |
660.41 |
15.10 |
|
3 |
7.56 |
1775.67 |
1136.43 |
82.00 |
7.33 |
41.67 |
131.67 |
13.05 |
Nil |
80.18 |
280.59 |
8.81 |
|
4 |
7.42 |
2184.33 |
1397.97 |
191.33 |
10.67 |
93.33 |
191.33 |
10.14 |
25.74 |
92.96 |
591.27 |
16.04 |
|
5 |
7.53 |
1742.00 |
1114.88 |
85.33 |
18.00 |
33.33 |
129.67 |
12.98 |
Nil |
50.85 |
474.03 |
9.45 |
|
6 |
7.33 |
2496.00 |
1597.44 |
164.00 |
9.00 |
101.00 |
199.67 |
11.81 |
Nil |
114.10 |
637.19 |
13.38 |
|
7 |
7.42 |
2302.00 |
1473.28 |
159.67 |
11.67 |
80.33 |
187.67 |
10.02 |
Nil |
79.28 |
534.12 |
13.79 |
|
8 |
7.88 |
3800.00 |
2432.00 |
202.67 |
14.00 |
101.67 |
410.33 |
9.71 |
Nil |
69.42 |
949.13 |
12.67 |
|
9 |
7.77 |
3764.67 |
2409.39 |
232.00 |
11.00 |
95.67 |
371.67 |
16.72 |
26.43 |
189.11 |
477.15 |
15.18 |
|
10 |
7.88 |
4043.33 |
2587.73 |
162.67 |
10.00 |
117.00 |
463.37 |
11.47 |
Nil |
60.11 |
1240.56 |
9.55 |
|
11 |
7.84 |
2750.67 |
1760.43 |
184.33 |
11.33 |
79.00 |
251.00 |
11.17 |
Nil |
64.08 |
397.86 |
14.35 |
|
12 |
7.88 |
4043.33 |
2587.73 |
169.00 |
9.33 |
113.33 |
469.33 |
13.83 |
26.05 |
70.05 |
1615.95 |
9.90 |
|
13 |
8.11 |
2570.67 |
1645.23 |
175.33 |
14.33 |
92.33 |
191.33 |
11.81 |
Nil |
114.06 |
636.98 |
14.72 |
|
14 |
7.89 |
2461.67 |
1575.47 |
144.00 |
9.00 |
102.33 |
209.33 |
11.86 |
Nil |
114.51 |
639.50 |
11.54 |
| Mean |
7.69 |
2904.64 |
1858.97 |
157.81 |
11.40 |
86.02 |
255.50 |
11.92 |
26.07 |
88.70 |
698.99 |
12.25 |
| Median |
7.72 |
2533.34 |
1621.33 |
166.50 |
10.84 |
94.50 |
195.50 |
11.81 |
26.05 |
79.73 |
637.09 |
13.02 |
| Std. dev. |
0.24 |
931.00 |
595.84 |
46.51 |
3.41 |
25.34 |
119.47 |
1.83 |
0.35 |
35.81 |
352.57 |
2.85 |
| Minimum |
7.33 |
1742.00 |
1114.88 |
76.67 |
6.67 |
33.33 |
129.67 |
9.71 |
25.74 |
50.85 |
280.59 |
7.02 |
| Maximum |
8.11 |
4527.67 |
2897.71 |
232.00 |
18.00 |
117.00 |
469.33 |
16.72 |
26.43 |
189.11 |
1615.95 |
16.04 |
Table2: Classification of groundwater from conductivity values.
| Conductivity range micromohs/cm | Classification | No. of sample | Percentage of samples |
| < 1500 | Permissible | 0 | 0 |
| 1500-3000 | Not permissible | 9 | 64.29 |
| > 3000 | Hazardous | 5 | 35.71 |
The total dissolved solids (TDS)
The total dissolved solids are the concentrations of all dissolved minerals in water, and they indicate the general nature of salinity of the water. In all wells, the TDS values ranged from 1114.88 to 2897.71 ppm with an average of 1858.97 ppm (Table 3). According to the salinity classification of Davis and De Wiest [16], the results showed that one hundred per cent of the samples fell under the water category of slightly saline.
TDS concentrations above 1000 ppm cause yield declines for salt-sensitive crops and, around 3000 ppm, even salt-tolerant plants can exhibit significant yield declines [12]. Dissolved solids can also contribute to clogging problems in drip irrigation systems [12]. High and very high salinity water is not suitable for irrigation under ordinary conditions, but may be used occasionally under very special circumstances. The soils must be permeable, drainage must be adequate, irrigation water must be applied in excess to provide considerable leaching, and plants with very good salt tolerance should be selected [15]. It is also important to consider the TDS in water, because many of the toxic solid materials may cause harm to plants [17].
Table3: Classification of water based on TDS. Source: (Davis and Wiest, 1996)
|
SI. No |
Water Condition |
Value in ppm |
Number of samples |
Percentage of samples |
| 1 | Frish Water |
Less than , 1000 |
0 |
0 |
| 2 | Slightly Saline |
1000 to 3000 |
14 |
100 |
| 3 | Moderated Saline |
3000 to 10000 |
0 |
0 |
| 4 | Very Saline |
10000 to 35000 |
0 |
0 |
| 5 | Brine |
More than 35000 |
0 |
0 |
Sodium Absorption Ratio (SAR)
SAR is important to plant growth because its magnitude is an indication of the availability of soil pore water to plant roots [18]. The sodium hazard of the irrigation water can be evaluated using SAR, which is calculated from Ca, Mg, and Na contents. SAR is an important parameter for determining suitability of groundwater for irrigation, because it is a measure of alkali / sodium hazards to crops [15]. The sodium adsorption ration (SAR) content in the study area showed variation from 7.02 to 15.18 with an average value of 12.25 (Table 1). The values of the SAR showed that 35.71% of groundwater samples of the wells were less than 10, which indicated excellent quality for irrigation and samples fell in the excellent (S1) category, while 64.29 % of groundwater samples of the wells fell within range for SAR of 10-18, which indicated good quality for irrigation and the samples fell in the good (S2) category (Table 4).
In Figure 2, we plot SAR and electrical conductivity (EC) using the U.S. Salinity Laboratory (USSL) salinity diagram [15].
The water quality of samples from the study area showed that about 35.85% of the samples fell in the C4-S4 category (very high salinity with very high alkalinity hazard), 35.71% of the samples fell in the category C4-S3 (very high salinity with high alkalinity hazard), and 21.42% of the samples fell in the category C3-S2 (high salinity with medium alkalinity hazard). These classifications for groundwater samples showed that they had high to very high salinity hazards with medium alkali hazards.
The higher the SAR values in the water, the greater the risk of sodium, which leads to the development of an alkaline soil [19], while a high salt concentration in water leads to formation of saline soil. These results are similar to those found by Saeed et al. [20]. They found SAR values lower than 15 and high EC values in the Jilh aquifer.
Table4: Classification of water based on USSL sodium hazard for irrigation
| Sodium hazard class | Rang | Water Class |
Number of samples |
Percentage of samples |
| S1 | < 10 | Excellent |
5 |
35.71 |
| S2 | 10-18 | Good |
9 |
64.29 |
| S3 | 18-26 | Doubtful |
0 |
0.00 |
| S4 | >26 | Unsuitable |
0 |
0.00 |
Sodium concentration (Na %)
Sodium concentration is important in classifying irrigation. The suitability of water for irrigation is based on Na%. Sodium is an important cation, which in excess deteriorates the soil structure and reduces crop yield [21];[22] .When the concentration of sodium is high in irrigation water, it will tend to be adsorbed by clay particles displacing Mg2+ and Ca2+ ions. This exchange process of sodium in water for Mg2+ and Ca2+ ions in soil reduces the permeability and finally results in soil with poor internal drainage. Na% results are given in Table 5, and they showed that 78.6 % of the wells had a good irrigation water quality, while 21.4 % of the wells had permissible irrigation water quality.
Table5: Suitability for irrigation based on Na%
|
Na% |
Suitability for irrigation |
Number of samples |
Percentage |
| <20 | Excellent |
Nil |
Nil |
| 20-40 | Good |
11 |
78.6 |
| 40-60 | Permissible |
3 |
21.4 |
| 60-80 | Doubtful |
Nil |
Nil |
| >80 | Unsuitable |
Nil |
Nil |
![Fig (2). Classification of groundwater samples of study area from [15].](http://www.orientjchem.org/wp-content/uploads/2015/07/Vol31_No3_Comb_Sate_Fig2-150x150.jpg) |
Figure2: Classification of groundwater samples of study area from [15]. Click here to View figure |
Correlation matrix for the water quality parameters:
Correlation analysis is a preliminary descriptive technique to estimate the degree of association among the variables involved. Correlation matrix between the different chemical parameters of groundwater of the wells samples are shown in Table 6. A high positive correlation is observed between TDS and EC because conductivity increases as the concentration of all dissolved constituents/ions increases. pH does not show any significant correlation between the pH and all other parameters, except boron (Table 6).
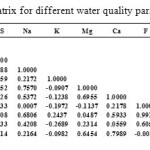 |
Table6: Correlation matrix for different water quality parameters Click here to View table |
Conclusion
A study of water samples collected from 14 wells of the Aldelam area, south of Riyadh, indicated that water from most of the wells can be used for application to the fields. The salinity of the water in the wells showed that 78.37 % of the EC values were greater than 1500 micromohs/cm. Medium salinity class is good for the plants with moderate salt tolerance and can be used, but special practices and special management are required for salinity control. Groundwater of the study area contained undesirable level of TDS. The data indicated that application of fertilizer for agriculture will contribute to higher concentration of ions in aquifer of Aldelam.
References
- Hussain, G.; Alquwaizany, A.; and Al-Zarah A. Guidelines for Irrigation Water Quality and Water Management in The Kingdom of Saudi Arabia: An Overview. Journal of Applied Sciences. 2010, 10(2), 79-96.
- Al-Ahmadi. M.E. Groundwater investigation in Hadat Ash Sham area, Western Saudi Arabia. J. Environ. Sci. 2005, 29, 21-36.
- Al-Turki A.; Abdel-Nasser G.; Al-Faraj A.; Shahwan A.; Al-Malik A . Evaluation of well water quality in Southern Tihama plain, Saudi Arabia. Food Science and Agricultural Resources Center, King Saud University (in Arabic). 2011, Resources Bulletin No (172), 5–47.
- Al-Ibrahim A. Excessive Use of Groundwater Resources in Saudi Arabia: Impacts and Policy Options Ambio,1991, 20, No. 1 , 34-37.
- Saud AG.; Abdullah SA. Water Resources and Reuse in AlMadinah. The International Conference on Water Conservation in Arid Regions (ICWCAR’09). Organized by Water Research Center – King Abdulaziz University. Jeddah – Saudi Arabia. 2009, 12–14.
- Michael, A.M., Irigation: Theory and Practice, Vikas Publishing House Pvt. Ltd., New Delhi, p. 801 (1990).
- Choudhary P.; Dagankar A. and Praveen S. Physiochemical analysis of groundwater for evaluation of drinking water quality at Dhar, M.P., National environmental and Pollution Technology, Technoscience Pub. 2007, 6 (1), 109-112.
- Mitra B.K., Sasaki C., Enari K., Matsuyama M. and Pongpattanasiri S., Ground water quality in sand dune area of Northwest Honshu Island in Japan,Journal of Agronomuy, . 2007, 6(1),81- 87.
- Qayyum, M.A. Tubewell Water Quality in Relation to Crop and Soil Management in SCARP-I. Pakistan Water and Power Development Authority, Bhalwal.1970.
- Karanth, K.R. Ground water assessment, development and management. Tata McGraw Hill, New Delhi. 1987, p720.
- Lloyd, J.W., Heathcote, J.A.,. Natural Inorganic Hydrochemistry in Relation to Groundwater. Clarendon Press, Oxford, England. 1985.
- Food and Agricultural Organization of the United Nations (FAO). Water Quality for Agriculture. Draft revision of Irrigation and Drainage, Rom. 1985, p. No. 29.
- UCCC, Guidelines for Interpretations of water Quality for Irrigation. Technical Bulletin, University of California Committee of Consultants, California, U.S.A.1974, p. 20-28.
- El Moujabber M.; Bou Samra B.; Darwish T.; Atallah T.Comparison of different indicators for groundwater contamination by seawater intrusion on the Lebanese coast. Water Resour Manage. 2006, 20:161–180
- Richards, L. A. Diagnosis and improvement of saline and alkali soils. Washington: US Dept. of Agriculture, Agri. Hand book. 1954,60.
- Davis, S.N.; and De Wiest . “Hydrogeology”, John Wiley & Sons, New York, P. 463. (1996).
- Matthess, G. The Properties of Ground Water, John Wiley and Sons, New York, USA. p. 397. (1982).
- Weiner, E.RApplications of Environmental Aquatic Chemistry: A Practical Guide, 3rd Edition, CRC Press, Taylor and Francis Group, Boca Raton, FL. (2013).
- Todd, D. Ground water hydrology (2nd ed.). New York:Wiley. (1980).
- Saeed, M.M.; M. Ashraf and M. Iqbal.. Assessment of regional groundwater quality for irrigation: A case study of Jilh Aquifer in Saudi Arabia. J. Drainage Water Manage. 2001.5: 9-18.
- Narsimha A.; Sudarshan V.; Srinivasulu P.; Vishnu B.; Ramana Kumar M ,Niranjan S .; Kumar S. Water Research &, Development. (2012), 2 (3), 68-75.
- Narsimha A.; Sudarshan V.; Swathi P. International Journal of Research in Chemistry and Environment. 2013, 3 (2)196-200.

This work is licensed under a Creative Commons Attribution 4.0 International License.
![]()
A New Edition of Web of Science
Journal Impact Factor
2022: 0.5
Five Year: 0.8
Journal is Indexed in

Cabells Whitelist
![]()


