Sargassum Wightii Extract as a Green Inhibitor for Corrosion of Brass in 0.1 N Phosphoric AcidSolution
R. Selva Kumar12* and V. Chandrasekaran3
1Research Scholar (PT), Department of Chemistry, Bharathiar University, Coimbatore-641 046, Tamil Nadu, India,
2Department of Chemistry, Sree Krishna Polytechnic College, Nagercoil-629 003, Tamil Nadu, India.
3Department of Chemistry, Govt. Arts College (Autonomous), Salem – 636 007, Tamil Nadu, India.
DOI : http://dx.doi.org/10.13005/ojc/310239
Article Received on :
Article Accepted on :
Article Published : 04 Jun 2015
The effect of marine algae Sargassum wightii extract on corrosion inhibition of brass in phosphoric acid was investigated by weight-loss method, potentiodynamic polarization and electrochemical impedance spectroscopy studies. The inhibition efficiency is found to increase with increasing concentration of extract and decreases with rise in temperature. The inhibitive effect could be attributed to the phytochemical constituents present in the inhibitor containing N, S, O atoms. The activation energy, thermodynamic parameters (free energy, enthalpy and entropy change) and kinetic parameters (rate constant and half-life) for inhibition process were calculated. These thermodynamic and kinetic parameters indicate a strong interaction between the inhibitor and the brass surface. The inhibition is assumed to occur via adsorption of inhibitor molecules on the brass surface, which obeys Temkin adsorption isotherm. The adsorption of inhibitor on the brass surface is exothermic, physical, and spontaneous, follows first order kinetics. The polarization measurements showed that the inhibitor behaves as a mixed type inhibitor. Inhibition efficiency values were found to show good trend with weight-loss method, potentiodynamic polarization and electrochemical impedance spectroscopy studies. Surface study techniques (FT-IR and SEM) were carried out to ascertain the inhibitive nature of the algal extract on the brass surface.
KEYWORDS:Brass; Phosphoric acid; Sargassum wightii; Inhibition; Polarization; Isotherm
Download this article as:| Copy the following to cite this article: Kumar R. S, Chandrasekaran V. Sargassum Wightii Extract as a Green Inhibitor for Corrosion of Brass in 0.1 N Phosphoric Acid Solution. Orient J Chem 2015;31(2). |
| Copy the following to cite this URL: Kumar R. S, Chandrasekaran V. Sargassum Wightii Extract as a Green Inhibitor for Corrosion of Brass in 0.1 N Phosphoric Acid Solution. Available from: http://www.orientjchem.org/?p=9016 |
Introduction
Phosphoric acid (H3PO4) is a major chemical product, which has many important uses especially in the production of fertilizers. Most of the acid is produced from phosphate rock by wet process. Brass and stainless steel are frequently used in many parts of the wet process and a considerable quantity of data has been published about the resistance of these materials to corrosion by acid solutions [1,2]. Most of the previous studies were focused on the inhibition of metals in HCl or H2SO4 solutions using organic compounds containing N, S, O atoms as corrosion inhibitors [3-5]. A lot of research has been done with naturally occurring substances since they are known to be eco-friendly and with little or no side effect on the humans. Among the naturally occurring substances reported in the corrosion study of metals like brass, aluminium, tin and mild steel, there leave extracts, gums and exudates, dyes, oils from plant materials, plant seeds and fruits, and anti-bacterial drugs. Plant extracts like the extract of cocos nucifera-coconut palm-petiole [6]; Musa Paradisiaca [7]; Mentha Pulegium [8]; Treculia Africana leaves [9] and Lupinus varius leaves [10] have been studied and established their corrosion inhibition effects. They were all found to be good corrosion inhibitors with no effect on the environment.
In the present study, the effect of addition of marine algae Sargassum wightii extract on corrosion inhibition of brass in 0.1 N phosphoric acidsolutions at different temperatures and various time intervals have been investigated by weight-loss method, potentiodynamic polarization and electrochemical impedance spectroscopy studies. The weight loss measurements aimed to predict the inhibition efficiency on brass corrosion and the adsorption isotherm, thermodynamic and kinetic feasibility of inhibition via surface coverage on brass by adsorbed SWE. The inhibition type and inhibition efficiency were determined from the polarization measurements and impedance spectroscopy studies. Surface analytical techniques (FT-IR and SEM) were carried out to ascertain the inhibitive nature of the algal extract on the brass surface.
Meterial and methods
Materials
Weigh-loss Measurement
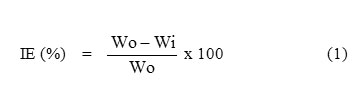
Measurements of weight changes were performed with rectangular brass specimens (length: 5 cm, width: 1 cm, and thickness: 0.3 cm). The specimens with same dimensions were immersed in 100 ml of 0.1 N H3PO4 solutions with and without different concentrations (0.0001 % to 0.0005 %) of SWE and allowed stand for 3 h and 6 h at various temperatures were as follows: 300 K, 318 K, 328 K, and 338 K. At 300 K the specimens were immersed for immersion time of 24, 48, 72, and 96 h. Then, the specimens were rinsed with distilled water and adherent corrosion products for 20 s. Then, the specimens were rinsed with water, cleaned with acetone and dried. The percentage of inhibition efficiency (IE) over the exposure period was calculated using the following equation (1) [12]:
The chemical composition (weight percent) of the brass used in the present study was 71.5 % Cu, 28.38 % Zn, 0.07 % Pb, and 0.05 % Fe. The geometry of the specimens for weight-loss experiments was as follows: The brass specimens were polished mechanically with different grades of emery papers (1/0 to 4/0) and were thoroughly washed with double distilled water then degreased in acetone and dried. The solutions were prepared from analar grade chemicals using double distilled water. Phosphoric acid solution (H3PO4) was used as a corrosion medium. The inhibitor Sargassum wightii extract (SWE) was extracted with ethanol using soxhelt extractor from marine algae Sargassum wightii.
The chemical structure of some active compounds separated [11] from Sargassum wightii are shown in Scheme-1.
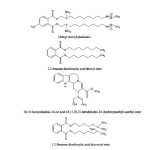 |
Scheme1: Chemical structure of some active compounds separated from Sargassum wightii |
where Wo and Wi are the rate of corrosion for brass with and without inhibitor, respectively.
Potentiodynamic Polarization Studies
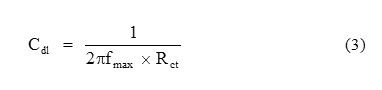
The potentiodynamic polarization studies were carried out with brass strips having an exposed area of 1 cm2. The cell assembly consisted of brass as working electrode, a platinum foil as counter electrode and a saturated calomel electrode as a reference electrode. Polarization studies were carried out using a potentiostat/galvanostat (Model BAS-100A) at 300 K. The working electrode was immersed in a 0.1 N H3PO4 and allowed to stabilize for 30 min. Each electrode was immersed in a 0.1 N H3PO4 in the presence and absence of different concentrations of inhibitor to which a current of 1.5 mA/cm2 was applied for 20 minutes to reduce oxides. The cathodic and anodic polarization curves for brass specimen in the test solution with and without various concentrations of the inhibitor were recorded by scanning the potential range +200 from the corrosion potential at a sweep rate of 1 mV/s. The inhibition efficiencies were determined from corrosion currents using the Tafel extrapolation method. The corrosion inhibition efficiency (IE) was calculated from the following equation (2):
where icorr and icorr(i) are the corrosion current density values without and with inhibitor, respectively.
Electrochemical Impedance Spectroscopy Studies
The electrochemical impedance spectroscopy measurements are carried out with well polished brass electrode introduced into 100 ml of test solution using a Solartron electrochemical measurement unit (1280B). After the determination of the steady-state current at a corrosion potential, sine wave voltage (10 mV) peak to peak, at frequencies between 10 MHz and 10 KHz are superimposed on the rest potential. Computer programs automatically controlled the measurements performed at rest potential after 30 minutes of exposure at 300 K. The impedance diagrams are given in the Nyquist representation. From the Nyquist plot, the charge transfer resistance (Rct) and double layer capacitance (Cdl) values were calculated.
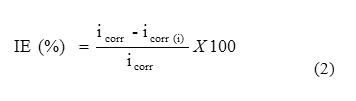
The charge transfer resistance values were obtained from the plots of Z’ vs Z”. The values of (Rs + Rct) correspond to the point where the plots cuts Z’ axis at low frequency and Rs corresponds to the point where the plot cuts Z’ axis at high frequency. The difference between Rct and Rs values give the charge transfer resistance (Rct) values. The Cdl values were obtained from the following equation (3):
where Cdl is double layer capacitance, Rct is charge transfer resistance and fmax is frequency at Z” value maximum.
The inhibition efficiency (IE %) from the electrochemical impedance measurement was calculated using the following equation (4):
where Rct andRct(i) are the charge transfer resistance in the absence and presence of inhibitor respectively.
Surface Study
The brass specimen was immersed in 0.1 N H3PO4 in the presence of inhibitor for 6 h at 300 K. After 6 h the specimen was taken out and dried. The nature of the film formed on the brass surface was analyzed by FT-IR Perkin Elmer-1600 spectrometer. SEM images were recorded with a Hitachi 3000H Microscope from the dried film formed on the surface of the brass specimens taken from 0.1 N H3PO4 in the presence and absence of inhibitor immersed for 6 h at 300 K.
Results and Discussion
Weigh-loss Method
Table-1 shows the inhibition efficiency values of brass by weight-loss measurements at different inhibitor concentrations of SWE in 0.1 N H3PO4 for different immersion times and temperatures. It has been observed that the inhibition efficiency increases with increase in concentration of inhibitor and decreases with increase in temperature and immersion time. The maximum IE (94.74 %) of inhibitor was achieved at 0.0005 % of inhibitor at 300 K for 3 h. This result suggests that an increase in extract concentration increases the number of inhibitor molecules absorbed onto the brass surface and reduces the surface area that is available for the direct acid attack on the metal surface [8].
Table1: Calculated inhibition efficiency (IE) and surface coverage (SC) values for SWE on brass corrosion in 0.1 N H3PO4 for different immersion temperatures and times
|
Conc. of inhibitor (%) |
For 3 h |
For 6 h |
At 300 K |
|||
|
SC (θ) |
IE (%) |
SC (θ) |
IE (%) |
SC (θ) |
IE (%) |
|
|
At 300 K |
24 h |
|||||
|
0.0000 |
0 |
0 |
0 |
0 |
0 |
0 |
|
0.0001 |
0.5790 |
57.90 |
0.2692 |
26.92 |
0.3636 |
36.36 |
|
0.0002 |
0.6316 |
63.16 |
0.3462 |
34.62 |
0.3896 |
38.96 |
|
0.0003 |
0.6842 |
68.42 |
0.3846 |
38.46 |
0.4286 |
42.86 |
|
0.0004 |
0.8421 |
84.21 |
0.5000 |
50.00 |
0.4805 |
48.05 |
|
0.0005 |
0.9474 |
94.74 |
0.6539 |
65.39 |
0.5455 |
54.55 |
|
At 318 K |
For 48 h |
|||||
|
Blank |
0 |
0 |
0 |
0 |
0 |
0 |
|
0.0001 |
0.5238 |
52.38 |
0.2121 |
21.21 |
0.2528 |
25.28 |
|
0.0002 |
0.5714 |
57.14 |
0.2727 |
27.27 |
0.2697 |
26.97 |
|
0.0003 |
0.6667 |
66.67 |
0.3636 |
36.36 |
0.2865 |
28.65 |
|
0.0004 |
0.7143 |
71.43 |
0.4546 |
45.46 |
0.3371 |
33.71 |
|
0.0005 |
0.7619 |
76.19 |
0.5758 |
57.58 |
0.4157 |
41.57 |
|
At 328 K |
For 72 h |
|||||
|
Blank |
0 |
0 |
0 |
0 |
0 |
0 |
|
0.0001 |
0.4167 |
41.67 |
0.1786 |
17.86 |
0.2110 |
21.10 |
|
0.0002 |
0.4583 |
45.83 |
0.2321 |
23.21 |
0.2363 |
23.63 |
|
0.0003 |
0.5833 |
58.33 |
0.2679 |
26.79 |
0.2490 |
24.90 |
|
0.0004 |
0.6667 |
66.67 |
0.3036 |
30.36 |
0.2954 |
29.54 |
|
0.0005 |
0.7083 |
70.83 |
0.4107 |
41.07 |
0.3544 |
35.44 |
|
At 338 K |
For 96 h |
|||||
|
Blank |
0 |
0 |
0 |
0 |
0 |
0 |
|
0.0001 |
0.2647 |
26.47 |
0.1493 |
14.93 |
0.1581 |
15.81 |
|
0.0002 |
0.3235 |
32.35 |
0.1791 |
17.91 |
0.1733 |
17.33 |
|
0.0003 |
0.4412 |
44.12 |
0.2239 |
22.39 |
0.1854 |
18.54 |
|
0.0004 |
0.5588 |
55.88 |
0.2836 |
28.36 |
0.2188 |
21.88 |
|
0.0005 |
0.6177 |
61.77 |
0.3881 |
38.81 |
0.2736 |
27.36 |
Thermodynamic and Kinetic Analysis
The adsorption of the organic compounds can be described by two main types of interactions: physical adsorption and chemisorptions. They are influenced by the nature of the charge of the metal, the chemical structure of the inhibitor, pH, the type of the electrolyte and temperature [6].
Activation Energy
In order to elucidate the inhibitive properties of the inhibitor and the temperature dependence on the corrosion rates, the energy of activation for the corrosion process in the absence and presence of the inhibitor was evaluated from the following Arrhenius equation (5) [13] and the values obtained are presented in Table-2:where p1 and p2 are rate of corrosion at temperatures T1 and T2 respectively.
Table2: Calculated activation energy (Ea), free energy of adsorption (∆Gads), enthalpy change (∆H), entropy change (∆S) values for SWE on brass corrosion in 0.1 N H3PO4 at 300 K
|
Conc. of inhibitor (%) |
Ea from equation (kJ/mol) |
Ea from Arrhenius Plot (kJ/mol) |
∆Gads (kJ/mol) |
∆H (kJ/mol) |
∆S (mol/kJ) |
|
For 3 h |
|||||
|
Blank |
12.91 |
12.98 |
0 |
0 |
0 |
|
0.0001 |
25.28 |
16.51 |
-29.47 |
-24.78 |
0.0156 |
|
0.0002 |
26.39 |
27.35 |
-27.62 |
-24.67 |
0.0098 |
|
0.0003 |
25.58 |
31.92 |
-26.43 |
-24.62 |
0.0060 |
|
0.0004 |
35.72 |
35.49 |
-24.50 |
-24.59 |
0.0028 |
|
0.0005 |
56.94 |
42.55 |
-21.50 |
-24.52 |
0.0005 |
|
For 6 h |
|||||
|
Blank |
21.00 |
16.76 |
0 |
0 |
0 |
|
0.0001 |
24.38 |
22.53 |
-28.94 |
-24.72 |
0.0141 |
|
0.0002 |
26.05 |
23.94 |
-27.56 |
-24.70 |
0.0095 |
|
0.0003 |
26.15 |
27.36 |
-26.66 |
-24.67 |
0.0066 |
|
0.0004 |
28.98 |
28.72 |
-26.08 |
-24.66 |
0.0047 |
|
0.0005 |
33.65 |
34.19 |
-25.27 |
-24.60 |
0.0022 |
Arrhenius plot for the corrosion rate of brass in the presence SWE for 3 h and 6 h are given in Figure 1: (a)-(b). Straight lines were obtained from the plot of Log P versus 1/T with slope equal to – Ea / 2.303 R. Note first that the Ea values are low, indicating fast corrosion of brass in both the solutions [14]. The estimated values of Ea for brass corrosion in 0.1 N H3PO4 in the presence of SWE are listed in the Table -2. The values of Ea > 80 KJ/mol indicate chemical adsorption where as Ea < 80 KJ/mol infer physical adsorption. The Ea values indicate that the process is activation controlled. In the present study, the Ea values support the fact that the inhibitors are physically adsorbed on brass surface. The estimated Ea in the presence of inhibitor infer that the interaction between the metal surface and the inhibitor was found to be strong enough to reduce corrosion [14]. The Ea values increases in the presence of SWE is often interpreted as physical adsorption with the formation of an adsorptive film with an electrostatic character [13]. In addition, the Ea values increases in the same order as the inhibition efficiency. This indicates that the energy barrier for the corrosion reaction increases in the presence of inhibitor in the acid solutions, the corrosion reaction will be further pushed to surface sites that are characterized by higher values of Ea indicating that corrosion occurs at the uncovered part of the surface [15].
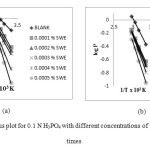 |
Figure1: Arrhenius plot for 0.1 N H3PO4 with different concentrations of SWE for different times Click here to View figure |
Free Energy of Adsorption
The free energy of adsorption ΔGads were obtained from the following equations and the values obtained are presented in Table-2:
where Φ is surface coverage on the metal surface, C is the concentration of inhibitor in mol/l, and K is equilibrium constant.
Results obtained indicate that the values of ∆Gads arenegative in all cases, indicating that the SWE extract is strongly adsorbed on the brass surface [15]. The value of ∆Gads indicates that the inhibitor functions by physically adsorbing on the surface of the brass. Generally values of ∆Gads upto the -29.47 KJmol-1 are consistent with electrostatic interaction between charged molecules and a charged metal, while those more negative than the -40 KJmol-1 involve charge sharing or transfer from the inhibitor molecules to the metal surface to form a co-ordinate type of bond [16]. Physical adsorption is a result of electrostatic attraction between charged metal surface and charged species in the bulk of the solution. Adsorption of negatively charged species can also protect the positively charged metal surface acting with a negatively charged intermediate such as acid anions adsorbed on the metal surface [6].
Entropy and enthalpy
Kinetic parameters such as enthalpy (ΔH) and entropy (ΔS) of activation of corrosion process is calculated from the following thermodynamic basic equations and the values obtained are presented in Table-2:
ΔH = Ea – RT (8)
ΔGads = ΔH – TΔS (9)
Enthalpy of activation of absolute values lower than the -24.78 KJmol-1 indicates physical adsorption, and the values approaching 100 KJmol-1 indicate chemical adsorption [10]. In this study, the values of ΔH are lower than the -24.78 KJmol-1 confirming physical adsorption on the acid solutions. The negative values of ΔH also show that the adsorption of inhibitor is an exothermic process [15].
The ΔS values are positive for the acidic bath. This implies that the activation complex is the rate determining step representing association rather than dissociation, indicating that a decrease in disorder takes place on going from reactant to the activated complex [10].
Rate Constant and Half life
Figure 2: show the plots of log Wf (final weight loss) obtained in weight-loss studies vs. time in days for the brass dissolution. From the plots, the values of rate constant and half-lifewere evaluated using the following equations [17,18] and the values obtained are presented in Table-3:
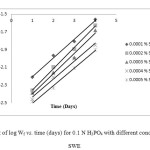 |
Figure2: Plot of log Wf vs. time (days) for 0.1 N H3PO4 with different concentrations of SWE Click here to View figure |
Table3: Calculated rate constant (k) and half-life period (t1/2) values for SWE on brass corrosion in 0.1 N H3PO4 at 300 K
|
Conc. of inhibitor (%) |
Half-life Period (sec) |
Rate constant (sec-1) |
|
0.0001 |
1.2037 |
0.5758 |
|
0.0002 |
1.2037 |
0.5758 |
|
0.0003 |
1.1368 |
0.6096 |
|
0.0004 |
1.1178 |
0.6200 |
|
0.0005 |
1.1035 |
0.6280 |
In this study, linear plots were obtained, which indicates first order kinetics [9]. In this study the rate constant values were decreased where as the half-life values were increased with increasing concentration of SWE.
Adsorption Isotherms
The values of surface coverage Ѳ for different concentrations of the SWE at 300 K have been used to identify the best isotherm to determine the adsorption process. The adsorption of organic adsorbate on the surface of copper is regarded as substitutional process between the organic compound in the aqueous phase orgaq and the water molecules adsorbed on the copper surface (H2O)ads [19].
Org(aq) + x (H2O)(ads) → Org(ads) + x H2O(aq)
where x is the size ratio, that is the number of water molecules displaced by one molecule of organic inhibitor. Attempts were made to fit Ѳ values of various isotherms, including Langmuir, Freundlich, Temkin and Frumkin isotherms. By far the results were best fitted by Temkin adsorption isotherm. The Temkin adsorption isotherm is given by the following equation.
Ln kC = aѲ (12)
where k is the equilibrium constant of the adsorption reaction, C is the inhibitor concentration in the bulk of the solution and a is the molecule interaction parameters depending upon molecular interactions in the adsorption layer and the degree of heterogeneity of the metal surface. The plot of Ѳ against log C for all additives gives straight lines, as shown in Figure 3: (a)-(b). This indicates that these compounds are adsorbed on the surface of brass according to Temkin adsorption isotherm [20,21].
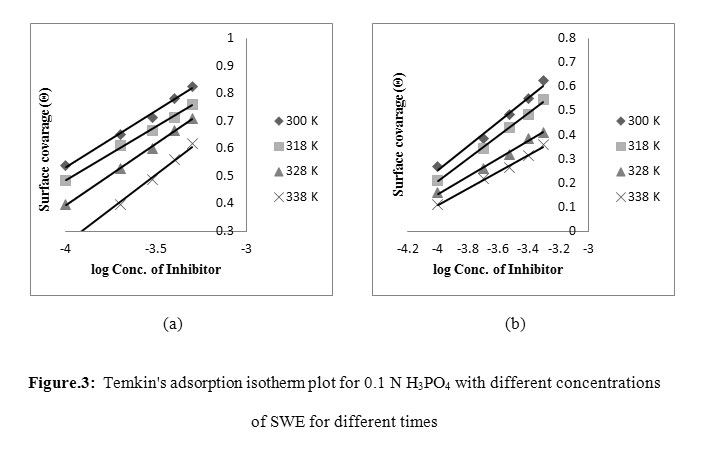 |
Figure3: Temkin’s adsorption isotherm plot for 0.1 N H3PO4 with different concentrations of SWE for different times Click here to View figure |
Potentiostatic Polarization Studies
Polarization measurement is an important research tool in the investigation of a variety of electrochemical phenomena. Such measurements permit studies of the reaction mechanism and the kinetics of corrosion phenomena on the metal deposition. Figure 4: shows the cathodic and anodic polarization curves of brass in 0.1 N H3PO4 with and without addition different concentrations of SWE. Table-4 gives the values of associated electrochemical parameters. The icorr values decreased with increasing concentration of inhibitor. The values of anodic Tafel slope (ba) and cathodic Tafel slope (bc) of SWE added solutions are found to change with inhibitor concentration, which clearly indicates that the inhibitors controlled both the anodic and cathodic reactions. Thus this inhibitor acted as a mixed type inhibitor [8]. The IE of SWE attained a maximum value at 0.0005 % concentration of inhibitor. The values of IE increased with increasing concentration of inhibitor, indicating that a higher surface coverage was obtained in solution with optimum concentration of inhibitor. The effect of the anodic polarization behavior of brass (Figure 4) suggests that protective films formed on the metal surface can alter anodic dissolution in solution shows that SWE formed a film that acted as a barrier to protect the metal surface [20-22].
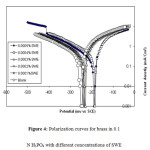 |
Figure4: Polarization curves for brass in 0.1 N H3PO4 with different concentrations of SWE |
Table4: Electrochemical parameters and inhibition efficiency (IE) for corrosion of brass in 0.1 N H3PO4 containing different concentrations of SWE
|
Conc. Of inhibitor (%) |
OCP (mV) vs. SCE |
Ecorr (mV) vs. SCE |
Tafel constants |
icorr (mA/cm2) |
IE (%) |
|
|
ba (mV/dec) |
bc (mV/dec) |
|||||
|
Blank |
-193 |
-190 |
300 |
100 |
310 |
0 |
|
0.0001 |
-210 |
-190 |
270 |
100 |
210 |
32.26 |
|
0.0002 |
-230 |
-230 |
140 |
170 |
180 |
41.91 |
|
0.0003 |
-235 |
-240 |
60 |
90 |
160 |
48.39 |
|
0.0004 |
-240 |
-240 |
40 |
130 |
98 |
69.00 |
|
0.0005 |
-244 |
-250 |
38 |
150 |
63 |
92.00 |
AC Impedance Measurements
AC impedance spectroscopy has been shown to be a powerful tool to study the corrosion process of metals in different environments and to characterize the inhibition ability of a corrosion inhibitor, which is related to the charge transfer resistance (Rct). The double layer capacitance (Cdl) can also be used to determine the inhibition ability. The inhibition performance of an organic or natural substance on a metal surface depends not only on the chemical structure of the organic substance and the nature of the metal, but also on the experimental conditions such as the immersion time and concentration of the adsorbent.
The corrosion behavior of brass, in acidic solution with and without SWE is also investigated by AC impedance measurements at 300 K (Figure 5). The impedance parameters and the IE % derived from the investigation are mentioned given in Table-5. As it can be seen from Figure 5:, impedance diagrams show a semi-circular appearance, indicating that a charge transfer process mainly controls the corrosion of brass. From the impedance data, we notice an increase in the charge transfer resistance and decrease of the double layer capacitance with increasing the inhibitor concentration, indicating that SWE inhibits the corrosion rate of brass by an adsorption mechanism. Therefore, the decrease in the Cdl value can be attributed to a decrease in the local dielectric constant and/or an increase in the thickness of the electrical double layer, suggesting that the inhibitor molecules act by adsorption at the metal/solution interface as a consequence of the replacement of water molecules by the inhibitor molecules [8].
A comparison may be made between the inhibition efficiency values obtained by different methods (weight loss, potentiostatic polarization and AC impedance methods). We can see that whatever the method used, no significant changes are observed in IE % values. We can then conclude that there is a good agreement with the three methods used in this study at all tested concentrations and that the acid extract of Sargassum wightii acts as green inhibitor for acid corrosion of brass.
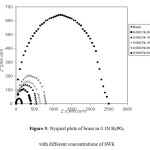 |
Figure5: Nyquist plots of brass in 0.1N H3PO4 with different concentrations of SWE |
Table5: AC Impedance parameters for corrosion of brass in 0.1 N H3PO4 containing different concentrations of SWE at 300 K
|
Conc. of inhibitor (%) |
Rct (ohm cm2) |
Cdl (mF/cm2) |
IE (%) |
|
Blank |
150.60 |
5.74 |
00.00 |
|
0.0001 |
407.10 |
2.71 |
63.00 |
|
0.0002 |
538.15 |
2.19 |
72.01 |
|
0.0003 |
630.42 |
1.98 |
76.11 |
|
0.0004 |
793.15 |
1.67 |
81.01 |
|
0.0005 |
2550.75 |
0.54 |
94.10 |
Surface examinations
FT-IR Spectroscopy
The chemical analysis of Sargassum wightii found that many organic aromatic molecules, terpenoids, phenols, flavanoids, alkaloids, aromatic esters, benzyl alcohol, benzaldehyde and fatty acids are present in it [23]. Figure 6: shows the FT-IR spectrum recorded in the range 400-4000 cm-1 to identify the functional groups present in SWE. From FT-IR, It was observed that aromatic molecules with following functional groups, intermolecular hydrogen bonding and O-H stretching (3452.62 cm-1), -C≡N in nitrile (2347.52 cm-1), – C≡C disubstituted alkyne (2100.13 cm-1), -C-H and C=O stretching in aldehyde (1640.73 cm-1), -C-H deformation in CH3 (1400.59 cm-1), -C-H stretching -C-O-C- (1115.40 cm-1), and -C-H deformation in alkyne (659.86 cm-1) are present in SWE. Further found that SWE inhibits the corrosion of brass specimen with high efficiency due to the presence of N and O in the organic molecules of SWE [24,25].
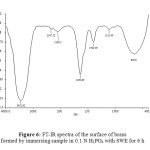 |
Figure6: FT-IR spectra of the surface of brass formed by immersing sample in 0.1 N H3PO4 with SWE for 6 h Click here to View figure |
Scanning Electron Microscopy
SEM micrograms of the polished surface of brass exposed for 6 h in 0.1 N H3PO4 in absence and presence of SWE are shown in Figure 7: (a)-(b) shows the surface morphology of brass formed in 0.1 N H3PO4 without and with SWE for 6 h. In the comparison of the SEM micrograms, there were a rough surface on brass in absence of extract and a smooth surface with deposited extract in presence of the SWE. This confirms that the extract inhibited corrosion of brass through adsorption of the inhibitor molecules on metal surface. After immersing in the inhibitor containing solution, the entire metal surface was covered with a layer formed with inhibitor as a barrier to corrosion, as denoted by rougher over abrasions. The inhibiting layer was possibly consisting of Cu2+ and Zn2+ complexes formed with the SWE derivatives are mentioned in FT-IR. [26,27]
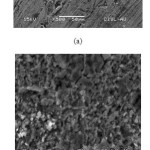 |
Figure7: SEM images of brass surface after 6 h immersion in 0.1N H3PO4 in the absence (a) and presence (b) of SWE Click here to View figure |
Conclusions
The inhibition efficiency of SWE on corrosion of brass in 0.1 N H3PO4 increases on increasing of concentration of the extract and decreases with rise in temperature. Adsorption of inhibitor molecules of the extract on brass surface is found to obey Tempkin adsorption isotherm. The increase in the values of activation energies of the corrosion process in the presence of extract indicates that SWE creates a physical barrier to charge and mass transfer, leading to reduction in corrosion rate of brass in 0.1 N H3PO4. The negative values of ΔGads and ΔH highlight that the inhibition of corrosion of brass through adsorption is spontaneous and exothermic. Their values also reveal that physical adsorption is involved in the adsorption process. Potentiodynamic polarization measurements show that SWE acts as a mixed type inhibitor. Inhibition efficiency values were found to show good trend with weight-loss method, potentiodynamic polarization and electrochemical impedance spectroscopy studies. SEM and FT-IR studies confirm that corrosion inhibition of brass in 0.1 N H3PO4 is due to adsorption of the SWE extract on brass.
References
- Chandrasekaran, V.; Kannan, K.; Natesan, M. Asian J. Chem. 2005, 17(3), 1921-1934
- Chandrasekaran, V.; Kannan, K.; Natesan, M. Orient. J. Chem. 2005, 21(1), 81-88
- Ranjana ; Nandi, M. M. Ind. J. Chem. Tech.. 2011, 18, 29-36
- Ranjana; Ranu Banerjiee ; Nandi, M. M., Ind. J. Chem. Tech. 2013, 20, 237-244
- Ravichandran, R.; Rajendran, N. App. Surf. Sci. 2005, 241, 449-458
- Vijayalakshmi, P. R.; Rajalakshmi, R.; Subhashini, S. Portu. Electrochim. Acta. 2011, 29(1), 9-21
- Ramananda S. Mayanglambam; Vivek Sharma; Gurmeet Singh. Portu. Electrochim. Acta. 2011, 29(6), 405-417
- Khadraoui, A.; Khelifa, A.; Boutoumi, H.; Mettai, B.; Karzazi, Y.; Hammouti, B. Portu. Electrochim. Acta. 2014, 32(4), 271-280
- Ejikeme, P. M.; Umana, S. G.; Onukwuli, O. D.; Hammouti, B. Portu. Electrochim. Acta. 2012, 30(5), 317-328
- Muna K. Irshedat; Eyad M. Nawafleh; Tareq T. Bataineh; Riyadh Muhaidat; Mahmoud A. Al-Qudah; Ahmed A. Alomary; Hammouti, B. Portu. Electrochim. Acta. 2011, 31(1), 1-10
- Gao-Lei; Bo, L. Hammouti, B. Portu. Electrochim. Acta. 2014, 28, 735–752
- Ravichandran, R.; Rajendran, N. App. Surf. Sci. 2014, 241, 449-458
- Chandrasekaran, V.; Saravanan, J. Corr. Sci. Tech. 2006, 5(5), 160-167
- Mahmoud, S. S. Portu. Electrochim. Acta. 2006, 24, 441-455
- Elmsellem, H.; Basbas, N.; Chetouani, A.; Aouniti, A.; Radi, S.; Messali, M.; Hammouti B. Portu. Electrochim. Acta. 2014, 32(2), 77-108
- Tadeja Kosec; Ingrid Milosev; Boris Pihlar. App. Surf. Sci. 2007, 253, 8863-8873.
- Chandrasekaran ,V.; Kannan, K.; Natesan, M. Corr. Sci. Tech. 2005, 4(5), 191-200
- Al-Mhyawi, S. R.Orient. J. Chem., 2014, 30(2), 541-552
- Megahed, H. E. Portu. Electrochim. Acta. 2011, 29(4), 287-294
- Chandrasekaran, V.; Gokulalakshmi, K. Bull. Electrochem. 2006, 22, 379-384
- Chandrasekaran, V.; Kannan, K.; Natesan, M. Int. J. Pure and App. Chem. 2006, l(1), 101-115
- Gaikwad, A. B. ; Patil, P.P.; Sudeshna Chaudhari. Curr. App. Phy. 2009, 9, 206-218
- Dandelot, S.; Robles, C.; Pech, N.; Cazaubon, A. Aqua. Bot. 2008, 88(4), 311–316
- Ravichandran, R.; Nanjudan, S.; Rajendran, N. App. Surf. Sci., 2004, 236, 241-250
- Du, X.S.; Su, Y.J. ; Li, J.X.; Qiao, L.J.; Chu, W.Y. Corr. Sci. 2012, 60, 69-75
- Ramananda; Mayanglambam, S.; Vivek Sharma; Gurmeet Singh. Portu. Electrochim. Acta. 2011, 29(6), 405-417
- Khadraoui, A.; Khelifa, A.; Boutoumi, H.; Mettai, B.; Karzazi, Y.; Hammouti, B. Portu. Electrochim. Acta. 2014, 32(4), 271-280

This work is licensed under a Creative Commons Attribution 4.0 International License.
![]()
A New Edition of Web of Science
Journal Impact Factor
2022: 0.5
Five Year: 0.8
Journal is Indexed in

Cabells Whitelist
![]()


