Physicochemical Characterization and the Comparison of Chitin and Chitin Modified with Maleic Anhydride
Ilhan Uzun1 and Omer Celik2
1Department of Chemistry, Faculty of Education, Dicle University, 21280 Diyarbakir, Turkey
2Department of Physics, Faculty of Education, Dicle University, 21280 Diyarbakir, Turkey
DOI : http://dx.doi.org/10.13005/ojc/310202
Article Received on :
Article Accepted on :
Article Published : 22 Apr 2015
Firstly, chitin was modified via ring-opening reaction with maleic anhydride in lithium chloride/N,N-dimethylacetamide. Then, both chitin and chitin modified with maleic anhydride (CMA) were characterized by Fourier transform infrared (FTIR) spectroscopy, X-ray diffraction (XRD) method, ultraviolet-visible (UV-Vis) spectroscopy, and scanning electron microscopy (SEM). Thermogravimetric analysis (TGA) was performed to investigate the thermal stability of chitin and CMA. TGA results showed that chitin is thermally more stable than CMA. In addition, the electrical conductivity of chitin and CMA was also measured. Electrical conductivity measurement results showed that the electrical conductivity of CMA (4.3x10⁻⁴ S cm-1) is more than that of chitin (6.5x10⁻⁶ S cm-1).
KEYWORDS:Chitin; Maleic anhydride; Synthesis; Characterization; Semiconductor polymer
Download this article as:| Copy the following to cite this article: Uzun I, Celik O. Physicochemical Characterization and the Comparison of Chitin and Chitin Modified with Maleic Anhydride. Orient J Chem 2015;31(2). |
| Copy the following to cite this URL: Uzun I, Celik O. Physicochemical Characterization and the Comparison of Chitin and Chitin Modified with Maleic Anhydride. Orient J Chem 2015;31(2). Available from: http://www.orientjchem.org/?p=8554 |
Introductıon
Viewpoint related to the conductivity of polymers is changing fastly with the discovery of conducting polymers (CPs). CPs (also known as conjugated polymers) have conjugated π-electron system. Conjugated π-electron system provides unusual electronic properties (such as electrical conductivity, low-energy optical transitions, low ionization potential, and high electron affinity) to polymers1,2. The conductivity of CPs can be increased more in two ways. The first is to introduce electrons into the π-electron system (n-doping), and the second is to create holes in the π-electron system (p-doping). Very important studies related to the conductivity of some polymers and their derivatives (such as polyacetylene3,4, polyaniline5-9, polypyrrole10,11, polythiophene12-15, poly(p-phenylene)16-18, and poly(p-phenylene vinylene)19-21) were performed. A potential application field of CPs is related to the production of lightweight rechargeable batteries for portable devices and vehicles. Another potential application field of CPs is their use in building circuit elements, both passive (conducting circuits) and active (p-n and Schottky junctions). Other potential application fields of CPs include the transparent antistatic coating of metals and electronic devices, electromagnetic shielding, and the production of light-emitting diodes (LEDs), electrodes, biosensors, transistors, and ultrathin and flexible screens for computer and TV monitors22. Studies for obtaining alternative CPs and semiconductor polymers from natural and/or low-cost materials have been rapidly continuing.
Chitin (C8H13O5N)n is a natural biopolymer, and it is found abundantly on the earth. It is the most abundant organic compound after cellulose. It is found in the structure of many living being (crab, lobster, shrimp, squid, octopus, insect, cephalopod, etc.). It has a linear structure and is composed of 2-acetamido-2-deoxy-D-glucopyranose (N-acetyl-D-glucosamine, GlcNAc) units linked by β-(1→14) linkage. There are three kind chitin: α-chitin, β-chitin, and γ-chitin. Molecular structures of α-chitin and β-chitin are shown in two papers23,24. As for the molecular structure of γ-chitin is a combination of the molecular structures of α-chitin and β-chitin25. Both α-chitin and β-chitin have crystalline structure. α-chitin is the most abundant chitin kind in nature. Chitin is used for different aims in agriculture, industry, and medicine. Besides, very important studies related to the electrical conductivity of some chitin derivatives are performed in recent years26-30. Maleic anhydride is used in coatings, water treatment chemicals, detergents, insecticides, fungicides, pharmaceuticals, and the manufacture of polymers and copolymers, and therefore it is produced on a large scale every year.
In our previous study30, two chitin derivatives (CPA and CTA) were synthesized, and these derivatives were physicochemically investigated. The aim of the present study was to synthesize another chitin derivative by using maleic anhydride, to characterize physicochemically chitin and CMA, and to comparise chitin and CMA with CPA and CTA in our previous study from the point of view of conductivity. Besides, the use of CMA in various fields for different purposes by other researchers was aimed.
Experımental
Materials
Chitin (Sigma C 9213, Germany), maleic anhydride (Aldrich, Germany), lithium chloride (Fluka, Switzerland), N,N-dimethylacetamide (Fluka, Switzerland), and methanol (Riedel-de Haën, Germany) were used as purchased. In addition, hydrochloric acid (Merck, Germany) was also used for adjusting pH. Some important properties of chitin used in this study were given in our previous study30. As for some important properties of maleic anhydride are given in Table 1.
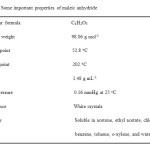 |
Table 1: Some important properties of maleic anhydride
|
Modification of Chitin with Maleic Anhydride
1.0% (w/v) chitin solution was prepared as follows: 3.0 g chitin was added to 300 mL of 5% (w/v) LiCl/DMAc solution, and mixture was stirred at room temperature for 3 h to give a clear solution. 100 mmol maleic anhydride was added to 200 mL of the chitin solution (Scheme 1). Reaction mixture became dark brown by the addition of 100 mmol triethylamine, and then it turned to a gel within 30 min. After stirring for 24 h, reaction mixture (containing a gel) was poured into 100 mL MeOH. Precipitate was filtered, and then it was dispersed in 200 mL water. The pH of mixture was adjusted to 1-2 with 3 M HCl, and the mixture was filtered. Finally, product was washed with MeOH and was dried in vacua31,32.
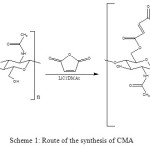 |
Scheme 1: Route of the synthesis of CMA Click here to View scheme |
Characterization
FTIR spectra were recorded with a resolution of 4 cm-1 from KBr pellets on a PerkinElmer Spectrum One FTIR Spectrometer (PerkinElmer Inc., USA). X-ray powder diffraction patterns were taken by using a BRUKER D8 DISCOVER powder diffractometer (Bruker Corporation, USA) equipped with a Cu-Kα radiation (λ = 1.5406 Å) generator using a voltage of 40 kV and a current of 40 mA. Collected data were analyzed by software EVA (EVA, Bruker Corporation) based on powder diffraction files provided by the International Center for Diffraction Data (New town Square, PA). UV-Vis absorption spectra were obtained with a CADAS 200 UV-VIS spectrophotometer (Hach Lange Ltd., Germany) working in the wavelength range of 190–1100 nm using a quartz cell of 1 cm path length. SEM micrographs were taken with a Jeol JSM-6335 F scanning electron microscope (Global Spec Inc., USA). TGA thermograms were recorded by using a Pyris 1 Thermogravimetric Analyzer (Perkin Elmer Inc., USA). The samples were heated from 23 to 900 oC at a heating rate of 10 oC min-1 under N2 atmosphere. The direct current electrical conductivity of chitin and its derivative was measured by the standard four point probe method by using PCI-DAS 6014 for a current source, voltameter, and temperature controller. For this purpose, dry and powdered samples were transformed into pellets by using a steel die of 13 mm diameter under a pressure of 700 MPa.
Results and Dıscussıon
FTIR spectra
Fig. 1 shows the FTIR spectra of chitin and CMA. Characteristic absorption bands of chitin and CMA are given in Table 2. C=O stretching band at 1718 related to ester and/or carboxylic acid and C=C stretching band at 1627 related to disubstituted alkene in the FTIR spectrum of CMA (Fig. 1b) confirm the successful modification of chitin with maleic anhydride.
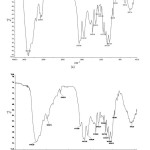 |
Figure 1: FTIR spectra of (a) chitin and (b) CMA Click here to View figure |
 |
Table 2: Characteristic absorption bands of chitin and CMA
|
XRD Analysis
X-ray powder diffraction patterns of chitin and CMA are illustrated in Fig. 2. It was observed that X-ray powder diffraction pattern related to chitin fitted X-ray powder diffraction patterns related to other chitin samples in literature33-37. Besides, it was determined from the X-ray powder diffraction pattern of CMA that it contains a little impurity. In the result of matching performed, mentioned impurity was detected as hydrochloride hydrate (HCl.H2O). Hydrochloride hydrate may be absorbed by CMA because HCl and water were used in the synthesis of CMA. In addition, CMA may also has absorbed moisture in the air. Crystallinity index (CrI) values of chitin and CMA were calculated by using a equation (Eq. 1) used for cellulose in a paper38. IMax and IAm in Eq. 1 are maximum diffraction intensity and amorphous diffraction intensity, respectively. IMax and IAm values were read
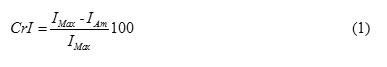
as 1319 and ~285 for chitin and as 732 and ~256 for CMA from Fig. 2. CrI values calculated and other some important parameters related to the X-ray powder diffraction patterns of chitin and CMA are given in Table 3. The (220) peak at 2θ of 29.4° in Fig. 2 and Table 3 shows peak arisen from impurity.
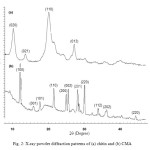 |
Figure 2: X-ray powder diffraction patterns of (a) chitin and (b) CMA Click here to View figure |
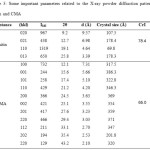 |
Table 3: Some important parameters related to the X-ray powder diffraction patterns of chitin and CMA
|
UV-Vis Absorption Spectra
Fig. 3 displays the UV-Vis absorption spectra of chitin and CMA. As it is known, UV-Vis absorption spectroscopy is a spectroscopy technique that deals with the measurement of the attenuation of a beam of light after it passes through a sample or after reflection from a sample surface. Ultraviolet and visible lights have enough energy to promote outer electrons to higher energy levels39. As can be seen from Fig. 3a and Fig. 3b, both chitin and CMA have one absorption band. The absorption band at 262 nm for chitin and at 266 nm for CMA may be due to n→π* transition (R band). An absorption band is a range of wavelengths, frequencies or energies in the electromagnetic spectrum. Energy change related to electronic transition in a molecule provides information about the structure of that molecule and determines many molecular properties (chemical properties, physical properties, and structural properties) such as color. The colors of chitin and CMA are light yellow and brown, respectively. Energy difference (ΔE) between two energy levels involved in electronic transition is calculated by ΔE = hv . This is a consequence of the Planck-Einstein equation (ΔE = hv). A similiar UV-Vis spectrum for chitin is given in a study reported by Luna-Bárcenas et al.40.
 |
Figure 3: UV-Vis absorption spectra of (a) chitin and (b) CMA Click here to View figure |
SEM Micrographs
The SEM micrographs of chitin and CMA are shown in Fig. 4. As it is known, a scanning electron microscope is a microscope that scans at different magnifications the surface of a sample, and therefore it uses a beam of high-energy electrons. The electrons interact with the atoms that make up the sample producing various signals that contain information about the chemical composition, crystalline structure, and surface topography of the sample and about the orientation of materials making up the sample. 41. As can be seen from the SEM micrographs of chitin and CMA, chitin has a rough surface according to CMA. CMA has a structure formed of smooth parts in different directions.
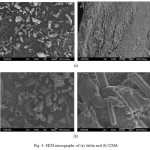 |
Figure 4: SEM micrographs of (a) chitin and (b) CMA Click here to View figure |
TGA Thermograms
Two decomposition stages could be observed in the thermogram of chitin and CMA (Fig. 5). In the thermogram of chitin (Fig. 5a) the first decomposition stage is in the range of approximately 45-100oC, and the second decomposition stage is in the range of approximately 275-400oC. In the thermogram of CMA (Fig. 5b) the first decomposition stage is in the range of approximately 45-120oC, and the second decomposition stage is in the range of approximately 170-330oC. The first decomposition stage in the thermogram of both chitin and CMA could be attributed to the evaporation of water. As for the second decomposition stage in the thermogram of both chitin and CMA could be attributed to the degradation of the polysaccharide structure of the molecule (including the dehydration of polysaccharide rings) and to the polymerization and decomposition of the acetylated and deacetylated units of chitin and CMA30,42. As it is known, thermal stability is a measurement of the resistance of a molecule against temperature. If so, it can be said that chitin is thermally more stable than CMA.
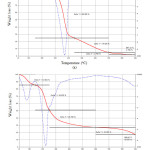 |
Figure 5: TGA curves (—) of (a) chitin and (b) CMA Click here to View figure |
Electrical Conductivity
The electrical conductivity of chitin and CMA was measured to be 6.5×10⁻⁶ S cm-1 and 4.3×10⁻⁴ S cm-1, respectively. These conductivity values are in the conductivity range (σ = 10-7 – 10-1 S cm-1) of semiconductors43. The electrical conductivity of CPA and CTA was measured to be and , respectively, in our previous study30. If so, the electrical conductivity of chitin, CMA, CPA, and CTA has been changing as σ CMA> σ CTA> σCPA > σChitin. It can be said that especially CMA is a good semiconductor polymer, and it can be used as a semiconductor in the production of lightweight rechargeable batteries for portable devices and vehicles and in building circuit elements, both passive (conducting circuits) and active (p-n and Schottky junctions). In addition, it can also be used in the transparent antistatic coating of metals and electronic devices, in electromagnetic shielding, and in the production of light-emitting diodes (LEDs), electrodes, biosensors, transistors, and ultrathin and flexible screens for computer and TV monitors.
Conclusıons
C=O stretching band at 1718 related to ester and/or carboxylic acid and C=C stretching band at 1627 related to disubstituted alkene in the FTIR spectrum of CMA confirm the successful modification of chitin with maleic anhydride. It was observed that X-ray powder diffraction pattern related to chitin fitted X-ray powder diffraction patterns related to other chitin samples in literature. Besides, it was determined from the X-ray powder diffraction pattern of CMA that it contains a little impurity. In the result of matching performed, mentioned impurity was detected as hydrochloride hydrate (HCl.H2O). Hydrochloride hydrate may be absorbed by CMA because HCl and water were used in the synthesis of CMA. In addition, CMA may also has absorbed moisture in the air. Both chitin and CMA have one absorption band. The absorption band at 262 nm for chitin and at 266 nm n→π* transition (R band). As can be seen from the SEM micrographs of chitin and CMA, chitin has a rough surface according to CMA. CMA has a structure formed of smooth parts in different directions. As could be observed from the thermograms of chitin and CMA, chitin is thermally more stable than CMA. The conductivity values of chitin and CMA are in the conductivity range of semiconductors. It can be said that especially CMA is a good semiconductor polymer.
As conclusion, chitin is both low-priced and is found abundantly in nature. In addition, the modification of chitin with maleic anhydride is also low-cost, and CMA can be used as an alternative semiconductor polymer in various fields.
References
- Friend, R. H.; Gymer, R. W.; Holmes, A. B.; Burroughes, J. H.; Marks, R. N.; Taliani, C.; Bradley, D. D. C.; Dos Santos, D. A.; Brédas, J. L.; Lögdlund, M.; Salaneck, W. R. Nature 1999, 397, 121-128.
- Gerard, M.; Chaubey, A.; Malhotra, B. D. Biosens. Bioelectron. 2002, 17, 345-359.
- Akagi, K.; Shirakawa, H.; Araya, K.; Mukoh, A.; Narahara, T. Polym. J. 1987, 19, 185-189.
- Lieser, G.; Schmid, S. C.; Wegner, G. J. Microsc. 1996, 183, 53-59.
- Cowan, D. L.; Priest, V.; Marrero, T. R.; Slaughter, D. W. J. Phys. Chem. Solids 1990, 51, 307-312.
- Li, W.; Wan, M. Synt. Met. 1998, 92, 121-126.
- Langer, J. J.; Krzyminiewski, R.; Kruczyński, Z.; Gibiński, T.; Czajkowski, I.; Framski, G. Synt. Met. 2001, 122, 359-362.
- Zhang, D. Polym. Test. 2007, 26, 9-13.
- Nandi, M.; Gangopadhyay, R.; Bhaumik, A. Micropor. Mesopor. Mat. 2008, 109, 239-247.
- Peres, R. C. D.; Pernaut, J. M.; De Paoli, M. A. Synt. Met. 1989, 28, 59-64.
- Ateh, D. D.; Navsaria, H. A.; Vadgama, P. J. R. Soc. Interface 2006, 3, 741-752.
- Otero, T. F.; De Larreta, E. J. Electroanal. Chem. 1988, 244, 311-318.
- Satoh, M.; Imanishi, K.; Yasuda, Y.; Tsushima, R.; Yamasaki, H.; Aoki, S.; Yoshino, K. Synt. Met. 1989, 30, 33-38.
- Ruckenstein, E.; Park, J. S. Synt. Met. 1991, 44, 293-306.
- He, J.; Zhou, H.; Wan, F.; Lu, Y.; Xue, G. Vib. Spectrosc. 2003, 31, 265-269.
- Havinga, E. E.; Van Horssen, L. W. Synt. Met. 1987, 17, 623-628.
- Callaerts, R.; Krikor, H.; Mertens, R.; Nagels, P. Synt. Met. 1990, 37, 107-113.
- Płocharski, J.; Wyciślik, H. Solid State Ionics 2000, 127, 337-344.
- Gagnon, D. R.; Capistran, J. D.; Karasz, F. E.; Lenz, R. W.; Antoun, S. Polymer 1987, 28, 567-573.
- Esteghamatian, M.; Xu, G. Synt. Met. 1994, 63, 195-197.
- Ahlskog, M.; Reghu, M.; Noguchi, T.; Ohnishi, T. Synt. Met. 1997, 89, 11-15.
- Ateş, M.; Karazehir, T.; Saraç, A. S. Curr. Phys. Chem. 2012, 2, 224-240.
- Kumirska, J.; Czerwicka, M.; Kaczyński, Z.; Bychowska, A.; Brzozowski, K.; Thöming, J.; Stepnowski, P. Mar. Drugs 2010, 8, 1567-1636.
- Rinaudo, M. Prog. Polym. Sci. 2006, 31, 603-632.
- Jang, M. K.; Kong, B. G.; Jeong, Y. I.; Lee, C. H.; Nah, J. W. J. Polym. Sci. Part A: Polym. Chem. 2004, 42, 3423-3432.
- Suzuki, K.; Saimoto, H.; Shigemasa, Y. Carbohyd. Polym. 1999, 39, 145-150.
- Rao, V.; Ramaprasad, A. T. J. Appl. Polym. Sci. 2007, 106, 309-313.
- Ramaprasad, A. T.; Rao, V. Synt. Met. 2008, 158, 1047-1053.
- Thanpitcha, T.; Sirivat, A.; Jamieson, A. M.; Rujiravanit, R. Macromol. Symp. 2008, 264, 168-175.
- Uzun, İ.; Topal, G. J. Chem. 2013, 2013, 1-8.
- Shigemasa, Y.; Usui, H.; Morimoto, M.; Saimoto, H.; Okamoto, Y.; Minami, S.; Sashiwa, H. Carbohyd. Polym. 1999, 39, 237-243.
- Akkaya, G.; Uzun, İ.; Güzel, F. Desalination 2009, 249, 1115-1123.
- Cho, Y. W.; Jang, J.; Park, C. R.; Ko, S. W. Biomacromolecules 2000, 1, 609-614.
- Sun, L.; Du, Y.; Yang, J.; Shi, X.; Li, J.; Wang, X.; Kennedy, J. F. Carbohyd. Polym. 2006, 66, 168-175.
- Goodrich, J. D.; Winter, W. T. Biomacromolecules 2007, 8, 252-257.
- Lavall, R. L.; Assis, O. B. G.; Campana-Filho, S. P. Bioresource. Technol. 2007, 98, 2465-2472.
- Hwang, D. S.; Masic, A.; Prajatelistia, E.; Iordachescu, M.; Waite, J. H. Acta Biomater. 2013, 9, 8110-8117.
- Segal, L.; Creely, J. J.; Martin, Jr., A. E.; Conrad, C. M. Text. Res. J. 1959, 29, 786-794.
- Skoog, D. A.; Holler, F. J.; Crouch, S. R. Principles of Instrumental Analysis, Brooks/Cole Pub. Co., Pacific Grove, Calif, 2006.
- Luna-Bárcenas, G.; Gonzalez-Campos, B.; Elizalde-Peña, E. A.; Vivaldo-Lima, E.; Louvier-Hernández, J. F.; Vorobiev, Y. V.; González-Hernández, J. Phys. Status Solidi C 2008, 5, 3736-3739.
- Goldstein, J. I.; Newbury, D. E.; Joy, D. C.; Lyman, C. E.; Echlin, P.; Lifshin, E.; Sawyer, L.; Michael, J. R. Scanning Electron Microscopy and X-ray Microanalysis, Springer, New York, 2003.
- Jayakumar, R.; Tamura, H. Int. J. Biol. Macromol. 2008, 43, 32-36.
- Stevens, M. P. Polymer Chemistry, Oxford University Press, New York, 1999.

This work is licensed under a Creative Commons Attribution 4.0 International License.
![]()
A New Edition of Web of Science
Journal Impact Factor
2022: 0.5
Five Year: 0.8
Journal is Indexed in

Cabells Whitelist
![]()


