Effect of Churning Process on Heavy Metals in Cream, Butter and Butter Milk
Tannaz Aminzadeh Vahedi1, Mohammad Hadi Givianrad2*and Yousef Ramezan1
1Department of Food Science & Technology, Pharmaceutical Sciences Branch, Islamic Azad University, Tehran, Iran.
2Department of Marine Chemistry, Science and Research Branch, Islamic Azad University, Tehran, Iran.
Corresponding author; Email: givianradh@yahoo.com
DOI : http://dx.doi.org/10.13005/ojc/310267
Article Received on :
Article Accepted on :
Article Published : 26 Jun 2015
Dairy products are appropriate source of fat, protein and minerals for human, thus it is important to control the level of toxic elements in these products. The aim of this research was investigation about existence of some elements (lead, Cadmium, Copper and iron) in different types of samples including pasteurized and local cream, butter, and butter milk. The amount of elements was determined using flame atomic Absorption spectrometry (FAAS). The butter milk was evaluated as the most contaminated products, significantly (p<0.05). By passing time, concentration of heavy metals was increased even higher than Maximum residue levels (MRLS). Results show that elements have more tendencies toward serum phase.
KEYWORDS:FAAS; Heavy metals; Cream; Butter; Buttermilk; Industrial; Local
Download this article as:| Copy the following to cite this article: Vahedi T. A, Givianrad M. H, Ramezan Y. Effect of Churning Process on Heavy Metals in Cream, Butter and Butter Milk. Orient J Chem 2015;31(2). |
| Copy the following to cite this URL: Vahedi T. A, Givianrad M. H, Ramezan Y. Effect of Churning Process on Heavy Metals in Cream, Butter and Butter Milk. Available from: http://www.orientjchem.org/?p=9567 |
Introduction
Milk and milk products are main constituents of dairy diet, especially for vulnerable groups such as infants, school age children and old age. Several studies have reported the distribution and occurrence of the essential components in various animal milks. The reported data show that the component contents of selected milks vary considerably and their composition on appear to be affected by genetics, physical and environmental factors1.
Milk can be served as a vector for transmission of noninfectious which are potentially toxic to the consumer. These toxins may originate in cow’s milk from the ingestion of plants known to contain toxic substances or feeds contaminated with Mycotoxins, or residues of pesticides or herbicides; there are many published articles on this subject2.
In order to trace element content in sheep and goat milk and dairy products the first purpose is to undertake attentive and thorough valuation of all mechanism by which feed stuff modality, producing processes and environmental situations, involving health parameters, can efficient milk and milk products characteristics3. In order to monitor influences from the environment on the levels of trace elements in the matrices of interest, and to control conceivable secondary contamination or require element losses during processing, packaging and storage of milk and milk products, rigorous experimental protocols and reliable analytical measurements are indispensable3.
Regarding the quality of oils and food, presence of heavy metal ions such as cadmium, lead and copper in oils and food fat products is a very important parameter of their quality4. Heavy metal such as lead and cadmium are very toxic, stable and not easily biodegradable. One of the most usual ways to expose to contaminated heavy metals is ingestion over a long period of time5.Despite great amount of metal elements in natural soil, plants need only relatively low amount of metal ions. May also find few metal ions in plant tissue the above-mentioned heavy metals are very dangerous for human health; cadmium and lead in particular are cumulative poisons; their toxicity is manifested by kidney deficiency, hypertension, hepatic injury, lung damage, bone effects, etc6-8.Toxicity of copper due to extreme intake may lead to dermatitis, neurological disturbance and liver disease. Moreover, copper ions are strong catalysts of edible fats degradation for this reason levels of copper cause decrease oxidative stability of fats .Since oils and fats have a high calorific value and contain essential fatty needed for human tissues4,they are considered as natural nutrition in diets, Because diet is the most important source of Cd (II), Pb (II), and Cu (II) human intake, in 1993 the joint FAO/WHO expert committee for additives and contaminants (JECFA)decreased the tolerable lead consumption per week, from 0.05 mgkg-1 body weight to 0.025 mgkg-1. Also they recommended daily intake of cadmium is 7 µgkg-1 and consumption of copper is 0.5 mgkg-1 body mass9.Based on the UK food standards agency in 2009, contents of cadmium in milk and milk products were 0.001 mgkg-1 and 0.003 mgkg-1, separately10. Cadmium levels reported in the USA are comparable or somewhat lower as compared with those reported domestically, and were lesser in New Zealand (milk 0.002 mgkg-1, butter and cheese 0.001 mgkg-1 11.France monitoring studies in 2000 reported that the lead values should be that from 0.003 mgkg-1in milk, through 0.004 and 0.007 mgkg-1in liquid products and butter, respectively, and up to 0.016 mgkg-1 in cheese12. Specialized reports suggest that dietary intake of iron is about 16-18 mg/day for men and 12 mg/day for women. Upper level of iron intake, which can be tolerable by adults, is 45 mg/day, a level which can cause gastrointestinal suffering13.
Determination of trace quantities of lead and cadmium were carried out all over the world using various analytical techniques. Atomic absorption spectrometry, which is time saving with high sensitivity and specificity14.
Experimental
Reagent and standard
Reagent was of analytical grade. Double deionized water was used for dilution. Nitric acid (HNO3) with purity 65% was of pure quality (Merck, Germany). Standard solutions of heavy metals were prepared in 1000 ppm solution by Merck (Merck, Germany).
Collection of samples
Samples were collected from local market in Golpayegan, Damavand and Varamin and industrial market in Tehran. Butter and butter milk were extracted from cream, using electric mixer and then were examination.
Precautions against contaminations
All glassware was washed with water and detergent and then there was rinsed three times with deionized water and dried. The laboratory ware was dipped in 10% HNO3 for 24 h, rinsed with deionized water again.
Analytical procedure
Aliquots of about 18g of cream, butter and buttermilk for all other samples were weighted (Analytical balance, Bosch SAE 200, made in Germany) into decontamination quartz crucibles. Samples were then dried in an oven (Ariateb IP88, made in Iran) at 120 °C for 24 h. Then samples were heated on hot plate as long as completely burned. Crucibles were transferred into a muffle furnace (Mod. L9/11/06, made in Germany), the internal walls of which were completely lined with laminar quartz to exclude any possibility of release of elements from the refractory material. The temperature was increased at a rate of about 50 °C h-1 up to 300 °C, and then the temperature was increased again at the same rate as above up to 500 ± 50 °C, whereby combustion was continued for 8 h. This operation was repeated until the ashes contained no traces of carbon. Dissolution of white ashes was then performed by adding 1ml of double-distilled water and 3ml 65 % HNO3, with subsequent carful heating on a hot-plate. Finally, solutions were filtered using filtering paper (Watman, 42 ashless), transferred into a 25 ml flask and double-distilled water was added up to the marked volume. Samples of pasteurized and local products were provided using dry digestion processing.
In this study, flame atomic absorption was applied to determine lead, cadmium, copper and iron (Shimadzu 680 AA, made in Japan) in all of samples.
Result and Discussion
Differences between elements were significant (p<0.05) for all samples. Standard deviations and mean values of Pb, Cd, Cu and Fe in different products, during May, June and July were tabulated in Table 1 and 2 and Figure 1-4. Statistical analysis was performed using SPSS 19 software, paired t-test model.
The results showed that average concentration of above elements in local butter and butter milk were less than pasteurized samples of the same items, but pasteurized creams in compare with local cream contained less value of these metals. The average level of the lead concentration in all products of local and pasteurized cream and butter, concentration of Cu in pasteurized and local cream and butter and pasteurized butter milk, concentration of Cd in local butter milk, and concentration of Fe in pasteurized butter milk are higher than MRLs. In this research results show that elements have more tendencies toward serum phase, another word to turn into butter milk.
Table1: Mean content and standard deviations of metals in pasteurized products, during May, June and July
| pasteurized products |
Pb (mg/kg DW±SD*) |
Cd (mg/kg DW±SD) |
Cu (mg/kg DW±SD*) |
Fe (mg/kg DW±SD*) |
|
Cream |
0.832 ± 0.151 |
N.D |
0.110 ± 0.280 |
0.828 ± 0.400 |
|
Butter |
0.879 ± 0.137 |
N.D |
0.266 ± 0.960 |
1.851 ± 0.446 |
|
Butter milk |
0.886 ± 0.295 |
0.001 ± 0.002 |
0.419 ± 0.208 |
3.227 ± 0.188 |
*SD= Standard Deviation
Table2: Mean content and standard deviations of metals in local products, during May, June and July
| Local products |
Pb (mg/kg DW±SD*) |
Cd (mg/kg DW±SD) |
Cu (mg/kg DW±SD*) |
Fe (mg/kg DW±SD*) |
|
Cream |
0.839 ± 0.231 |
0.001 ± 0 |
0.180 ± 0.036 |
0.889 ± 0.255 |
|
Butter |
0.849 ± 0.231 |
N.D |
0.180 ± 0.027 |
1.274 ± 0.419 |
|
Butter milk |
0.862 ± 0.191 |
0.006 ± 0.002 |
0.321 ± 0.063 |
1.909 ± 0.504 |
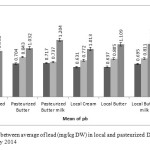 |
Figure1: Comparison between average of lead (mg/kg DW) in local and pasteurized Dairy products, in May, June and July 2014 Click here to View figure |
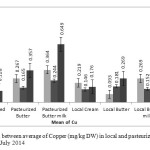 |
Figure2: Comparison between average of Copper (mg/kg DW) in local and pasteurized Dairy products, in May, June and July 2014 Click here to View figure |
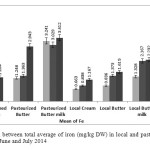 |
Figure3: Comparison between total average of iron (mg/kg DW) in local and pasteurized Dairy in products, in May, June and July 2014 Click here to View figure |
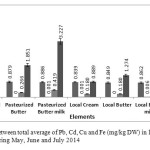 |
Figure4: Comparison between total average of Pb, Cd, Cu and Fe (mg/kg DW) in local and pasteurized dairy products in during May, June and July 2014 Click here to View figure |
One of the main sources of lead contamination is combustion of vehicles; this is why we can find more lead spared all over lands nearby roads, than lands far from road. Heavy lead particles resulting from combustion of vehicles deposit on the roadsides and smaller particles spared into air, and later will be carried into soil through rain and snow15.
The results of an investigation showed that most of elements transferred into Butter milk, which coincides with those reported by Morhan et al.16. This investigation also showed that the amount of elements, increased by passing time. In an investigation Saeedifar et al. (2014), perceived that the amount of lead and cadmium increased by passing time17. In a research conducted by Givianrad et al. (2014), they found out that exposure to cadmium has been via contaminated water and lead dispersed in the air, has leaked into vegetables, and they found out that some plants showed more sensitivity to cadmium in water than others18. Under high shear of butter churn, fat globules break, and part of membrane are recovered in the butter milk. In butter production process, while cream is blending, some air get into the content and cause fat globules membrane get sheared, and the level of fat globules would increase. During churning process, fat globules membranes get sheared and leak into butter milk. Fat globules tissues are rich of protein and phospholipids19. When fat globules break, the iron and copper of the fat globules membrane transfer to serum phase, then the level of iron and copper increase in the serum phase or butter milk. Fat fluctuations during lactation period can cause changes in fat level in butter milk and as a result, it can cause changes in the elements existing in membrane. Most likely, decrease of solid fat content in butter milk during late time of lactation can be attributed to changes of the compounds during late time lactation period in milk samples.
Consequently, great amount of primary milk fat were transferred to butter and the level fat in the butter milk showed a decrease. Lactation period and strain are main factors, which affect the size of fat globule. During early time of lactation the level of milk fat is low and at the end of lactation, milk is rich of fat. Subsequently, it could be said that percentages of milk fat from beginning up to end of lactation period would increase20.
In a research by kitts et al, the ability of solid content of butter milk to make complexes with Fe+2 and Fe+3 was investigated and compared with other complexes. The result shows that solid content of butter milk is able to bond with 60-90% Fe+2 and maximum 55% with Fe+3 ions21.
Changes of butter milk fats resulting from the milk samples can be attributed to fluctuation of the amount of fats during lactation period.
In this study, the results show that during process of extracting butter from cream, more value of lead, copper and iron were entered into serum phase, which is in conformity with other reports. Also another research performed to determine the value of cadmium and lead in butter milk, showed that the value of these elements in butter milk are more than butter and cream22. Another research indicated that the value of lead and cadmium would increase during passage of the time, which is significantly in compliance with the findings of this research.
Conclusion
In this project, the concentrations of all heavy metals were increased during the churning process. The average amount of lead, copper and iron in local butter and butter milk was evaluated less than pasteurized butter and butter milk. Nevertheless, the average concentration of the mentioned elements in local cream were determined more than pasteurized cream, which is due to animal feed and lactation period. The most concentration of iron, lead and copper was found in pasteurized and local butter milk, besides the most concentration of cadmium was observed in local butter milk. Consequently, the pasteurized cream could be considered as a safest dairy product in this present study.
Acknowledgments
The authors are so grateful to the Laboratory Complex of I.A.U., science and research branch for valuable technical assistance.
References
- Enb, A.; Abou Donia, M. A.; Abd-Rabou, N.A.; Abou-Arab, A. A. K.; El- Senaity, M. H.; Global veterinaria. 2009, 3, 268-275.
- Radzymińska, M.; Smoczyński, S.; Kopeć, M.; Pol. J. Environ. Stud. 2007, 17, 95-100.
- Coni, E.; Bocca, A.; Coppolelli, P.; Caroli, S.; Cavallucci, C.; Trabalza Marinucci, M.; Food chem. 1995, 57, 253-260.
- Szlyk, E.; Szydlowska-Czerniak, A.; J. Agric. Food Chem. 2004, 52, 4064-4071.
- Ganjavi, M.; Ezzatpanah, H.; Givianrad, M.H.; Shams A.; Food Chem. 2010, 3, 525-528.
- Givianrad, M.H.; Hashemi, A.; Orient. J. Chem. 2014, 30, 737-743.
- Masoudinia, H.; Nateghi, M.R.; Khosousi, T.; Orient. J. Chem. 2014, 30, 1663-1670.
- Ziarati, P.; Ziarati, N.N.; Nazeri, S.; Saber-Germi, M.; Orient. J. Chem. 2015, 31, 317-326.
- WHO, World Health Organization. Trace elements in human. Who Technical report Series, No. 532, WHO, Geneva, 1973.
- FSA (Food Standards Agency). Measurement of the concentrations of metals and other elements from the 2006 UK total diet study. Food Surveillance Information Sheet; 2009.
- NZFSA (New Zealand Food Safety Authority); New Zealand Total Diet Study. http://www.nzfsa.govt.nz/science/research-projects/total-diet-survey/reports.
- Leblanc, J. C.; Guérin, T.; Noel, L.; Calamassi-Tran, G.; Volatier, J. L., Verger, P.; Food Addit. Contam. 2005, 22, 624-641.
- Trumbo, P.;Yates, A.A.; Schlicker, S.; Poos, M.; J Am Diet Assoc. 2001, 101, 294-301.
- Khalil, H. M.; Salime, A. F.; Life Sci J. 2013, 10, 648-652.
- 15. Han, W. Y.; Shi, Y. Z.; MA, L.F.; Ruan, J. U.; Zhao, F.J.; Chemosphere. 2007, 66, 84-90.
- Morhan, M. A.; El-Gendy, S. M.; Said, A. I.; Mohamad, T.H.; Egypt. J. Agric. Res. 2011, 89, 651-659.
- Saeedifar, F., Ziarati, P., Ramezan, Y.; Int. J. farm. Alli. sci. 2014, 3, 60-65.
- Morin, P., Britten, M., Jemienez-Flores, R., Poulio, Y.; J. Dairy Sci. 2007, 90, 2132-2140.
- Givianrad, M.H.; Sadeghi T.; Larijani, K.; Hosseini, S.E.; J. Food Tech. Nutr. 2011, 30, 38-44.
- Pourahmad, R., Fadaei, V., Tehran Marze Danesh publ. 2008, 324, 46-51.
- Wong, P.Y.Y.; Kitts, D.D.; J. Dairy Sci. 2003, 86, 1541-1547.
- Hayashi, M.; Lto, O.; Ohira, S.; Akuzawa, Y.; B. Environ. Contam. Tox. 1982, 29, 658-664.

This work is licensed under a Creative Commons Attribution 4.0 International License.
![]()
A New Edition of Web of Science
Journal Impact Factor
2022: 0.5
Five Year: 0.8
Journal is Indexed in

Cabells Whitelist
![]()


