Chemical Composition Profile of Canned and Frozen Sweet Corn (Zea mays L.) in Iran
Akram Ahmadi1, Parisa Ziarati2*
1Department of Food Sciences & Technology, Faculty of Advanced Sciences & Technology , Pharmaceutical Sciences Branch, Islamic Azad University ,Tehran - Iran (IAUPS ) 2Department of Medicinal Chemistry, Faculty of Pharmacy, Pharmaceutical Sciences Branch, Islamic Azad University, Tehran - Iran (IAUPS ) Corresponding Author E-mail: ziarati.p@iaups.ac.ir
DOI : http://dx.doi.org/10.13005/ojc/310256
Article Received on :
Article Accepted on :
Article Published : 27 May 2015
Maize is one of the oldest and most productive popular grains and can be consumed as food at various developmental stages from baby corn to mature grain. The maize can be processed in different products at traditional level as well as industrial scale. Due to vast corn consumption by people in this research the concentration of histamine ,some trace and essential mineral and also heavy metals has been determined in 120 samples of popular brands of canned and frozen sweet corn in 2014. These samples (60 of them were canned corn and the rest were frozen) were collected from different local markets of Tehran, Iran. For reliable, accurate and precise measurements, all canned and frozen samples had the same date of producing. Samples were randomly purchased for analysis and analyzed according to standardized international protocols by wet digestion method. Histamine content was determined by Capillary Electrophoresis while metals were determined by Atomic absorption spectrometer. The results obtained revealed that, the mean ranges of the elements analyzed in (μg.g-1) between the frozen and canned food are as follows: Ni (0.31 – 17.44), Zn (204.14 – 266.76), Cu (6.22 – 8.03), Ca (1611 –8557), Mg (1063 – 1208), Fe (1.98-87.23), Sn (19.01- 350.8) respectively. Some of the measured values found, not only relatively high in canned compared to frozen food samples, but also exceeds the international tolerance levels. Histamine content in 95% of samples was lower than maximum level set by WHO. According to variance analyses of data, there was a positive correlation between the storage time and heavy metal contents especially tin, zinc and iron and they were varied significantly (p < 0.001) after 3 months of storage .The monitoring of mineral and heavy metals in frozen and canned food samples is vital important challenge to control and improve the food industry strategies.
KEYWORDS:Maize; productive popular; Chemical; Composition;
Download this article as:| Copy the following to cite this article: Ahmadi A, Ziarati P. Chemical Composition Profile of Canned and Frozen Sweet Corn (Zea mays L.) in Iran. Orient J Chem 2015;31(2). |
| Copy the following to cite this URL: Ahmadi A, Ziarati P. Chemical Composition Profile of Canned and Frozen Sweet Corn (Zea mays L.) in Iran. Orient J Chem 2015;31(2). Available from: http://www.orientjchem.org/?p=8826 |
Intorduction
The maize (Zea mays L.) is a monoic annual plant which belongs to maideas tribe and the grass family of gramineae , the plant is unable to disperse the seeds as a wild plant and instead it requires the intervention of the man to remove the husk, shell and sow its grain to complete the reproductive cycle. The maize represents to all maize-based groups a source of life. Although maize is original from Mesoamerica, it is very adaptable to different weathers, and nowadays its consumption is worldwide. In fact, the maize is the most widely grown cereal crop. . In the global production of cereals crops, the maize rank first after rice (paddy) and wheat. Likewise, in countries with developing economies, such as Latin-American and Africa the maize rank first and in Asia rank third after rice and wheat (1). Due to its worldwide distribution and relative lower price to other cereals, the maize has an ample uses than any other cereals. In many developing countries the maize is a major staple food and its consumption is very high. The maize can be processed in different products at traditional level as well as industrial scale. Some special advantages of the maize beside the broad global distribution, its lower price, the diverse type of grains and the biological and industrial properties, make the maize an adequate product for its utilization. The maize has a very wide range of uses than any other cereal. It can be used as staple food for human consumption, animal feed and for many industrial uses. Maize in general is used in more ways than any other cereal. White maize in particular is preferred in developing countries as human food due to the organoleptic properties. In contrast, yellow maize is used in developed countries for feeding livestock and poultry. The yellow maize is desirable, for instances, to increase the yellow color characteristic of the eggs yolk. In any case, maize is used either home cooked and industrial, as fodder, feed animals and fermentation in various industrial products. Iran has to import rice and other cereals such as soybean, sunflower, maize and canola from India, Pakistan Bangladesh and Thailand (2, 3). Iran imported 3.5 million tons of corn in the current year, more than half of 5.85 million tons which is needed by the domestic market (4). Corn crops play major roles in the Iranian agriculture sector. Corn has important role in linkages within the agricultural sector among various crops and between crops and live stocks (5). The yield of corn has increased from 32 thousands tones to 500 thousands tones during 1980-2005 (6). Corn products in the diet provide a significant portion of the minerals and trace elements required by both animals and humans (7, 8).
The most common heavy metal contaminants are Cd, Cu, Pb and Zn, and for canned food there is a great concern about tin (2). Although tin is not a toxic element, there are studies reporting gastrointestinal perturbations when it is present in concentrations above 200 mg/kg (9-11). When the chemical contamination reaches at this level the organoleptic properties of the food can be seriously affected. Tinplate is widely used in food industry as a robust form of packaging, allowing minimization of headspace oxygen and sterilization of foodstuff within the hermetically sealed can, giving a long, safe, ambient shelf life with no or minimal use of preservatives[Moreover, when the contamination reaches at this level the organoleptic properties of the food can be seriously affected. Tinplate is widely used in food industry as a robust form of packaging, allowing minimization of headspace oxygen and sterilization of foodstuff within the hermetically sealed can, giving a long, safe, ambient shelf life with no or minimal use of preservatives(10). Some tin will dissolve into the food content as a result of the use of tinplate for food and beverage packaging, especially when plain uncoated internal surfaces are used. The Provisional Tolerable Weekly Intake for tin is 14 mg/kg body weight (11-15) and recommended maximum permissible levels of tin in food are typically 250 mg/kg (200 mg/kg UK) for solid foods and 150 mg/kg for Beverages (15). The levels of toxins found in corn in commercial channels vary from country to country, however, it is generally noted that higher levels are usually found in corn grown in countries with warmer climates (16). Histamine and the similar amine substances occur naturally in a variety of foods .Poisoning with histamine can cause the so called pseudoallergic reactions, in other words, it can produce symptoms such as: urticaria, eczema, diarrorea, or spasm of bronchi. The content of histamine is regarded as a criterion of the quality of food. Even if bacteria have been killed, the enzyme activity may continue to produce histamine. Histamine is produced by decarboxylation of histidine. Foods rich in proteins (fish, meat, and cheese – rich in free histidine) as well as sparkling wine and beer are regarded as histamine containing products because lactic acid fermentation also increases the histamine production (17). In this study the primary objective was to provide information on the content of some mineral essential, trace and heavy metal elements (Zn, Ni, Fe, Cu, Na, Ca , Sn, Mn, K and Mg) in corn-based foods directed primarily for human consumption. Some of the studied elements serve nutritionally as micronutrients; however for tin no beneficial effects have yet been ascribed. Therefore, it is important to establish the dietary levels of these elements in the different brands of corn products commercially available and in fact currently being eaten by the consumers in two forms of frozen and canned. In the case of cereals food products eaten by humans require some form of processing, Whole kernel sweet corns processed by both canning and freezing techniques were examined. The second objective of this research was to determination of histamine in corn samples and compares it into two different forms of corn samples.
Material and Method
Food Sampling
The food products were purchased at two different times in a month and continued for 6 months in 2014. These products were retained in their original containers to avoid contamination problems: frozen items were kept in a freezer until used. The concentration of mineral and toxic heavy metals has been determined in 120 samples of canned corn and frozen sweet corn, for comparison in 2014. These samples (60 of them were canned corn and the rest were frozen) were collected from different local markets of Tehran, Iran.
Histamine Determination by Capillary Electrophoresis
All chemicals were of analytical reagent grade. Deionized water was used throughout. The following compounds were used: 0.1 mol/l HCl; 1.0 mol/l NaOH; 1.2 mol/l H3PO 4 (dilute 12.2 ml of 85% acid in a 100ml flask); 1% solution of orthophtalate aldehyde; 1 mg/ml histamine solution (dissolve 167.4 mg of histamine hydrochloride and add 0.1 mol/l HCl in 100ml flask). The capillary electrophoresis instrument was programmed to run a voltage gradient of 5–30 kV over 13 min, with replenishment of the sodium citrate (20 mM, pH 2.5) buffer after every injection. The following rinses were used after each sample: water 1 min, aqueous NaOH (0.1M for paste extracts, 0.5M for fruit ex-tracts) 1 min, water 1 min, running buffer 1 min. Detection was at 212 nm and the operating temperature was set to 35°C. Samples and standards were injected hydrodynamically (50 mbar for 10 s) (2, 18, 19, 30).
Zinc, Manganese, Copper, Nickel , Tin and Potassium Determination
For Zinc, Manganese, Copper, Nickel , Tin and Potassium concentration in canned and frozen corn samples , powered samples were dried in oven for 36 hours at a temperature of 85°C. The samples were then ground and sieved through 0.5 mm sieve. The powdered samples then subjected to the acid digestion using concentrated nitric acid (65% Merck), Sulfuric acid (96.5% Merck) and per chloric acid (70% sigma). Analar grade hydrogen peroxide (about 30%) also was used for the digestion. Application of concentrated HNO3 along with thirty percent hydrogen peroxide H2O2 (Merck) for mineralization of samples to the complete digestion of samples (25- 27) following Environmental Protection Agency (EPA) Method 3052 was done.
Two gram of air-dried of each homogeneously corn samples accurately weighed and 30.0 mL of the digestion mixture (4 parts by weight of nitric acid: 2 parts of Sulfuric acid & 3 parts by weight perchloric acid) and heated slowly by an oven and then rise the temperature. The remaining dry inorganic residues were dissolved in 30.0 mL of concentrated nitric acid and the solution used for the determination of trace and essential mineral elements. Blanks and samples were also processed and analyzed simultaneously. All the chemicals used were of analytical grade (AR). Standardized international protocols were followed for the preparation of material and analysis of heavy metals contents (2, 20-24). The samples were analyzed by Flame Emission Spectrophotometer Model AA-6200 (Shimadzu, Japan) using an air-acetylene, flame temperature: 2800°C, acetylene pressure: 0.9–1.0 bar, air pressure: 4.5–5 bar, reading time: 1–10 sec (max 60 sec), flow time: 3-4 sec (max 10 sec), using at least five standard solutions for each metal and determination of potassium content was followed by FDA Elemental analysis (25) In order to verify of reliability of the measuring apparatus, periodic testing of standard solutions was performed . The accuracy was checked using quality control test for fungi and their substrate samples to show the degree of agreement between the standard values and measured values; the difference was less than 5%.
Iron Determination
The aliquot was passed through the atomic absorption spectrophotometer to read the iron concentration. Standards were prepared with a standard stock of 10 mg/L using ferrous ammonium sulphate where 3 – 60 ml of iron standard solution (10 mg /L) were placed in stepwise volumes in 100 ml volumetric flasks. 2 ml of perchloric acid were added and then brought to the volume with distilled water. The concentration of iron in the aliquot was measured using the atomic absorption spectrophotometer in mg/L. The whole procedure was replicated three times (26, 27,28, 29,30).
Calcium, Sodium and Magnesium Determination
5 ml of the aliquot were placed in a titration flask using a pipette and diluted to 100 ml with distilled water and subsequently 15 ml of buffer solution, ten drops of Eriochrome black T indicator and 2 ml of triethanolamine were added. The mixture was titrated with Ethylene-Diamine-Tetra-Acetate (EDTA) solution from red to clear blue (31).
Results and Discussion
Results were determined as mean ± SD of dry weight from three replicates in each test. The samples were analyzed by wet digestion method and standardized international protocols were followed for the preparation of material and analysis of heavy metals contents and analyzed by Atomic Absorption Spectrophotometer in Research Laboratory in Pharmaceutical Sciences Branch, Islamic Azad University.
The mean values of mineral and heavy metals and histamine concentrations in canned and frozen corn samples studied are given in Table 1. In table 1, obtained results show that, the highest concentration in canned food samples was for tin, 314.22±18.04 and lowest 33.74± 6.02 (μg.g-1 DW). According to variance analyses of data, heavy metal concentration and histamine in canned corn samples were significantly affected by company factory and time of storage.
Table1: Concentrations of histamine and heavy metals (μg.g-1 DW± SD) in canned and frozen corn samples.( Data represent the mean of three replicates)
| Minimum | Maximum | Mean | |
| Histamine | 2.78± 0.88 | 256.4± 11.6 | 105.8± 4.2 |
| Nickel | 0.31± 0.05 | 17.44 ± 1.06 | 14.78 ±4.22 |
| Calcium | 1611± 28 | 8557 ± 34 | 3421± 30 |
| Tin | 33.74± 6.02 | 314.22±18.04 | 156.21±15.88 |
| Zinc | 204.14 ± 1.05 | 266.76 ± 5.78 | 215.88±11.67 |
| Copper | 6.22 ±1.230 | 8.031± 2.764 | 7.654 ± 1.222 |
| Iron | 1.98± 0.44 | 87.23± 12.91 | 56.41±11.74 |
| Magnesium | 1404± 54 | 1762 ± 33 | 1576 ± 34.70 |
| Manganese | 1063±120.14 | 1208±73.28 | 1104 ±105 |
*SD=Standard Deviation
This research show a significant effect on the Nickel, Iron and Tin contents in corn samples tested (p≤0.001) as these mean metal contents in canned corn samples were significantly higher and even in canned samples especially tin, zinc, Nickel and iron concentrations were varied significantly (p < 0.001) after 3 months of storage. In figures 1, 2 and 3 the mean contents of these metals were illustrated in canned corn samples after 3 months of the production date. Figures showed that even in canned corn the differences of metal content are remarkably high.
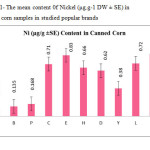 |
Figure1: The mean content 0f Nickel (μg.g-1 DW ± SE) in canned corn samples in studied popular brands Click here to View figure |
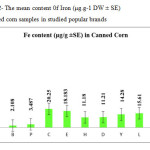 |
Figure2: The mean content 0f Iron (μg.g-1 DW ± SE) in canned corn samples in studied popular brands Click here to View figure |
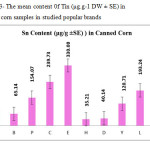 |
Figure3: The mean content 0f Tin (μg.g-1 DW ± SE) in canned corn samples in studied popular brands Click here to View figure |
Canned and Frozen Sweet Corn
Canned and frozen sweet corn are widely accepted food products and are an important part of the human diet. In canned or frozen corn where the whole kernel is eaten the drained edible product had a moisture content of approximately 75 %, which was in agreement with other published data (7). The major differences between canned and frozen corn are storage temperature and storage container. All items designated “canned” in this study were purchased in metal cans, whereas all frozen items were purchased in 450-500 g weight packaged. After these samples had reached ambient temperature conditions the liquid was drained off completely before weighing the drained sample for analysis. Results are summarized in Table 1 (on a dry basis) of the metal content of canned and frozen whole kernel corn. Except for the higher value for tin, Ni and Fe in the canned yellow corns (brand O and E), other metal values for canned and frozen corns were approximately similar.
Conclusions
The studied measured metals in processed and prepared corn food products are inherent in raw corn in parts per million concentration range. These naturally occurring trace elements are concentrated mainly in the germ fraction of corn. As might be expected, in the variety of unprocessed or processed corn based foods analyzed metal content depended primarily on whether the germ was present in the finished product. By relating metal concentration values for the corn foods selected to values established for whole kernel corn. It was possible to indicate that minor additional quantities of these same metals may have been introduced into the products as a result of processing. In conclusion canned corn products studied here contribute only minor quantities of histamine, Iron, Nickel and Tin to the diet when the total amount of food eaten daily is considered. Of special significance are the extremely low quantities of tin in all corn products.
References
- FAO/WHO Expert Committee on Food Additives, “Evaluation of certain food additives and contaminants,” WHO Technical Report Series 776, Thirty-Third Report of the Joint FAO/WHO Expert Committee on Food Additives, Geneva, Switzerland, 1989.
- Mohammadi, M.; Mohebbi, G.H; Akbarzadeh, S.; Shojaee, I. Afri. J. Biotech. 2012, 11 (38), 9230-9234.
- Rezazadeh, T.; Aghaiypour, K.H.; Heidari, Z. Croat. J. Food Sci. Technol. 2013, 5 (2), 92-95.
- The Fars News Agency reported. Available from: http://en.trend.az/business/economy/2104691.html.
- Yazdani, S.; Shahbazi, H.; Haghsheno, M.; Sadat-Barikani, S.H. American-Eurasian J. Agric. & Environ. Sci. 2008, 4 (5), 633-639.
- The Iranian Ministry of Agriculture, 2006.Available from: www.Agri-Jahad.com.IAO.
- WATT, B. K.; MERRILL, A. L. U.S. Dcp. Agr. Handbook 8 revised 963, 1974.
- http://naldc.nal.usda.gov/download/29981/PDF.
- Boa Morte, E.S.; Graças, M.; Korn, A.; Lúcia, M.; Saraiva, M.F.S.; Lima, J. L.F.C. ; Pinto P.C. Talanta. 2009, 79 (4), 1100-1103 .
- Blunden, S. ;Wallace, T. Food and Chemical Toxicology. 2003, 41 (12), 1651-1662.
- MUNTEANU, M.; CHIRILA, E.; STANCIU, G.; MARIN N. Ovidius University Annals of Chemistry. 2010, 21 ( 1), 79-82.
- JECFA, Toxicological evaluation of certain food additives and contaminants. WHO Food Additives. Series 24. Thirty-third Report of the Joint FAO/WHO Expert Committee on Food Additives,1988a.
- MAFF, The Tin in Food Regulations. S .I. 496. UK Ministry of Agriculture, Fisheries and Food, HMSO, London, 1992.
- JECFA, Evaluation of certain food additives and contaminants. WHO Technical. Report 776. Thirty-third Report of the Joint FAO/WHO Expert Committee on Food Additives, 1988b.
- Codex, Position Paper on Tin, Codex Committee on Food Additives and Contaminants. Thirtieth Session, The Hague, Netherlands, March 1998. Joint FAO/WHO Food Standards Programme. CX/FAC/98/24,1998.
- Miller, J.D. Abstracts of Papers (p.21). International Conference on the Toxicology of Fumonisin. June 28-30, 1999. Arlington, VA.
- Sattler, J.; Hafner, D.; Klotter, H.J.; Lorenz, W.; Wagner, P.K. Agents Actions . 1988, 23, 361– 365.
- LESZCZYŃSKA, J.; WIĘDŁOCHA, M.; PYTASZ, U. Czech J. Food Sci. 2004, 22(3), 81–86 . Available in Site: http://www.agriculturejournals.cz/publicFiles/50624.pdf.
- ELEKBOLYGO, P.; COOPER, K.; MICHAELJESSOP, F JOURNAL OFAOAC INTERNATIONALVOL. 2000, 83 (1), 89-94.
- Silla-Santos, M.H. Int. J. Food Microbiol. 1996, 29, 213–231.
- Bieganski,T.; Kusche, J.; Feussner, K.D.; Hesterberg, R.; Richter, H.; Lorenz, W. Agents Actions . 1980, 10, 108–110.
- Bieganski, T.; Kusche, J.; Feussner, K.D.; Hesterberg, R.; Richter, H.; Lorenz, W. Arch Immunol Ther Exp (Warsz).1980, 28, 901–906.
- Bieganski, T.; Kusche, J.;Lorenz, W.; Hesterberg, R.; Stahlknecht, C.D.; Feussner, K.D. Biochim Biophys Acta . 1983, 756, 196–203.
- Bieganski ,T. Acta. Physiol. Pol . 1983, 34, 139–54.
- Maintz, L.; Novak, N. American Society for Clinical Nutrition. 2007.
- Sattler, J.; Hafner, D.; Klotter, H.J.; Lorenz, W.; Wagner, P.K. Agents Actions. 1988; 23, 361– 365.
- Available on line: http://www.chilealimentos.com/medios/2008/servicios/infodemercado/prensaespecializada2006/Junio_2006/tomato_processing_Iran_2006_WPTC.pdf .
- Mohammadi, S.; Ziarati, P. Oriental Journal of Chemistry. 2015, 31 (1). Available from: http://www.orientjchem.org/?p=7825.
- Ziarati, P.;Ziarati, N.N.; Nazeri, S.; Saber-Germi, M. Oriental Journal of Chemistry. 2015,31 (1). Available from: http://www.orientjchem.org/?p=7693.
- Mirmohammad Makki, F.; Ziarati,P. BIOSCIENCES BIOTECHNOLOGY RESEARCH ASIA.2014, 11(2), 537-544.
- Abedi, S.; Peykani, G. R.; Kavoosi Kalashami, M. International Journal of Agricultural Management & Development (IJAMAD). 2011, 1(4), 197-206. Available online on: www.ijamad.com .

This work is licensed under a Creative Commons Attribution 4.0 International License.
![]()
A New Edition of Web of Science
Journal Impact Factor
2022: 0.5
Five Year: 0.8
Journal is Indexed in

Cabells Whitelist
![]()


