Adsorption behavior of methyl orange onto wheat bran: Role of surface and pH
Department of Chemistry, Mutah University, P. O. Box 7, Jordan
Corresponding Author E-mail : atef_sal99@yahoo.com
DOI : http://dx.doi.org/10.13005/ojc/310205
Download this article as:
![]()
This paper deals with the application of wheat bran (WB), an agricultural by-product, for the adsorption of methyl orange (MO) from aqueous solution. The characteristics of WS surface, such as surface functional groups, zero of point charge and conductivity were obtained. The removal of MO onto WB from aqueous solution was investigated by using parameters, such as pH, temperature, adsorbent dose and contact time. A spectrophotometer technique was used for measuring the extent of adsorption. The extent of dye removal decreased with increasing adsorbent dosage and also increased with increasing contact time and temperature. The results revealed that the sorption capacity increases from 12.34 to 19.85 mg/g when the temperature increased from 25 to 55 ﻩC. This suggests that the sorption of MO dye onto WB is endothermic and activated process indicating that the higher temperature is more favorable for the dye sorption. Optimum pH value for dye adsorption was determined to be 4.0. strong pH-dependence of MO adsorption onto WB together with FTIR results indicate to possible involvement of physical forces such as hydrogen bonding, Vander Waals and covalent chemical bonds in the adsorption process. In addition, the adsorption data of MO by WB were applied to Lagergren,s pseudo first-order, pseudo second-order and the rate constants of first-order adsorption (k1 = 1.34x10² min-1) the rate constants of second-order adsorption (k2 = 2.93x10⁻³ g/mgmin) were calculated, respectively.). The results indicate that WB could be employed as a low-cost alternative to other adsorbents in the removal of MO from aqueous solution.
KEYWORDS:Adsorption; WB; MO; Surface; pH; Temperature; Rate
Introduction
Synthetic dyes are widely used for textile dyeing , paper printing ,leather dyeing , cob lour photography and as additives in petroleum products [1]. They exhibit a wide range of different chemical structures ,primarily based on substituted aromatic and heterocyclic groups [2]. There are more than 100,000 dyes available commercially, most of which are difficult to biodegrade due to their centupled structure and synthetic origin [3]. the presence of very low concentrations of dyes in effluent is high visible and undesirable . The presence of color by blocking the passage of light through the water . Colored agents interfere with the transmission of light through water and hinder photosynthesis . Most of these dyes are harmful ,when in contact with living tissues for along time [4]. Physico – Chemical or chemical treatment of such wastewater is however possible. Many invesligators have studied different techniques for removal of colored dye from wastewater ,e.g., Chemical coagulation, nanofiltration, and adsorption onto different materials [5].
Although commercial activated carbon is a preferred adsorbent for color removal, its use is restricted due to high cost. In the country where economy plays a very big role, there is a need to search for low-cost affective sorbents. It well know that natural materials, waste materials from industry and a agriculture and biosorbents can be obtained and employed as inexpensive sorbents. recently, an extensive list of sorbent literature for dye removal has been complied by Crini and Banat et.al [4,6] .
Wheat is one of cereals used for the preparation of bread and other bakery products ,and wheat bran is the by –product of wheat bread production industry . WB is a rich source of dietary fibers and contains carbohydrates, proteins, starch ,sugar and celluloses [7]. There has also been some research in to the use of WB as an adsorbent . Farajzadeh and Monjig [7] reported the adsorption of heavy metals by WB . Butut and Baysal [8] studied the removal of pbl (II) using WB as low cost sorbent. Cicek et.al.[3] used WB to remove reactive dyes. Hamdaoui and Chua showed the suitability of WB for cationic dye MB adsorption [9]. Ozer and Dorsum prepared Activated carbon from WB dehydration [10].
Dyes are classified into three broad categories (a) anionic : direct, acid and reactive dye; (b) cationic: all basic dyes and (d) nonionic : dispersed dyes [8]. Methyl Orange is a water soluble azo dye , which is a widely used in the textile, printing , paper manufacturing , pharmaceutical , food industries and also in research laboratories. In the Analytical Chemistry laboratories it is mainly used as an acid base indicator due to its ability to function as weak acid as the aqueous solution of the dye has a PH value a proximately 6.5 (5g/l , H2O,20ﻩC) [11]. A dyes are well known carcinogenic organic substances. Like many other dyes of its class Methyl orange on inadvertently entering the body through ingestion, metabolites into aromatic amines by intestinal microorganisms . Reductive enzymes in the liver can also catalyze the azo Linkage to produce aromatic amines and can even lead to intestinal cancer [12]
Adsorption may be classified as physical or chemical depending on the nature of forces involved . When adsorption occurs without any chemical reaction , it is generally termed as” physical adsorption ” . It is brought about as a result of Vander Waals forces . If the adsorbate undergoes chemical interaction with the adsorbent, the phenomenon is reffered to as “chemical adsorption ” . It is involved a sharing of electrons between the adsorbate molecules and surface of the adsorbent [13]. This chemistry may include complexation involving ligand exchange, covalent bonding ,hydrogen bonding and our understating may even be stretched to include steric or orientation effects [14 ]. The equilibrium adsorption isotherm is fundamental in adsorption, and is important in the design of adsorption system. This rate controls the residence time of adsorbate uptake at the solid – solution interface[15]. The adsorption of dyes is mainly depedent on the dyes properties and Structure, and to an equal extent on the surface chemistry of the adsorbent .The role of Texture and surface functional groups of sorbent must be explored and highlited in any adsorption process. Investigations describing the adsorption of dyes on solids rarely explain the role of the surface chemistry and to some extent on the effect of Various operating parameters influencing the adsorption process[16,17].
The aim of present study was to examine optimum adsorption conditions such as pH, sorbent dose, contact time and temperature of cost–effective sorbent . The surface characteristics of the adsorbent were determined versus point of zero charge, FTIR analysis of the surface functional groups, pH and conductivity measurements. The adsorption kinetic properties were also explored.
Experimental
Reagents and apparatus
All chemicals used in this study were of analytical reagent grade. Doubly distilled water was used in solution preparation. The pH pf solution was measured using pH-meter (315i/SET). The absorbance of dye solution was measured using an UV-VIS spectrophotometer ( ). The conductivity measurements were done using a conductivity meter ( ). The FTIR spectra were recorded using spectrophotometer (Mattson 500, UK ). A mechanical shaker (Labortechnik mbH, Germany) with a constant temperature water bath was used for all the adsorption experiments for agitating the samples for a desired contact time.
Adsorbent preparation
WB used in this study was purchased from local flour mills (Mutah, Jordan).
The material was washed several times with distilled water to remove all dirt particles. The washed WB was then dried in a hot oven at 70 ﻩC for 8 h to constant weight . The sorbent material was screened through? mm sieve and used as such without any pretreatment.
Adsorbent characterization
Determination of pH point of zero-charge
The pH point of zero-charge (pHZPC ) of WB was carried out as described elsewhere[1850 ml of 0.01M NaCl solutions were placed in different closed Erlenmeyer flasks and corked. The pH of each solution in each flask was adjusted to initial (pHi) values 2, 4, 6, 8, 10 and 12 by adding 0.1M HCl or 0.1M NaOH solutions. Then 0.5 g of WB was added and agitated in a shaker for 1 h and allowed to stay for 24 h to reach equilibrium at ambient temperature. At the end of 24 h contact period, the final pH values (pHf) were measured. The pHZPC was determined from the plot of pHf versus pHi.
FTIR analysis
The surface functional groups on free and dye loaded WB were examined using Fourier transform infrared (FTIR) spectroscopy. Discs were prepared by first mixing 1 mg of powdered WB with 100 mg of KBr in an agate mortar, then pressing the resulting mixture under 10 tons/cm2 for 5 min. The spectra were recorded between 4000 and 400 cm-1 using a Mattson 5000 spctrophotometer, UK.
Preparation of M0 solutions
The characteristics of MO dye are given in Table. 1. Stock solution of MO (1g/L) was prepared in doubly distilled water and desired concentrations of the dye were obtained by diluting the same with water. Calibration curve of MO was prepared by measuring absorbance of different predetermined concentrations of the samples at ג= 506 nm. Final concentration of dye in experimental solution was calculated from the linear regression equation ( Absorbance= 0.0337*concentration (mg/l) +0.025) of the calibration curve. The synthetic dye sample calibrated in order to find out various absorbencies at various concentrations. The calibrated results are very effective to identify the respective color removal capacities of the WB adsorbent. Fig.1 shows the graphical representation of calibration of MO.
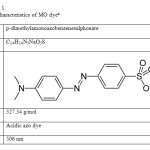 |
Table1: The characteristics of MO dyea Click here to View table |
aThe data were obtained from Aldrich-Sigma chemical databases
website : http://www.sigmaaldrich.com/catalog/product/sigma/c3886?lang=en®ion=JO
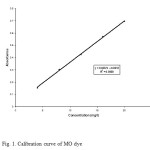 |
Figure1: Calibration curve of MO dye Click here to View figure |
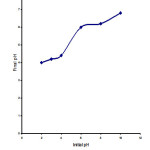 |
Figure2: plot for determination of the pHzpc of WB Click here to View figure |
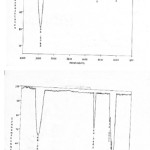 |
Figure3a,b: FTIR spectra of free and dye loaded WB Click here to View figure |
Equilibrium adsorption studies
Experiments were conducted using a batch procedure. 100 ml aqueous solution of MO with predetermined initial concentration (20-100 mg/l) was taken in different 250 ml stoppered Erlenmeyer flasks. Powdered WB (0.5 g) was added to each flask. The flasks were agitated (160 rpm) at 25±1 ﻩC for 240 min, which is expected to be the time required to reach equilibrium. At the end of agitation sorbent was separated by filtration through filter paper. The first part of filtrate was discharged to avoid effects of dye adsorption on the filter paper. The residual concentration of the dye in the supernatant was estimated spectrophotometrically. The same experiment was repeated at two different temperatures (40 ﻩC and 60 ﻩC). The effect of pH on sorption studies was investigated in the pH ranges of 2-10. A series of experiments were also conducted for different sorbent doses varying between 0.5-2.0 g per 100 ml dye solution. Blank containing no dye were conducted at similar conditions as control. The influence of operating parameters were studied by varying one parameter an keeping other constant. Stirring speed of shaker was kept constant thus ensuring equal mixing.
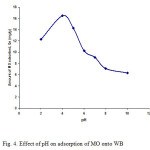 |
Figure4: Effect of pH on adsorption of MO onto WB |
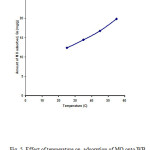 |
Figure5: Effect of temperature on adsorption of MO onto WB Click here to View figure |
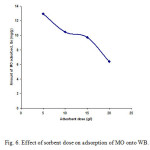 |
Figure6: Effect of sorbent dose on adsorption of MO onto WB. Click here to View figure |
Adsorption kinetics
The above experiment was repeated with 100 mg/l MO solution at 25±1 ﻩC and concentration of dye in the solution was determined at different time intervals. Each data point obtained from individual flask and therefore no correction was necessary due to withdrawal of sampling volume.
Calculations
The amount of dye adsorbed per unit weight of adsorbent (Qe, mg MO/g WB) was calculated as
Qe = (C0-Ce) *V/S (1)
Where C0 and Ce, the concentrations of MO dye (mg/l) in aqueous phase, respectively before and after adsorption; V is the volume of dye solution (ml); S is the weight of WB (g).
Results and discussion
Adsorbent characterization
The pHZPC of WB used in the present study was previously measured by batch equilibrium method. At the end of 24 h contact period, the amount of H+ or OH- ions adsorbed by WB was calculated from the difference between the initial and the final concentrations of H+ or OH- ions, determined from the initial and the final pH values (pHi and pHf, respectively). pHf readings for the determination of pHZPC were plotted as a function of pHi in Fig. 2. The pHf value of the plateau observed in Fig. 2 corresponds to the pH at which there is no net OH- or H+ adsorption. At this pH, the difference between the initial and the final [H+] or [OH-] is zero. This pH was determined to be 6.3 and taken as the pHZPC of the WB. The recorded FTIR spectra of free and dye loaded WB are depicted in Fig. 3a and Fig. 3b. The FT-IR analysis of the WB showed the presence of the following groups . C=O(1649.24 cm-1), -OH(3423.86 cm-1),C=C(1675 cm-1), C- O(1080.21cm-1), N-H(1155.43 cm-1),and NH2(3400-3500 cm-1). The intense peak at a frequency level of 3423,86 cm-1represents a mino group(-NH2) stretching vibration band. The – NH2 bands are superimposed on the side of hydroxyl (-OH) group at 3500-3300 cm-1.The strong peak at around 1650 cm-1 is caused by the C=O stretching band of carbonyl groups. The peak at 1155.43 cm-1 can be assigned to bending modes of-CH3 and some aromatic compounds. The strong C-O band at 1080.21 cm-1is due to –OCH3 group. The peak at 1026.19 is characteristic of C-O group of primary hydroxyl stretching that may be attributed to cellulose structure of WB. In spectrum of MO-loaded WB( figure 1b) the frequencies of free WB are shifted e.g.- NH2 group appears at 3435.44 cm-1 C=O group appears at 1635.74 cm-1 and characteristic C=O frequency appears at 1024.27. The peaks at 1155.43 cm-1 and 1080.21 cm-1 disappeared. These changes confirmed the participation of WB surface functional groups(C=O1– NH21– OH and – OCH3) in the adsorption reaction . Based on FTIR spectroscopy we suggested that the interaction of MO and WB occurs between active surface sites of WB and SO–3 –N =N- group on MO .
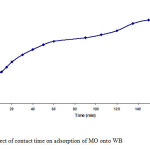 |
Figure7: Effect of contact time on adsorption of MO onto WB Click here to View figure |
Effect of pH on dye adsorption
In general, initial pH value may enhance or depress the uptake of solute. pHof adsorption medium influences not only the surface charge of adsorbent, the degree of ionization of the material present in the solution and the dissociation of functional groups on the active sites of the adsorbent, but also the solution dye chemistry [ 19]. The study evaluated the effect of pHon the adsorption of MO by WB over a wide range of pH(2.0-10.0). The influence of pH on adsorption of the dye is shown in Fig. 4. Adsorption of MO by WB had been found to be dependent on pH of the solution, which increased with the decrease in pH. From Fig. 4, it can be seen that the amount of dye adsorbed on the WB is high for pHbetween 2 and 6.3 and the best color removal 16.48 mg of dye per gram of WB was achieved at pH 4.0.The adsorbed amount of dye was lower at strongly acidic (2.0-3.0) and was much lower at alkaline(8.0-10.0) conditions. Therefore, the results clearly indicate that the sorption of MO dye onto WB was significantly affected by the pH value of the solution and acidic pH was favourable for the adsorption of the dye. Similar result was also obtained fro the adsorption of MO onto activated alumina at an initial pH 4.0 [20].In order to understand the role of pH on the sorption process, the surface charge of WB was determined by measuring the pHZPC. The effect of pH can be described on the basis of the influence of pH on the zero point of charge (pHZPC), which is the point at which the net charge of sorbent surface is zero. According to Al-Degs et al. [ 21 ], pHZPC can be used as index for the ability to become either positively or negatively charged, This ability is controlled by the pH of the surrounding solution. When pHof solution < pHZPC, the sorbent will react as positive surface and as negative surface when pHof solution > pHZPC. From other side, the observed pH dependence can be also related to the dye chemistry. MO is an acidic dye contains negatively charged sulfonated group (-SO3–Na+). Higher adsorption of the dye at lower pH is probably due to increase in electrostatic attraction between negatively charged dye molecule and positively charged WB surface. From other side, when WB (1 g) was stirred (160 rpm) with bidistilled water (150 ml. pH 5.9. electric conductivity 1.7 μS cm-1for 90 min), an increase in the pH and electric conductivity of water to 7.4 and 173 μS cm-1, respectively, was observed. The increase of pH can be interpreted by a possible fixation of H+ by the negative groups present on the WB surface and as a result the proton concentration decreases when the initial pH increases, and then the dye molecules have more chance to react with the active sites on the surface of WB because of a lower proton competition [ 9 ] . However, at pH 6.3 where surface charge of WB is neutral, adsorption of dye in this pH range may be attributed to physical forces only. At pH above 6.3, surface charge of WB is negative which hinders the adsorption by electrostatic forces of repulsion between negatively charged MO molecule and WB surface. Also lower adsorption of MO at alkaline pH is due to the presence of excess OH– ions competing with dye anions for the adsorption sites. At alkaline pH significant adsorption of the MO dye adsorption still occurred. It can be explained by formation of covalent bonding between surface –OH group of WB and negatively charged dye molecules. This can be suggested that the second mechanism, i.e., chemisorption might be operative [22]. Thus, strong pH-dependence of MO adsorption onto WB together with FTIR results indicate to possible involvement of physical forces such as hydrogen bonding, Vander Waals and covalent chemical bonds in the adsorption process.
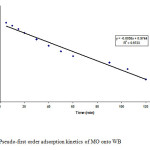 |
Figure8: Pseudo-first order adsorption kinetics of MO onto WB Click here to View figure |
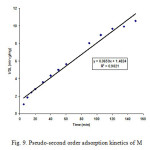 |
Figure9: Pseudo-second order adsorption kinetics of M Click here to View figure |
Effect of temperature on dye adsorption
Temperature has a vital effect on adsorption process as it can increase or decrease the amount of adsorption. To study the effect of temperature , sorption experiments of MO by WB were performed at four different temperatures, i.e., 25, 35, 45, and 55 ﻩC and the obtained results are presented in Fig. 5. The results in Fig. 5 revealed that the sorption capacity increases from 12.34 to 19.85 mg/g when the temperature increased from 25 to 55 ﻩC. This suggests that the sorption of MO dye onto WB is endothermic and activated process indicating that the higher temperature is more favorable for the dye sorption. The increase in dye adsorption with rise in temperature may be a result of increase in the mobility of MO molecules with temperature. Increasing temperature is known to increase the rate of diffusion of the adsorbed molecules across the external boundary layer and the internal pores of the adsorbent particles, owing to the decrease in the viscosity of the solution [23]. Furthermore increasing temperature may produce a swelling effect within the internal structure of the WB enabling large dye molecules to penetrate further [24]. Similar results has been reported by Cicek et.al [3] for the sorption of reactive dyes onto WB.
Effect of WB dose on dye adsorption
To optimize the WB dose for MO adsorption from its aqueous solution. Adsorption was carried out with different sorbent dosages. The dose of WB was varied from 0.5 to 2.0 g per 100 ml dye solution at concentration 100 mg/l, pH 4.0 and temperature 25±1 ﻩC. The amount of MO dye adsorbed by different masses of WB is presented in Fig. 6. It was observed that the adsorbed amount of MO dye per unit weight of WB decreased from 12.94 to 6.38 mg/g by increasing the sorbent dose from 0.5 to 2.0 g. The decrease in adsorption amount (Qe, mg/g) may be due to the splitting effect of flux (concentration gradient) between adsorbate and adsorbent with increasing adsorbent dose causing in amount of dye onto unit weight of adsorbent [3]. Another reason may be due to the particle interactive behavior, such as aggregation, resulted from high adsorbent dose. Such aggregation would lead to decrease in diffusional path length[23]. In addition, the adsorption sites remain unsaturated during the sorption process in these conditions.
Adsorption kinetics
Effect of contact time
The plot of Qt versus time, where Qt is the amount of MO dye sorbed at time t per unit weight of WB is shown in Fig. 7. In this plot, it is apparent that the extent of dye adsorption increased rapidly in the initial stages and became slower in the later stages until the attainment of equilibrium. As the surface adsorption sites become exhausted, the uptake rate is controlled by the rate at which the dye molecules are transported from the exterior to the interior sites of the adsorbent particles. Equilibrium time for the adsorption of MO on WB was found to be 150 min and the equilibrium adsorption capacity Qe was found to be 14.3 mg/g.
Rate of adsorption
The adsorption rate shows how much adsorbate can be adsorbed from the liquid phase onto the adsorbent within a unit time. The kinetics of adsorption of MO dye onto WB was described by using first order and pseudo second order model. The Lagergren,s equation for first-order kinetics is given as follows [ 25]
log(Qe-Qt) = log Qe – (k1/2.303)t (2)
The expression for pseudo second order rate equation is given as [ 26]
t/Qt = 1/k2Qe2 + t/Qe (3)
where Qe and Qt are the amount of MO dye adsorbed (mg/g) at equilibrium and at any time t; k1(min-1) and k2 (g/mg min) are the rate constants. Plot of log(Qe-Qt) versus t gives a straight line with correlation coefficient (R2 >0.97) for the first order adsorption kinetics and is shown in Fig. 8 for the initial dye concentration of 100 mg/l. The value of first order rate constant k1 is obtained from the slope of the curve is equal to 1.34×10⁻² min-1. This means that in case of strict surface adsorption, a variation in rate should be proportional to the first power of dye concentration. Fig. 9 shows the (t/Qt) versus t plot of the second order kinetics with correlation coefficient (R2 >0.98). The slope of the plot gives the value Qe and from intercept k2 can be calculated. The values of Qe and k2 were determined to be 15.17 mg/g and 2.93×10⁻³ g/mg min, respectively. It is clear from the nature of fit and correlation coefficients that adsorption of MO dye on WB is represented well by both first order and pseudo second order kinetic models. This suggests that the sorption of MO dye onto WB surface is presumably a chemisorption process involving exchange or sharing of electrons mainly between dye anions and surface functional groups of the WB [27].Pseudo second order kinetics was observed earlier by Ho and MacKay for adsorption of dyes BB69 and AB25 on peat (k2 = 5.79×10⁻³ g/mg min and 1.84×10⁻³ g/mg min, respectively) [26] and on wood (k2 = 3.43×10⁻³ g/mg min and 3.21×10⁻³ g/mg min, respectively) [ 26]. Due to different nature of the adsorbent used in the present work from those described above. A direct comparison of the values of k2 is not possible, but the values may be described to be in the same order.
Conclusions
In this study, the ability of WB to bind MO dye was investigated. The results indicates thar the adsorption capacity of WB was considerably affected by its surface functional groups and surface charge as well as by pH and temperature of medium. strong pH-dependence of MO adsorption onto WB together with FTIR results indicate to possible involvement of physical forces such as hydrogen bonding, Vander Waals and covalent chemical bonds in the adsorption process. Adsorbed amount of MO dye decreases with increasing pH but when temperature increased adsorption capacity is increased within study range, this indicates that the adsorption process is endothermic. The kinetics of MO adsorption onto WB followed pseudo – first and second -order rate expressions. It can be concluded that the WB is an efficient adsorbent for the removal of MO dye from aqueous solution.
References
- K.V. Radha, I. Regupathi, A. Arunagiri,T. Murugesan, 2005, Discoloration studies of synthetic dyes using phanero cheat chrysosporium and their Kinetics, process Biochemist( 40,3337-3345
- E.K. Raymound, F. Donald, 1984, Encyclopedia of Chemical Technology, Wiley New York.
- F. Cicek, D. Ozer , Ahmet Ozer, Ayla Ozer, lowcostoval of reactie dyes using wheat bran . Jour . of haze .Hat . 146(2007) 408-416 .
- G. Crini, Non – conventional low – cost adsorbent for dye removal : a review, Bioresour Techno 97(9) (2006) 1061-1085.
- T. Robinson, G. McMullen, R. March ant, P.Nigam, Remediation of dyes in textile dye effluents: a critical review on current testament Technologies with a proposed a alternative, Biores. Techno. 77(2001) 247-255.
- I.M. Banat, P. Nigam, D. Singh , R . Merchant, Microbial decolonization of textile–dye containing effluents: a review. Bioresour. Techno. 58 (1996) 217- 227.
- M. A. Farajzadeh, A. B. Mouji, Adsorption Characteristics of wheat bran toward heavy metal cautious, Sep. Purify. Techno.38 (2004)197-207.
- Y. Bulut, Z. Baysal, Removal of Pb(II) from wastewater using wheat bran, J. Environ. Manag., 78(2006) 107-113.
- G. Mishra, M. Tripathy, A critical review of the treatment for decolonization of textile effluent. colourage. 40(1993) 35 -38.
- O. Hamdaoui, M. Chiha, Removal of methylene blue from aqueous solutions by wheat bran, Acta. Chem. Slov. 54 (2007) 407-4018.
- A. Ozer, G.Dursun, Removal of methylene blue from aqueous solution by dehydrated wheat bran carbon, J. Hazard. Mater. 146 (2007) 262-269.
- M. Kocukosmanoglu, O,Gezici. A. Ayer, The adsorptionn behaviors of methylene blue and methyl orange in a diaminoethane sporopllenin- mediated column system Sep. purify. Techno. 52(2006)280-287.
- K.T. Chung, S.E. Stevens Jr., C.E. Cerniglia, The reduction of azo dyes by the intestinal microflora, Crit. Rev. Microbiol. 18(1992) 175-190.
- W. Stum, J.J. Morgan, Aquatic Chemistry, Wiley, New York, 1974.
- D.L.Spark, Environmental Soil Chemistry, Academic Press, San Diego, CA, 1995.
- A. Ramesh, D.J. Lee, J.W.C. Wong, Thermodynamic parameters for adsorption equilibrium of heavy metals and dyes from wastewater with low. cost adsorbents, J. Colloid Interface Sci., 291 (2005) 588-592.
- C. Weng, Y. Pan, Adsorption characteristics of methylene blue from aqueous solution by sludge ash , Colloid Surface Physicochem. Eng. Aspect, 274 (1-3) 2006 154-162.
- R.W. Couglin, F.S. Ezra, Role of surface acidity in the adsorption of organic pollutants on the surface of carbon, Environ. Sci. Technol. 2(1968) 291-297.
- M.S.Onyango, Y.Kojima, O.Aoyi, E.C.Bernardo, H.Mustafa, Adsorption equilibrium modeling and solution chemistry dependence of fluoride removal from water by trivalent cation-exchange zeolite F9, J. Colloid. Interface Sci.279:340-350
- Y.Bulut, H.Aydin, A kinetic and thermodynamic study of methylene blue adsorption on wheat shells, Desalination, (194) 2006 259-267.
- Y. Iida, T. Kozuka, T. Tuziuti, K. Yasui, Sonochemically enhanced adsorption and degradation of methyl orange with activated aluminas, Ultrasonics 42 (2004) 635-639.
- Y.S. Al-Degs, M.A. Khraisheh, S. Allen, M.N. Ahmed, Adsorption of Remazol Reactive Black B n different types of activated carbon: adsorption on H and L carbon, Adv. Eng. Res. 3(2) (1999) 132-138.
- P.K. Malik, Use of activated carbons prepared from sawdust and rice-husk for adsorption of acid dyes: a case study of Acid Yellow 36, Dyes and Pigments 56 (2003) 239-249.
- M. Dogan, M. Alkan, A. Turkyilmaz, Y. Ozedmir, Kinetics and mechanism of methylene blue by adsorption onto perlite, J. Hazard. Mater. B109 (2009) 141-148.
- M. Dogan, M. Alkan, Adsorption kinetics of methyl violet onto perlite, Chemosphere 50 (2003) 517-528.
- G. McKay, Y.S. Ho, The sorption of lead(II) on peat, Water Res. 33 (1999) 578-584.
- Y.S. Ho, G. McKay, Sorption of dye from aqueous solution by peat, Chem. Eng. J. 70 (1998) 115-124.
- M.C. Ncibi, B. Mahjoub, M. Seffen, Kinetic and equilibrium studies of methylene blue biosorption by Posidinia oceanica (L) fibers, J. Hazard. Mater. B139 (2007) 280-285.


![]()


