A Comparison between Ion chromatography and Inductively Coupled Plasma for the Determination of Bromate in Certain Samples of Foodstuffs
Alanowd O. Mehder*
College of Applied Medical Sciences, Umm Al-Qura University, Makkah, Saudi Arabia dr.alanowd.m@gmail.com
DOI : http://dx.doi.org/10.13005/ojc/310253
Article Received on :
Article Accepted on :
Article Published : 27 May 2015
Ion chromatography (IC) and inductively coupled plasma (ICP-MS) both were applied for the determination of bromate in some food samples. Attempts were made to establish calibration curves, however in case of IC, an additional abnormal peak was found to overlap with the bromate peak. This renders IC to be unsuccessful in the determination of bromate compared to ICP-MS technique. ICP-MS was found to give accurate results; therefore, it was applied for the determination of bromate in different samples of food stuffs.
KEYWORDS:Bromate;Ion chromatography; ICP-MS; Foodstuffs
Download this article as:| Copy the following to cite this article: Mehder A. O. A Comparison between Ion chromatography and Inductively Coupled Plasma for the Determination of Bromate in Certain Samples of Foodstuffs. Orient J Chem 2015;31(2). |
| Copy the following to cite this URL: Mehder A. O. A Comparison between Ion chromatography and Inductively Coupled Plasma for the Determination of Bromate in Certain Samples of Foodstuffs. Orient J Chem 2015;31(2). Available from: http://www.orientjchem.org/?p=8834 |
Introduction
Bromate ion (BrO3–) is formed as a by-product during the ozonation of drinking waters containing bromide. Bromate was classified as a “Group 2B” which was considered as a possible human carcinogen by the International Agency of Research on Cancer (IARC, 1999).
Bromate concentration was regulated in drinking water and the maximum contaminant level (MCL) was set at a level of 10 µg/L by the United States Environmental Protection Agency (as recorded by USEPA 2001 at the EPA/635/R-01/002 acts) and the WHO (World Health Organization(2006).However, the USEPA has considered a concentration of 0.05 µg/l of bromate to be responsible for a ratio of 1 in 1,000,000 cancer risk.In 2008, California Office of Environmental Health Hazard Assessment has set a level of 0.1 µg/Lbromate to be responsible for cancer risk. In Europe, an amount of 10 μg/L of bromate was proposed (WHO 2006) as MCL. The US Environmental Protection Agency (USEPA 2014) and the WHO have set a provisional guideline value of 25 μg/L(WHO 1996) and recommends an amount of 0.01 mg/l as a provisional guideline value of bromate in drinking water (European Union, 1980).
Potassium bromate is considered as a nephrotoxic and carcinogenic substance. As a result, the US Food and Drug Agency (FDA) has defined the value of 0.02μg/g (0.02 mg/kg) to be the maximum concentration of potassium bromate allowed in bread.Bromate has also been classified by the International Agency for Research on Cancer (IARC) as a possible human carcinogen. This was attributed to the mutagenic in experimental animals (IARC 1986). The main symptoms of the acute phase of bromate poisoning are vomiting, diarrhea and abdominal pain. Features of chronic toxicity of KBrO3, include hypertension, depression of the central nervous system and thrombocytopenia (Kurokawaet al., 1986).
Bromate in the form of KBrO3 or NaBrO3 is a colorless, odorless and tasteless white crystals that are commonly used in food industry. For instance, bromate salts are added by bakeries as an improver to increase the volume and the texture of the bread (Joint FAO/WHO 1992). While, it acts as a maturing agent and dough conditioner by oxidizing the sulfhydryl groups of the gluten protein in flour into disulphidebridges making it less extensible and more elastic; this makes the dough viscoelastic as a result of retaining the CO2 produced by the yeast. The overall effect is to make bread rise in the oven, increase loaf volume and texture (Nakamura et al., 2006).
Toxicological studies have shown that bromate consumption can also lead to non-cancer effects, such as degrading vitamins A1, A2, B1, B2, E and niacin which are the main vitamins available in bread (FAO/WHO JECFA, Joint Expert Committee on Food Additives 1992 and Hayashi et al., 1992). As a result,significant differences in the essential fatty acid content of the flour treated with bromate have been observed. This will in turn lead to the development of symptoms like cough, sore throat, abdominalpain, diarrhea, nausea and vomiting. In addition, if bromate is in haled, other health problems such as kidney failure, hearing impairment, bronchial and ocular problems, haemolysis,extreme irritation and injury to tissues especially those of the central nervous system and kidneys have been reported (Atkins 1993 and Robert and William 1996). Additionally, other studies(Kurokawaet al., 1986, Kurokawaet al., 1987, CSPI 1999 and Watson 2000)have indicated that potassium bromate has the potential to cause cancer in both experimental animals and humans by inducing oxidative stress in tissues (Hayashi et al., 1992,Mark 1988, Watanabeet al., 1992, Parsons and Chipman 1998, Chipmanet al., 2006 and Campbell 2006).
According to USEPA, bromate could be determined by various methods likeion chromatography using the conductivity detector. However, in presence of chloride, this method suffers from serious limitations because the chloride peak will overlap with the bromate peak. A Dionex AG 10 column has been used to preconcentrate the bromate, however,it has been noted that in presence of sulphateanion affinity problem has occurred (Joyce and Dhillon, 1994). Gordon and Bubins(1995) have developed a flow injection analysis method for the determination of bromate.
Heitkemperet al.(1994) have combined IC with ICP-MS for the determination of bromate in bread. Several analytical methods have been applied for the determination of bromate (Delcomynet al., 2001, Pisarenkoet al., 2010, Garcia-Villanovaet al., 2010, Himata et al., 1997 and Akiyama 2002).
This work was primarily initiated to make a comparison between IC and ICP-MS techniques in determining the concentration of bromate in certain samples of foodstuffs taken from the local market in Saudi Arabia.
Experimental
Chemicals used in this work were of analytical reagent grade and were used as received. Potassium bromate salt was obtained from Sigma-Aldrich Company. All of the stock solutions were prepared in doubly distilled deionized water and were immediately used. Standard solutions of different concentrations of bromate were prepared from the stock solution by dilution using the doubly distilled deionized water. The stock solutions were kept in dark area.
Food Samples
Specified food samples which are listed in Table (1)were selected from the most popular producers or distributers in the local market of Saudi Arabia. The exported food samples were of the trade mark of international companies.The local samples were of different bakery product groups, e.g., different forms of local bread (white burger bun, white bread, brown bread,thins brown bread, thins white bread, bread rolls, sandwich rolls, brown sliced bread, sliced bread and brown burger bun) and shaboura (crisp bread, corn thins and rise thins), imported gluten free bread (breakfast rolls,brown loaf and white loaf), breakfast cereals (cereal balls, chocolate balls and chocolate petals), snacks and biscuits (snacks, milk biscuit and coconut biscuit), macaroni, gluten free confectionery, bread and cake improver.
An exact weight of each sample was taken, dissolved in water, filtered and collected in a volumetric flask in order to determine the concentration of bromate in each of those samples that are listed in Table (1).
Table1: The tested food samples for estimating the NaBrO3 amounts
| Product Type | Product Name |
| Local bread | White burger bun |
| White bread | |
| Brown bread | |
| Thins brown bread | |
| Thins white bread | |
| Bread rolls | |
| Sandwich rolls | |
| Brown sliced bread | |
| Sliced bread | |
| Brown burger bun | |
| Shaboura (local bakery product) | Crisp bread |
| Corn thins | |
| Rise thins | |
| Gluten free bread (imported) | Breakfast rolls |
| Brown loaf | |
| White loaf | |
| Breakfast cereals | Rice flicks |
| Cereal balls | |
| Chocolate balls | |
| Chocolate petals | |
| Snacks and biscuits | Snacks |
| Milk biscuit | |
| Coconut biscuit | |
| Macaroni | Spaghetti |
| Gluten free confectionery | Marshmallows |
| Bread improver | Bread mix |
| Cake improver | Cake mix |
Instrumentation
For ICP-MS measurment, a blank and the following standard solutions of 10 ppb, 50 ppb, 100 ppb, 200 ppb and 500 ppb of bromate were prepared from the stock solution.
In case of IC method a blank and six standard solutions of 20 ppb,50 ppb, 200 ppb, 500 ppb, 1000 ppb and 5000 ppb of bromate were prepared. To each of these, an ali quot volume of sodium chloride (50 ppb), potassium iodide (50ppb) and sodium fluoride (50ppb)solutions was added. Each of these solutions was diluted up to the mark with doubly distilled deionized water.
Analysis of bromate was performed according to Heitkemperet al., (1994) and the specification condition were as follows:
ICP-MS ( XSERIES 2ICP-MS) was applied to determine bromate using the following operation conditions.
The RF Generator type was Solid state, 2.0 MHz and the frequency was 27.12 MHz.The RF generator power was 1550 W, the reduced extraction was-115 V, the auxiliary gas flowrate was 0.7 L/min, th
e nebulizer gas flowrate was 0.9 L/min, the cool gas flowrate was 12L/min, the hexapole bias was-09 V, the quadruple bias was -11 V, the sample uptake rate was 0.4 mL/min, helium of 99.999 % purity was used as a carrier gas at a flow rate of 5.5 ml/min.
Ion chromatograph, ICmodel Dionex ICS-1100 was applied using the following operating conditions: the eluent was 35 mM KOH, the flow rate was 0.25 mL/min, the detector was suppressed conductivity, the suppressor was dionex anion self-regenerating suppressor (Dionex ASRSTM 2mm) auto suppression recycle mode, the applied current was 13 mA and the injection volume was 25µL.
For sample preparation for bromate determination by ICP-MS and IC instruments, the following procedure was followed: An amount of 5.0 g of each of the tested sample was grinded, transferred into a 50 ml volumetric flask. A volume of 50 mL of deionized water was added slowly and the mixture was shaken up to 30 min. The mixture was left for 1 hour, decanted and filtered with whatman filter paper (40). The filtrate was taken into a 50 mL volumetric flask and the deionized water was added up to the mark. For ICP-MS analysis the tested sample was diluted up to 20 times with 2% HNO3 Solution (0.5 ml was made up to 10ml) before startup the ICP-MS analysis.
In case of IC analysis the tested sample was diluted five time (1ml was made up to 5ml by deionized water).All the prepared samples were filtered through 0.2µm filter just before the startup of the IC analysis.
Results and Discussion
The levels of bromate in food stuffs that are generally consumed in KSA need to be investigated. It is important to shed more light on such levels in order to examine their safety for human consumption. ICP-MS and IC techniques are generally used for the determination of bromate in drinking water as well as in foodstuffs.At the beginning of this work, calibration curves for bromate were established using both ICP- MS and IC methods.
The concentrations of bromate in each of the prepared standard solutions was determined by ICP-MS and IC. To examine the effectiveness of these instruments, the concentration of bromate in each standard was checked by ICP-MS as well as by IC techniques. Table (2) shows the concentrations of bromate in each of those standard solutions examined. Figures 1 and 2 show the calibration curves obtained for the IC and ICP-MS methods, respectively.
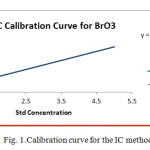 |
Figure1: Calibration curve for the IC method. Click here to View figure |
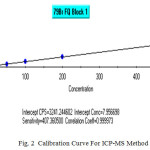 |
Figure2: Calibration Curve For ICP-MS Method Click here to View figure |
Table2: The concentrations of bromate (mg/L) in the prepared standard solutions by ICP-MS and IC instruments.
|
BrO3– (ppb) in the standard solutions |
|||||
|
ICP-MS instrument |
IC instrument |
||||
|
Prepared |
Determined |
Prepared |
Determined |
||
|
0 |
0 |
0 |
0.000 |
||
|
10 |
12 |
20 |
1 |
||
|
50 |
47 |
50 |
34 |
||
|
100 |
100 |
200 |
191 |
||
|
200 |
200 |
500 |
489 |
||
|
500 |
500 |
1000 |
988 |
||
|
5000 |
5004 |
||||
|
The statistical parameters |
|||||
|
Parameters |
Values for the |
||||
|
ICP-MS instrument |
IC instrument |
||||
| Correlation coefficient (R2) |
0.99997 |
1.00000 |
|||
| Intercept concentration (ppb) |
7.956698 |
– 0.0148 |
|||
It is obvious that in case of ICP-MS,there is a minor variation between the concentrations of the prepared standard solutions and their respective values when they were determined. However, in case of IC technique there is significant variations between the concentrations of the prepared standard solutions and their respective determined values. This variation is quite obvious in solutions of lower bromate concentrations, 20 and 50 ppb. The correlation coefficient (R2) seemed to be equal in the two methods, whereas the intercept concentration (ppb) was completely varied in case of ICP-MS than that found in IC instrument. The percentage change between the concentrations of the prepared and the determined were also calculated and depicted in Table (3).
Table3: The percentage change between the concentrations of the bromate in the prepared standards and their respective valued when determined by ICP-MS and IC.
| % changes between concentrations of the standards solution and their respective values when determined | |||
|
ICP-MS instrument in the |
IC instrument in the |
||
|
Prepared |
% change |
Prepared |
% change |
| 0 | 0 | 0 | 0 |
| 10 | 20 | 20 | -95 |
| 50 | -6 | 50 | -32 |
| 100 | 0 | 200 | -4.5 |
| 200 | 0 | 500 | -2.2 |
| 500 | 0 | 1000 | -1.2 |
| 5000 | 0.08 | ||
This observation also confirms the sensitivity of the ICP-MS in determining the concentration of bromate compared to IC technique.
In order to determine the bromate concentration in the foodstuffs depicted in Table (1), ICP-MS was adopted because of its sensitivity compared to that of IC method. Table (4) shows the concentrations of bromate in the foodstuff samples chosen.
Table4: The concentrations of bromate in ppb in the foodstuffs chosen.
| Bakery product groups | Product Name | Bromate ion in (ppb) |
| Local bread | White burger bun |
410 |
| White bread |
255 |
|
| Brown bread |
280 |
|
| Thins brown bread |
307 |
|
| Thins white bread |
293 |
|
| Bread rolls |
193 |
|
| Sandwich rolls |
229 |
|
| Brown sliced bread |
230 |
|
| Sliced bread |
370 |
|
| Brown burger bun |
256 |
|
| Shaboura (local bakery product) | Crisp bread |
343 |
| Corn thins |
150 |
|
| Rise thins |
228 |
|
| Gluten free bread (imported) | Breakfast rolls |
341 |
| Brown loaf |
365 |
|
| White loaf |
322 |
|
| Breakfast cereals | Rice flicks |
181 |
| Cereal balls |
187 |
|
| Chocolate balls |
222 |
|
| Chocolate petals |
178 |
|
| Snacks and biscuits | Snacks |
442 |
| Milk biscuit |
457 |
|
| Coconut biscuit |
283 |
|
| Macaroni | Spaghetti |
265 |
| Gluten free confectionery | Marshmallows |
199 |
| Bread improver | Bread mix |
449 |
| Cake improver | Cake mix |
226 |
The data presented in Table (4) shows that the bromate levels in some of the studied foodstuffs have the range of 150 ppb to 457 ppb. The highest amount of bromate was detected in milk biscuit, bread mix, snacks and white burger bun samples which have 457 ppb, 449 ppb, 442 ppb and 410 ppb, respectively. On contrary, the lowest amounts were found in the corn thins, chocolate petals, rice flicks and cereal balls which have 150ppb, 178 ppb, 181 ppb and 187 ppb, respectively. This table also shows that most of the bread samples, either locally manufactured or imported, have the high bromates level, particularly in, milk biscuit, bread mix, snacks and white burger bun samples.
By considering the allowable bromate amounts in the foodstuffs, the FDA and China both permit the use of potassium bromate up to a maximum level in bread of50 mg/kg of flour mass. However, Japan permits its inclusion only up to 10 mg/kg of flour (Kurokawaet al., 1990). In California a warning label is required when bromated flour is used and currently, itis recognized that it is inappropriate to use potassium bromate in any product or production method which cannot be formulated without residues below the level of 20 ppb(i.e. 0.020 mg/kg or 0.020 g/g) in the finished product. Joint FAO/WHO (1992) committee’s initial recommendation of acceptable level of 0–60 mg KBrO3/kg flour was with drawn because of long term toxicity and carcinogenicity studies in vitro and in vivo revealed renal cell tumors in hamsters.
Conclusion
This study reveals that many well-known provisionally food stuffs that have tolerable weekly intake of bromate amounts can be considered out of the recommended regulations. Consequently, there is a need to place a close surveillance on producers or importers of bread or other bakery products in order to ensure better compliance with the bromate health regulations. The utilization of ICP-MS instrument in determining bromate amounts is more accurate than the utilization of IC technique.
References
- Akiyama, T.;Yamanaka, M.;Date, Y.;Kubota, H.;Hamano-Nagaoka, M.;Kawasaki, Y.; Yamazaki, T.;Yomota, C.;Maitani, T.. J. Food Hyg. Soc. Jpn. 2002, 43,348.
- Atkins, D.P.MAFF-UK Foods Urveillance Information sheets.1993.
- Campbell, K.C.M.Toxicology. 2006, 221, 205–211.
- Chipman, J.K.;Parsons, J.L.; Beddowes, E.J.Toxicology.2006, 221, 187–189.
- CSPI,Centre for Science in the Public Interest 1999. Potassium BromateTermed a Cancer Threat, vol. 18, Snack Food and Whole sale Bakery,Washington, DC.
- Delcomyn, C.A.;Weinberg, H.S.; Singer, P.C. J. Chromatogr. A.2001, 920, 213.
- European Union 1980. Council directive of 15 July 1980 relating to the quality of water intended for human consumption.OfficialJ.Eur. Communities, 23(L229), 11.
- FAO/WHO JECFA, Joint Expert Committee on Food Additives 1992. Evaluation of certain food additives and contaminants, Geneva, pp.25–33.
- Garcia-Villanova, R.J.;Leite, M.V.O.D.;Hierro, J.M.H.;Alfageme, S.D.C.;Hernandez,C.G.Sci.Total Environ.2010, 408,2616.
- Gordon, G.; Bubins,O. B. Sci. Eng.1995, 17, 551.
- Heitkember, D. T.;Kaine, L. A.; Jackson, D. S.; Wolnik,K.A.J Chromatography, A. 1994, 671, 101.
- Himata, K.;Noda, M.;Ando, S.; Yamada, Y. Food Addit.Contam.1997,14,809.
- IARC, International Agency for Research on Cancer,1999 Monographs on the Evaluation of Carcinogenic Risks to Humans, Some Chemicals that Cause Tumors of the Kidney or Urinary Bladder in Rodents and Some Other Substances.Summary of Data Reported and Evaluation,Potassium Bromate (Group 2B), vol. 73: 481.
- IARC, International Agency for Research on Cancer.Potassium bromate. IARC Monograph Evaluating Carcinogenic Risk to Humans, 1986, 40, 207-220
- Joint FAO/WHO,.Expert Committee on Food Additives.Evaluation of certain food additives and contaminants. Geneva, World Health Organization, 1992, 25-30
- Joyce, R. J.; Dhillon, H.S. J. Chromatography A.1994, 671,165.
- Kurokawa, Y.; Aoki, S.; Matsushima, Y. J. Natl. Cancer Inst. 1986, 77,977-982.
- Kurokawa, Y.;Maekawa, A.;Takahashi, M.; Hayashi, Y.HealthPerspect.1990, 87: 309-335.
- Kurokawa, Y.;Takayama, S.; Konishi, Y. Health Prospect. 1987, 69, 221-236.
- Mark, J.E. Anim. Biol.1988, 45, 567-660.
- Nakamura, M.;Murakami, T.; Himata, K.; Hosoya, S.; Yamada, Y. Cereal Foods World.2006, 51,69-75.
- Parsons, J.L.; Chipman, J.K.;Toxicology.1998, 126, 93-102.
- Pisarenko, A.N.;Stanford, B.D.;Quinones, O.;Pacey, G.E.;Gordon, G.;Snyder,S.A. Anal. Chim.Acta.2010, 659, 216.
- Robert, I.A.;William, B.C. Biol. Educ.1996, 34, 1140-120.
- Sai, K.; Hayashi, M.;Takagi, A.;Hasegawa, R.;Sofuni, T.; Kurokawa, Y.Mutat. Res. 1992, 269, 113-118.
- SAS,Statistical Analysis System 1987.Release 6.03.SAS Institute.Inc. Carry, NC, USA.
- U.S, Environmental Protection Agency 1999.Drinking Water Treatment. EPA Document No. 810-F-99-013, Cincinnati, OH, USA.
- U.S, Environmental Protection Agency 1997.Method 300.1: The Determination of Inorganic Anions in Drinking Water by Ion Chromatography, U.S. Environmental Protection Agency, Cincinnati, OH, 1997.
- USEPA,United States Environmental Protection Agency 2014. National primary drinking water standards. http:// www.epa.gov/safe water/contaminants/index.html#listmcl.
- USEPA, United States Environmental Protection Agency 2001.HealthEffects Notebook for Hazardous Air Pollutants, Technology TransferNetwork: Air Toxics. http://www.epa.gov/ttn/atw/hlthef/hapindex.html.
- Watanabe, T.;Abe, T.;Satoh, M.;Oda, Y.;Takada, T.; Yanagihara, T. Int. Off. J. Jpn. Pae-diatr. Soc. 1992, 34 (6), 601-605.
- Watson, Y. Mallinckrodt Baker Inc., New Jersey, 2000.
- WHO,World Health Organization. Zinc in Drinking Water, Background Document for Development of WHO Guidelines for Drinking Water Quality, WHO, Geneva, , 2003; 5.
- WHO,World Health Organization 1996.Guidelines from Drinking Water Quality. 2nd ed.; Chemical Aspects: Geneva, Vol. 2.
- WHO, World Health Organization 2006.Guidelines for drinking-water quality: incorporating first addendum. Vol. 1, Recommendations, 3rd ed.; WHO Press: Geneva.

This work is licensed under a Creative Commons Attribution 4.0 International License.
![]()
A New Edition of Web of Science
Journal Impact Factor
2022: 0.5
Five Year: 0.8
Journal is Indexed in

Cabells Whitelist
![]()


