Simultaneous Estimation of Minoxidil and Aminexil in Bulk and Pharmaceutical Formulations by Rp-Hplc Method
Iffath Rizwana1, K. Vanitha Prakash2*, G. Krishna Mohan3
1R and D, Jawaharlal Nehru Technological University Kakinada, Kakinada, A. P. India. and Dept. of Pharmaceutical Analysis, Deccan School of Pharmacy, Hyderabad, A. P. India. 2Department of Pharmaceutical Analysis, SSJ College of Pharmacy, Gandipet, Hyderabad, A.P. India. 3Centre for Pharmaceutical Sciences, IST, JNTU Hyderabad, A.P. India.
DOI : http://dx.doi.org/10.13005/ojc/310131
Article Received on :
Article Accepted on :
Article Published : 12 Mar 2015
A new, simple, precise, accurate and reproducible RP-HPLC method for simultaneous estimation of minoxidil and aminexil in bulk and pharmaceutical formulations. Separation of minoxidil and aminexil was successfully achieved on a Agilent C18 (150 mm x 4.6 mm x 5µ Make: Waters) or equivalent in an isocratic mode utilizing 0.1% orthophosphoric acid and methanol in the ratio of 60:40 v/v at a flowrate of 1 ml/min. The developed method was found to be linear in the concentration range of 50µg/ml to 150 µg/ml for minoxidil and 50 µg/ml to 150 µg/ml for aminexil. The value of the correlation coefficient was found to be 0.999 for both minoxidil and aminexil. The LOD and LOQ for aminexil were found to be 0.0146 and 0.0486 mg/ml, respectively, where as for minoxidil the values are 0.046 mg/ml and 0.155 mg/ml, respectively. This method was found to be good percentage recovery for minoxidil and aminexil were found to be 99.00 and 100.00, respectively indicates that the proposed method is sufficiently accurate. The specificity of the method shows good correlation between retention times of standard with the sample. Therefore, the method specifically determines the analyte in the sample without interference from excipients that are commonly present in the pharmaceutical dosage forms. The method was validated according to ICH guidelines for linearity, range, accuracy, precesion, specificity and robustness.
KEYWORDS:RP-HPLC; Minoxidil; Aminexil
Download this article as:| Copy the following to cite this article: Rizwana I, Prakash K. V, Mohan G. K. Simultaneous Estimation of Minoxidil and Aminexil in Bulk and Pharmaceutical Formulations by Rp-Hplc Method. Orient J Chem 2015;31(1). |
| Copy the following to cite this URL: Rizwana I, Prakash K. V, Mohan G. K. Simultaneous Estimation of Minoxidil and Aminexil in Bulk and Pharmaceutical Formulations by Rp-Hplc Method. Orient J Chem 2015;31(1). Available from: http://www.orientjchem.org/?p=7630 |
Introduction
Minoxidil
Minoxidil, chemically known as 6-Piperidin-1-ylpyrimidine-2,4-diamine 3-oxide (Figure 1), is a potent direct-acting peripheral vasodilator that reduces peripheral resistance and produces a fall in blood pressure1. Minoxidil is widely used for the treatment of hair loss. It has been proven clinically effective in both the prevention of loss and in establishing varying degrees of hair re-growth in males and females suffering pattern baldness. Minoxidil must be used indefinitely for continued support of existing hair follicles and the maintenance of any experienced hair re
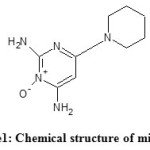 |
Figure1: Chemical structure of minoxidil
|
The minoxidil is official in US pharmacopeia, which describes a liquid chromatographic method for its quantification4. In the literature different methods have been proposed for its determination in pharmaceutical formulations and biological samples, which include high-performance liquid chromatography with UV detection5,6, electrochemical detection7,8, GC9, and radioimmunoassay10.
Aminexil
Aminexil is the trade name for kopexil. Kopexil, chemically known as 2,4 diamino pyridine 3 oxide (Figure 2) is an altered form of minoxidil without the side effects. It is a genuine anti-hair-loss innovation that fights against the stiffening of roots. In both men and women hair loss is connected to the deterioration of the roots. Kopexil increases the volume of hair in the growth stage by working on the deep structure of the roots. It rejuvenates the hair roots so that healthy hair growth can persist. Fibrosis condition of the hair roots causes blood vessels to compress and shorten the life span of the hair follicle. This problem can be corrected by kopexil11.
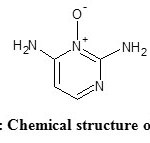 |
Figure2: Chemical structure of aminexil
|
The detailed literature survey has indicated that there is no report on the simultaneous determination of minoxidil and aminexil by HPLC with UV detection. Therefore, in the present investigation a simple, sensitive, precise and accurate HPLC method for the simultaneous determination of minoxidil and aminexil was developed and validated.
Experimental
Instrumentation
The chromatographic separation was carried out on a HPLC system with Waters 2695 alliance equipped with binary HPLC pump, Waters 2998 PDA detector and Waters Empower 2 software.
Pure form of drugs and solvents
- Minoxidil and Aminexil was obtained as a gift sample from Lara drugs Pvt Ltd., Hyderabad.
- Ortho phosphoric acid of analytical grade was obtained from Sd Fine Chemicals Ltd., Mumbai.
- HPLC grade methanol was purchased from Merck (India) Ltd., Mumbai.
Preparation of mobile phase
The mobile phase was prepared by mixing 0.1% orthophosphoric acid and methanol in the ratio of 60:40 v/v. The mobile phase was also used as diluent.
HPLC Conditions
Agilent C18, (150 mm × 4.6 mm; 5µm) analytical column was used for separation of minoxidil and aminexil. The chromatographs were recorded using Empower 2 software. The mobile phase was pumped at a flow rate of 1 ml/min. It was filtered through 0.45 μm filter and degassed before use. The elution was monitored at 223 nm and the injection volume was 10 μL. The oven temperature was 30°C. the run time was 6 minutes.
Table1: System suitability parameters
|
Parameters |
Minoxidil |
Aminexil |
|
Correlation Coefficient |
0.999 |
0.999 |
|
Regression Equation |
y =43363x |
y = 44600x |
|
LOD |
0.046 |
0.0146 |
|
LOQ |
0.155 |
0.0486 |
|
Theoretical plates |
4055 |
6908 |
|
Tailing |
1.17 |
1.12 |
Preparation of standard solution
Accurately weighed quantity, 2.5 mg of minoxidil and 0.75 mg of aminexil was transferred into 200 ml of volumetric flask and add 20 ml of diluent and sonicate for 15 min. Make up the volume with mobile phase.
Specificity
Specificity is the ability to assess unequivocally the analyte in the presence of components which may be expected to be present (Figures 3 and 4). Typically these might include impurities, degradants, matrix, etc.
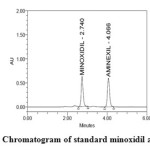 |
Figure3: Chromatogram of standard minoxidil and aminexil Click here to View figure |
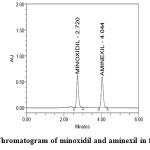 |
Figure4: Chromatogram of minoxidil and aminexil in formulation
|
Accuracy and precision
The accuracy of the method was determined by recovery experiments. The recovery studies were carried out in triplicate and the percentage recovery and standard deviation of were calculated. From the data obtained, added recoveries of standard drugs were found to be accurate (Table 2 & 3). The precision of the method was demonstrated by inter-day and intra-day variation studies. In the intraday studies, six repeated injections of standard and sample solutions were made and the response factor of drug peaks and percentage RSD were calculated. In the inter-day variation studies, six repeated injections of standard and sample solutions were made for three consecutive days and response factor of drugs peaks and percentage RSD were calculated. The chromatograms of three different levels shown in Figures 5, 6 & 7. From the data obtained, the developed RP-HPLC method was found to be precise (Table 4).
Table 2: Accuracy for minoxidil
|
Spiked Level |
Sample Weight |
Sample Area |
µg/ml Added |
µg/ml Found |
% Recovery |
Mean |
|
50%
|
25 |
2071238 |
6.188 |
6.15 |
99 |
98 |
|
25 |
2025682 |
6.188 |
6.02 |
97 |
||
|
25 |
2034012 |
6.188 |
6.04 |
98 |
||
|
100%
|
50 |
4117610 |
12.375 |
12.23 |
99 |
100 |
|
50 |
4128874 |
12.375 |
12.26 |
99 |
||
|
50 |
4193216 |
12.375 |
12.45 |
101 |
||
|
150%
|
75 |
6266170 |
18.563 |
18.61 |
100 |
100 |
|
75 |
6267048 |
18.563 |
18.61 |
100 |
||
|
75 |
6260495 |
18.563 |
18.59 |
100 |
Table 3: Accuracy for aminexil
|
Spiked level |
Sample weight |
Sample area |
µg/ml Added |
µg/ml Found |
% Recovery |
Mean |
|
50%
|
25 |
2210444 |
1.875 |
1.86 |
99 |
100 |
|
25 |
2214963 |
1.875 |
1.87 |
100 |
||
|
25 |
2231841 |
1.875 |
1.88 |
100 |
||
|
100%
|
50 |
4438236 |
3.750 |
3.74 |
100 |
100 |
|
50 |
4478563 |
3.750 |
3.77 |
101 |
||
|
50 |
4486034 |
3.750 |
3.78 |
101 |
||
|
150%
|
75 |
6650104 |
5.625 |
5.60 |
100 |
100 |
|
75 |
6685719 |
5.625 |
5.63 |
100 |
||
|
75 |
6647304 |
5.625 |
5.60 |
100 |
Table 4: Precision Studies
| SampleNo. | Sample Wt (mg) | Area(Aminexil) | Area(minoxidil) | %Assay(Aminexil) | %Assay(minoxidil) |
| 1 | 50 |
4151071 |
4426383 |
99 | 99 |
| 2 | 50 |
4193859 |
4457056 |
100 | 100 |
| 3 | 50 |
4138023 |
4481933 |
98 | 101 |
| 4 | 50 |
4105298 |
4452708 |
98 | 100 |
| 5 | 50 |
4137563 |
4413639 |
98 | 99 |
| 6 | 50 |
4190028 |
4463492 |
100 | 100 |
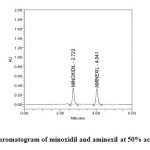 |
Figure5: Chromatogram of minoxidil and aminexil at 50% accuracy level Click here to View figure |
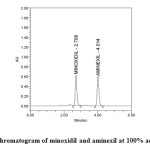 |
Figure6: Chromatogram of minoxidil and aminexil at 100% accuracy level
|
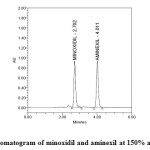 |
Figure7: Chromatogram of minoxidil and aminexil at 150% accuracy level
|
Linearity range
The linearity of the method was determined at five concentration levels. The calibration curve was constructed by plotting peak areaμ against concentration of drugs. The slope and intercept value for calibration curve was y = 44363 x (R2=0.999) for minoxidil and y = 44600 x (R2=0.999) for aminexil. The results shows that an excellent correlation exists between the peak areas and concentration of drugs within the concentration range indicated above. The linearity curves for minoxidil and aminexil are shown in Figures 8 and 9.
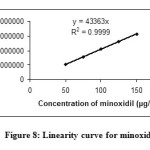 |
Figure8: Linearity curve for minoxidil |
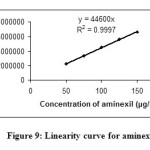 |
Figure9: Linearity curve for aminexil
|
Robustness
Robustness of the method was determined by making slight changes in the chromatographic conditions. It was observed that there were no marked changes in the chromatograms (figures 10 and 11), which demonstrated that the developed RP HPLC method was robust ( Table 5 & 6 ).
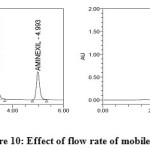 |
Figure10: Effect of flow rate of mobile phase
|
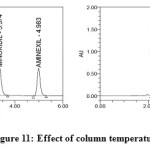 |
Figure11: Effect of column temperature |
Table 5: Robustness for minoxidil
|
Parameter |
Inj |
RT |
Area |
USP Tailing |
USP Plate count |
| TEMP-1 | 1 | 3.380 | 5073841 |
1.24 |
4106 |
| TEMP-2 | 1 | 2.253 | 3336814 |
1.15 |
3852 |
| FLOW-1 | 1 | 3.374 | 5058205 |
1.26 |
4196 |
| FLOW-2 | 1 | 2.250 | 3337216 |
1.16 |
3777 |
Table 6: Robustness for aminexil
|
Parameter |
Inj |
RT |
Area |
USP Tailing |
USP Plate count |
|
TEMP-1 |
1 |
4.993 |
5466989 |
1.17 |
7347 |
|
TEMP-2 |
1 |
3.339 |
3635579 |
1.12 |
6282 |
|
FLOW-1 |
1 |
4.983 |
5444818 |
1.17 |
7493 |
|
FLOW-2 |
1 |
3.340 |
3639412 |
1.12 |
6467 |
Limits of quantification and detection (LOD and LOQ)
Limit of quantification and detection were predicted by plotting linearity curve for different nominal concentrations of aminexil and minoxidil. Relative standard deviation (σ) method was applied, the LOQ and LOD values were predicted using following formulas (a) and (b). Precision was established at these predicted levels.
(a) LOQ = 10 σ / S
(b) LOD = 3.3 σ / S
Where σ = residual standard deviation of response; s = slope of the calibration curve.
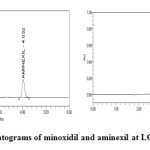 |
Figure11: Chromatograms of minoxidil and aminexil at LOD and LOQ levels Click here to View figure |
Table 7: LOD and LOQ of minoxidiland aminexil
| S.No. | Sample type | inj | Name of sample | RT | Area |
| 1 | LOD | 1 | Minoxidil | 2.728 | 3.590351 |
| 2 | LOQ | 1 | Minoxidil | 2.717 | 10.58319 |
| 1 | LOD | 1 | Aminexil | 4.032 | 3.469054 |
| 2 | LOQ | 1 | Aminexil | 4.013 | 9.682998 |
Results and Discussion
System suitability results were given in Table 1 and system suitability parameters are retention time, resolution, tailing and plate count were shown uniformity and %RSD was less than 1. Therefore the proposed method is suitable for analysis with good precision. The method specificity was confirmed by Figures 3 and 4. Those figures are minoxidil and aminexil standard chromatogram and other one is formulation they were not observed placebo and excipients peaks interference with standard and analytic peak so it proves that the method is selective. The result given in Table 4 indicates that the method precision passed for both minoxidil and aminexil studies. The method accuracy was evaluated by recovery studies. Minoxidil and aminexil recovery was found to be 99% & 100% as per ICH (97% – 103%) and very low percentage RSD shown that the method is accurate the results are shown in Tables 2 and 3. Linearity calibration curve was given in Figures 8 and 9. The graph was plotted by taking five different concentrations versus peak areas to construct the linear regression equation and to calculate the value of correlation coefficient. Linear correlation was found to be Y= 44363 for minoxidil and y = 44600 for Aaminexil. Method robustness results were given in Tables 5 & 6. LOQ and LOD results were given in Table 7. The proposed HPLC method was found to be simple, precise, accurate and sensitive for the simultaneous estimation of minoxidil and aminexil in pharmaceutical dosage forms.
Conclusion
The proposed HPLC method can easily and conveniently adopted for routine quality control analysis of minoxidil and aminexil in pure and its pharmaceutical dosage forms.
Acknowledgement
Author was thank full to department of pharmaceutical chemistry to Deccan School Of Pharmacy, JNTUH for providing instruments and analytical support.
References
- Sica, D.A. J. Clin. Hypertens (Greenwich). 2004, 6, 283-287.
- Olsen, E.A.; Dunlap, F.E.; Funicella, T.; Koperski, J.A.; Swinehart, J.M.; Tschen, E. H.; Trancik, R.J. J. Am. Acad. Dermatol, 2002, 47, 377–385.
- Price, V.H.; Menefee, E.; Strauss, P.C. J. Am. Acad. Dermatol. 1999, 41, 717–721.
- The United StatesPharmacopeia, United States Pharmacopeia Convention, USP 23ed., Rockville Pais. 1995.
- Asmus, O.; Landis, J.B.; Grant, M.E.; Havel, H.A. J. Pharm. Sci., 1984, 73, 1290-1293.
- Zarghi, A.; Shafaati, A.; Foroutan, S.M.; Khoddam, A. J. Pharm. Biomed. Anal., 2004, 36, 377-379.
- Carrum, G..; Abernethy, D.R.; Sadhukhan, M.; Wrigt, C.E. J. Chromatogr., B: Biomed Sci. Appl., 1986, 381, 127-133.
- Golden, M.H.; Zoutendam, P.H. J. Pharm. Biomed. Anal., 1987, 5, 543-546.
- Kamiewaska, T.; Kublin, E.; Weclawowicz, E.; Kwiatkowska, B. Pharm. Pol., 1987, 43, 508-511.
- Royer, M.E.; Cao, H.; Gillberson, T.J.; MacCall, J.M.; Jonston, K.T.; Stryd, R. J. Pharm. Sci. 1977, 66, 1266-1269.
- Trüeb, R.M.; de Viragh, P.A. Praxis. 2001, 90, 241-248.

This work is licensed under a Creative Commons Attribution 4.0 International License.
![]()
A New Edition of Web of Science
Journal Impact Factor
2022: 0.5
Five Year: 0.8
Journal is Indexed in

Cabells Whitelist
![]()


