Thermodynamic and kinetic study of the intrinsic adsorption capacity of graphene oxide for malachite green removal from aqueous solution
DOI : http://dx.doi.org/10.13005/ojc/300403
Download this article as:
![]()
Graphene oxide (GO) was produced from bare graphite (BGP) material and was used as anintrinsic adsorbent for the removal of malachite green (MG) from aqueous solution. In an optimization study, the effects of the initial concentration of MG, solution pH, adsorbent dosage, contact time and ionic strength were investigated in detail. The water-soluble dye was analyzed at a maximum wavelength of 618 nm. The optimum conditions for MG removal from aqueous solution included a 300 mg/L initial concentration with 0.02 mg adsorbent at pH 5.1, and complete adsorption equilibrium was reached within 40 min. The maximum adsorption capacity of GO for MG was 384.62 mg/g, dramatically higher (over 10 times) than that of BGP (28.73 mg/g).The adsorption process followed pseudo-second-order kinetics. Thermodynamic data demonstrated that dye adsorption onto the GO surface was mainly an exothermic spontaneous reaction. The remarkably different adsorption isotherms for GO and BGP fit well with the Langmuir and Freundlich models, respectively. It is therefore evident that the prepared GO can be used as a highly effective adsorbent for this toxic dye.
KEYWORDS:Thermodynamic; kinetic study; graphene oxide
Introduction
Currently, many industries, including paper production, textiles, leather tanning, plastics, hair coloring and food technology, use synthetic dyes to color their final products. Malachite green (MG) is one of the most commonly used dyes for cotton, leather, silk, paper and printing in ks1, and it can also be used as an anti-parasitic and antifungal agent in aquariums2. However, malachite green and its major metabolite, leucomalachite green, both have mutagenic, carcinogenic, genotoxic and teratogenic effects3 4.Whenever environmental contamination occurs, they bio-accumulate in aquatic life such as fish, crab, shrimp, mollusks and other animals5-6 and cause detrimental effects in liver, gall, kidney, intestine, gonad and pituitary gonadotrophic cells. 7Ultimately, human beings in the affected food chain risk becoming sick. Therefore, it is necessary to remove these dye contaminants from wastewater before release into the environment to protect both the environment and humans.
There are several techniques for the removal of malachite green from wastewater, such as photocatalysis8-10, nanofibermembrane11,precipitation12,electrocoagulation, flotation, chemical oxidation, filtration, ozonation13, microbial degradation, ion exchange, and adsorption14-19. Among those techniques, adsorption is the most promising process for the removal of dyes from wastewater. This method relies on interactions between adsorbent and adsorbate.Thus,a key factor in the adsorption process is the selective adsorbent with its intrinsic functional groups. Several adsorbents that have been studied for removal of malachite green include eggshells2, clay3, rice husk, bentonite, zeolite,sawdust,rice straw,oil palm trunk fiber, degreased coffee beans,treated ginger waste,hen feathers,chitin hydrogel, chitosan beads, silica gel,acid-activated sintering process red mud, water-soluble melamine/maleic anhydride sorbent20-33,activated carbon and other carbon-based materials34-40.However, because these adsorbents are low in either efficiency or adsorption capacity,new adsorbents have recently been developed that possess high capacity, larger specific surface area and high selectivity.
Recently, graphene oxide (GO) was demonstrated to be a candidate carbon-based adsorbent due to having of non-specific functional groups (carbonyl, hydroxyl and epoxide) on its surface, providing anchor sites for both dye and metal ion complexation41-44.The abundance of functional groups on its surface gives GO adsorption capability for dyes such as methylene blue,congo red,sulfamethoxazole, ciprofloxacin, acridine orange,methyl orange,methyl violet, rhodamine B and orange G45-51.However, the removal of malachite green from aqueous solution by using graphene oxide has not yet been reported in the literature.
In this study,GO was chemically produced from graphitic material and used to remove malachite green from aqueous solution. In a batch adsorption study, the potential of GO for use as an adsorbent in malachite green removal was assessed via comparison with bare graphite.Both Langmuir and Freundlich isotherms, adsorption kinetics and thermodynamic parameters were investigated in detail to determine the adsorption capacity for malachite green removal from aqueous solution.
Materials and Methods
Sodium nitrate (NaNO3), sulfuric acid (H2SO4, 98%), hydrogen peroxide (H2O2, 30%), and ethanol (C2H5OH) were purchased from Ajax Fine Chem Pty Ltd. Potassium permanganate (KMnO4), synthetic graphite powder (< 20 µm)and malachite green oxalate ([C23H25N2).(C2HO4)]2.C2H2O4) were received and used without further purification.Each of their working solutions was prepared by diluting standard stock solutions from Carlo Erba and Sigma-Aldrich. All chemicals used were reagent grade.Malachite green in the supernatant solution was determined using an ultra-violet and visible spectrophotometer (Agilent 8453, Germany) at a wavelength of 618 nm.
Preparation of Graphene Oxide
Graphene oxide was prepared from graphite powder by using conditions optimized in our previous work52 with the modified Hummers’method53. Briefly, 3.0 g of graphite powder was added to cold (0oC) 300 mL of 98% H2SO4 and stirred for 30 min. Then, 3.0 g of NaNO3 was added portion-wise to the mixture and stirred a further 30 min. Subsequently, solid powder of KMnO4 (4.5%, w/v) was added to the mixture, which was always kept below 10˚C in an ice bath. After stirring for 30 min, 200 mL of deionized water was then slowly added to the mixture and stirred again for 30 min. After that, it was heated to 80˚C for 6 h and 40 mL of 30% H2O2 was slowly added. The mixture solution was centrifuged and washed several times with deionized water until the pH of the filtrate reached neutral. Thelyophilized precipitates were subsequently obtained.
Determination of Phpzc
pH at the point of zero charge (pHpzc) for the GO adsorbent in a solid to solution ratio of 1:250 was determined bythe batch equilibration technique54. Sodium chloride solution (0.1 mol/LNaCl) was used as an inert electrolyte. Initial pH values (pHinitial) of the NaCl solutions were adjusted from 1 to 12 by addition of 0.1mol/LHCl or NaOH. GO adsorbent (0.1 g) was added into 25 mL of 0.1 mol/LNaCl solution. The suspension mixture (1:250) was allowed to equilibrate for 24 h in a shaker maintained at room temperature (30˚C). Then, the suspension solution was filtered and the pH values (pHfinal) were measured once.
Adsorption Experiments
For batch adsorption of malachite green, the adsorbent(0.02 g) was accurately weighed into a 125 mL conical flask. Then, 25 mL of the dye solution (300 mg/L)was added, the pH of the solution was adjusted and it was shaken by an orbital shaker at approximately 200 rpm at ambient temperature (30˚C). For optimum batch adsorption conditions, various experimental parameters were studied including pH range (2-8),initial concentration of dye, temperature and contact time.After a period of shaking, the adsorbent was separated from the solution by centrifugation for 5 min and the supernatant solution was determined spectrophotometrically.
All experiments were conducted in triplicate under the same conditions. The adsorption capacity (qe,mg/g)of the dye at an equilibrium state was determined as follows:
Where Co is the initial concentration (mg/L) of the dye in solution,Ce is the dye concentration(mg/L) at the equilibrium state, V is the volume (L)of the solution, and mis the mass (g) of the adsorbent.Langmuir and Freundlich adsorption models were used to describe the equilibrium nature of dye adsorption onto the GO and compare it with a BGP adsorbent.
Results and Discussion
Characterization of Graphene Oxide
Figure1clearly demonstrates thepHpzc of the obtained graphene oxide. The plateau corresponds to a plot of final pH value of the suspension(pHfinal) against the initial value (pHinitial) to give the pHpzc value. The presence of the plateau indicates that the material exhibits amphoteric properties and acts as a buffer in this range. The plateau of pHinitialminus pHfinal corresponds to the pH range where the buffering capacity of the GO occurs, i.e., where for all pH values, in this range the pHfinal is almost the same and corresponds to pHpzc. It is evident that the GO possesses a buffering effect over a wide pH range, from 4 to 9. Thus, for all values of pHinitial, pHfinal is the same and equal to pHpzc. One may notice that at pH 3 GO tends to act as a buffer, but the buffering effect is incomplete and the pHfinal values remain under the plateau. The pHpzc of GO was observed to be pH 4.1. Similar observations were reported for2- or 3-layered and few-layered graphene oxide with pHpzcs of 4.1 and 3.8, respectively55.Its pHpzc suggests that the surface of GO should be predominantly positive at pH values lower than 4.1 and negative at pH values higher than 4.1. The surface charge density of the material should decrease the pH of the solution approaches pHpzc and increase as it deviates from pHpzc.
 |
Fig1: Plot of final solution pH (pHfinal) versus initial pH (pHinitial) for solid to solution ratio 1:250. Time of equilibration 24 h. Background electrolyte 0.1 mol/L NaCl. Click here to View figure |
Adsorption of Malachite Green Dye
Effect of Initial Concentration
The effect of the initial concentration of malachite green (MG)is a very important parameter for adsorption studies because it can overcome all MG mass transfer restrictions between the aqueous and solid phases. Figure 2 shows plots of the equilibrium adsorption capacity of GO and the percentage removal of MG versus the initial concentration of MG. It is evident that the equilibrium adsorption capacity increases with increasing initial dye concentration, indicating that a higher initial concentration of MG can enhance the adsorption process, although the percentage removal of MG decreases with an increase in the initial concentration. The maximum adsorption capacity of the GO adsorbent at MG concentration of 300 mg/Lis 233.40 mg/g. The increasing uptake capacity of the adsorbent with increasing MG concentration may be due to higher collision probability between MG ions and adsorbent particles. Moreover, variation in the extent of adsorption may also be because at the initial stage all active sites of the adsorbent surface are vacant and the dye concentration gradient is relatively high. Similar trends have been reported in the literature for the removal of MG using other adsorbents such as Araucaria cookiiBark7,sawdust23,rice husk activated carbon35 and clayey soil56.
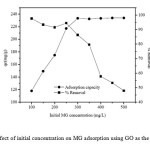 |
Fig2: Effect of initial concentration on MG adsorption using GO as the adsorbent.
|
Effect of pH
The pH of an aqueous solution is generally said to be a very critical parameter affecting the adsorption process due to the functional groups of both the adsorbed molecules and the adsorbent particles. Hydrogen ions (H+) in the solution are directly involved in the adsorption process at the active sites of the adsorbent. The influence of initial pH on adsorption efficiency was evaluated in terms of adsorption capacity.
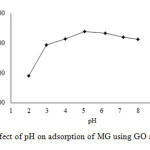 |
Fig3: Effect of pH on adsorption of MG using GO as adsorbent. |
Figure 3 shows the MG adsorption capacity over the pH range of 2-8. It was observed that the adsorption of MG increases with increasing solution pH. At pH 2, the extent of MG adsorption was 190.53 mg/g. The adsorption capacity increased from pH 2 to 5, reached its maximum value at pH5.1, and then declined as the pHof the solution increased further. The maximum adsorption capacity of GO (338.22 mg/g) occurred at pH 5.1. As reported previously, the pHpzc of GO was 4.1. At lower solution pH, the adsorption capacity of GO is lower due to the competition between H+ and MG ions anchored at the adsorption sites. In addition, in an acidic solution, the adsorbent surface becomes positively charge and does not favor the uptake of MG ions. On the other hand, at higher pH values, the surface of the adsorbent becomes negatively charged and favors the up take of the dye. However, the adsorption capacity of GO decreased from pH 5 to 8, which may be due to the ionization constant (pK= 6.90) of the dye making it 100% ionized at pH 4, 50% at pH 6.9, 25% at 7.4 and 0% at pH 10.14.In this study, pH 5.1 was chosen as the optimal experiment condition because this pH could accommodate both the activity of the functional groups on the GO surface (negatively charged) and also strong chemical ionization of MG (positively charged). A similar trend was observed for the biosorption of MG on Araucaria cookiiBark7.
Effect of Adsorbent Dosage
Because an adsorbent dosage assessment can provide information about an effective adsorbent to use and the ability of MG to be adsorbed with a minimum dosage, it is beneficial from an economical point of view. The effect of the adsorbent dosage on dye adsorption by GO is shown in Fig. 4.Percentage (%) MG adsorption was plotted as a function of the adsorbent dosage in the range of 0.02-0.2 g. It is clear that the adsorption percentage of the GO sorbent increases with the an increase of the adsorbent dosage. This is because the increasing dosage leads to an increase in the number of active sites available in the adsorbent, resulting in an increased amount of adsorbed MG ions.On the other hand, it was found that the adsorption capacity is high at low dosages and decreases at higher dosages. This may be attributable to the decrease in total adsorption surface area available to MG resulted from an overlapping or an aggregation of the adsorption sites1. In this study, 0.02 g of GO was chosen due its highest adsorption capacity.
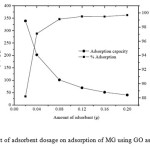 |
Fig4: Effect of adsorbent dosage on adsorption of MG using GO as adsorbent. Click here to View figure |
Effect of Contact Time
The effect of contact time on the adsorption capacity of GO for malachite green(300 mg/L) was evaluated. Fig. 5clearly shows that the rate of adsorption increases at the initial period of contact time and decreases gradually with time until the adsorption reaches an equilibrium condition. The equilibrium state was established within 40 min. At the initial stage (first 30 min), the MG adsorption rate may be explained by an increased availability in the number of active sites on the surface of the GO adsorbent. The adsorption of MG on to the adsorbent drastically increases and is normally controlled by the diffusion process from the bulk solution to the surface of the adsorbent. In the final stage, the adsorption of MG is likely an attachment controlled process due to fewer available sorption sites. Therefore, further studies were conducted using 40 min as a suitable contact time for dye adsorption.
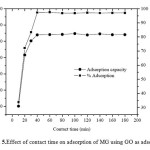 |
Fig5: Effect of contact time on adsorption of MG using GO as adsorbent Click here to View figure |
Effect of Ionic Strength
The effect of ionic strength on the adsorption capacity of grapheme oxide (0.02 mg) for malachite green(300 mg/L)at 303 K for 40 min was assessed. From Fig. 6, it is evident that dye adsorption decreased with increasing NaCl concentration(0.001-0.100 mol/L) and remained constant with an excess amount of sodium salt (>0.500 mol/L)in the solution. A similar trend was found in MG adsorption using activated carbon obtained from tea leaves1.This result corresponds with the theoretical aspect that when the electrostatic forces between the adsorption surface and adsorbate ions are attractive, an increase in the ionic strength will decrease the adsorption capacity.
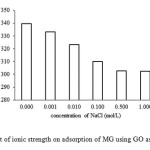 |
Fig6: Effect of ionic strength on adsorption of MG using GO as adsorbent. Click here to View figure |
Thermodynamic Study of Dye Adsorption
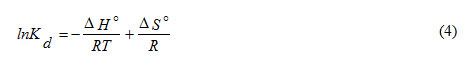
To study the effect of temperature on the adsorption of MG onto GO, the Gibbs free energy change (ΔGº), entropy change (ΔSº) and enthalpy change (ΔHº) were estimated by applying thermodynamic equations (2) to (4).
Where R is the gas constant (8.314 J/molK), T is absolute temperature in K and Kd is the equilibrium constant. The Kd was calculated by using the following equation
Where qe is amount of malachite green (mg) adsorbed per gram of GO at equilibrium, Ce is the equilibrium concentration (mg/L) of malachite green in solution and Kd is the distribution coefficient for sorption.
The values of ΔSº and ΔHº can be calculated from the slope and the intercept of the van’t Hoff plot of lnKd versus 1/T (Fig. 7).
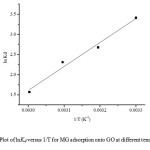 |
Fig7: Plot of lnKd versus 1/T for MG adsorption onto GO at different temperatures. Click here to View figure |
From Table 1, under the steady-state reaction condition, ΔGº is in the range from -26.00 to -23.47 kJ/mol and ΔHº and ΔSº are found to be-49.42 kJ/mol and -134.89 kJ/mol.K, respectively. The negative value of ΔGº for all temperatures indicates that the adsorption is a spontaneous process38.One can note that ΔGº values above -20 kJ/mol are an indicator of physisorption, while values more negative than -40kJ/mol indicate chemisorption. When ΔGº is in the range between -20 and -40kJ/mol, both physisorption and chemisorption occur1.In this study, the ΔGº values are in between -20 and -40kJ/mol, indicating that the sorption process can be explained by taking both physisorption and chemisorption into consideration. The negative value of DSº indicates a tendency to lower disorder at the solid-solution interface during adsorption57.In addition, the negative value of ΔHº indicates that dye adsorption using GO is exothermic nature. At high temperature the thickness of the boundary layer decreases due to the increased tendency of the dye molecules to escape from the adsorbent surface to the solution, which results in a decrease in the adsorption capacity as the temperature increases56.
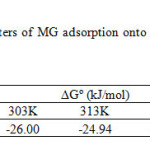 |
Table1: Thermodynamic parameters of MG adsorption onto GO at different temperatures in Kelvin. Click here to View table |
Kinetic study of Dye Adsorption
The nature of the adsorption process depends on either physical or chemical characteristics of the adsorbent. Three kinetic models including a first-order kinetic model, a pseudo-second-order kinetic model and an intra-particle diffusion kinetic model are used to examine the mechanism of the adsorption process.
The first order rate equation is one of the most widely used for the adsorption of solute from a solution, which is given in the following Eq. (5).
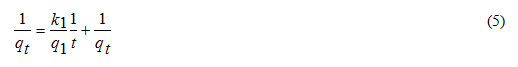
Where q1 and qt are the amounts of MG adsorbed onto adsorbent at equilibrium (mg/g) and at various times t, respectively, and k1 is the rate constant (min−1) of the first order model for the adsorption process. The values of k1 and q1 are calculated from the slope and intercept of the plot(Fig. 8) of 1/qt versus 1/t.
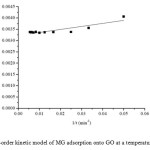 |
Fig8: First-order kinetic model of MG adsorption onto GO at a temperature of 303 K. Click here to View figure |
The pseudo-second order kinetic model is expressed by Eq.(6)
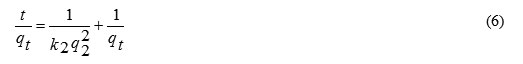
Where is q2 the maximum adsorption capacity (mg/g) for pseudo-second-order adsorption, qt is the amount of MG adsorbed at equilibrium (mg/g) at time t (min) and k2 is the rate constant of the pseudo-second-order adsorption (g/mg min). The values of k2 and q2 were calculated from the slope and intercept of the plot(Fig. 9) of t/qt versus t.
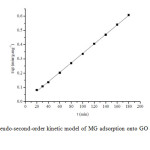 |
Fig9: The pseudo-second-order kinetic model of MG adsorption onto GO at a temperature of 303 K. Click here to View figure |
Because the first order and pseudo-second order kinetic models cannot be used to identify the diffusion mechanism, an intra-particle diffusion model was also used. The structure of the solid and its interaction with diffusion controls the rate of transport. Intra-particle diffusion is a transport process involving the movements of species from bulk solution to a solid phase. During well-stirred batch adsorption, the intra-particle diffusion model has been used to explain the adsorption mechanism occurring on a porous adsorbent. A plot of the amount of MG adsorbed at equilibration at time t and t1/2 provides the intra-particle diffusion rate constant (the slope of the plot). The intra-particle diffusion model is expressed by Eq.(7).
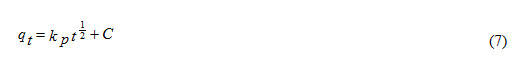
Where qt is the amount of MG adsorbed at equilibrium (mg/g) at time t, C is the intercept and kp is the intra-particle diffusion rate constant mg/(g min1/2). The values kp of and C were calculated from the slope and intercept of the plot of qt versus t1/2. The value of C is the intra-particle diffusion constant, which is directly proportional to the boundary layer thickness.
The kinetic parameters for the dye adsorption of GO at 303 K were calculated from Eqs. (5)-(7) as shown in Table 2. It was found that the q2 value of GO sorbent is 312.50 mg/g and the linear correlation coefficient (R2)is up to 0.9995. Moreover,the calculated (296.80 mg/g) and experimental ( qe, 312.50 mg/g) values are close to each other. Therefore, this dye adsorption fits well with the pseudo-second-order kinetic model.
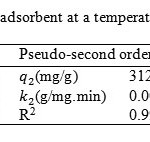 |
Table3: Kinetic parameters of GO adsorbent at a temperature of 303 K. Click here to View table |
Figure 10 shows the intra-particle diffusion for MG adsorption using GO. The adsorption process is defined asoccurring in three phases including an initial linear part, a second linear part and a third linear part. The first portion is the transport of MG molecules from the bulk solution to the GO surface by diffusion through the boundary layer. The second part is the diffusion of the dye molecules from the surface of the GO adsorbent into the pores. The last part is the final equilibrium stage, where dye molecules are adsorbed onto the active sites on the internal pore surfaces, and the intra-particle diffusion plot starts slowing down due to the solute concentration declining29.
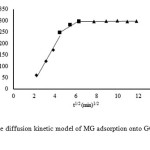 |
Fig10: Intra-particle diffusion kinetic model of MG adsorption onto GO at a temperature of 303 K. Click here to View figure |
The surface adsorption mechanism was predominant with in the 40 min contact time. Thereafter, diffusion became the rate-limiting step. The intra-particle diffusion rate constant kp(mg/g min1/2) was evaluated from the slope of the second linear part of the qt versus t1/2 plot. The intra-particle diffusion model is used to elucidate the rate-limiting step of the adsorption process. The intercept of the plot indicates the boundary layer effect. If the linear plot goes through the origin,the rate-limiting step is only due to intra-particle diffusion. On the other hand, the larger the intercept obtained, the greater the contribution of surface sorption to the rate-limiting step[59].The value of C was high for GO resulting in more surface adsorption of the dye on to GO. Therefore, both mechanisms, surface adsorption and intra-particle diffusion, simultaneously cooperate din the adsorption behavior of the GO adsorbent.
Adsorption Isotherm
The interaction between a liquid phase and an adsorbent is described by adsorption isotherms. These mathematical descriptions of equilibrium adsorption capacity in the adsorption process provide a reliable prediction of the adsorption parameters and a quantitative comparison of the adsorption behaviors of different adsorbent systems. The Langmuir and Freundlich models are the ones most frequently used to describe adsorption isotherms. The Langmuir model assumes that a monolayer of adsorbate covers a homogenous adsorbent surface. Adsorption takes place only at specific sites of the adsorbent, which is valid for monolayer sorption onto a surface, given by
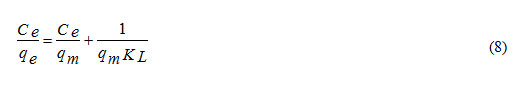
where qm is the maximum amount of dye absorbed per unit weight of adsorbent (mg/g) to form a complete monolayer covering the surface at the equilibrium state of dye concentration Ce (mg/L), qe is the amount of dye adsorbed per unit weight of adsorbent at equilibrium, and KL is the Langmuir constant (L/mg) related to the surface affinity for the dye. The value of qm represents a practical limiting adsorption capacity when the surface is fully covered with dye ions. The values of qm and KL are calculated from the slope and intercept of the straight line plot of Ce/qe versus Ce.
The Freundlich adsorption isotherm is an equation that describes a heterogeneous surface. The mathematical form of the Freundlich adsorption isotherm is represented by Eq. (9).
where, KF and n are the Freundlich constant and the intensity of adsorption, respectively. The values of KF and 1/n (between 0 and 1) can be obtained from a linear plot of log qe versus log Ce.
Figure 11and Fig. 12 show fitting plots of Langmuir adsorption and Freundlich adsorption of MG using GO and BGP, respectively. The constant values obtained from the Langmuir and Freundlich adsorption isotherms and their correlation coefficients (R2) were calculated and are summarized in Table 3.
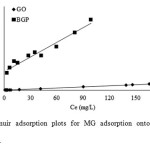 |
Fig11: The Langmuir adsorption plots for MG adsorption onto GO and BGP at a temperature of 303 K. Click here to View figure |
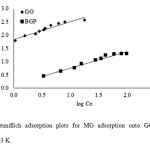 |
Fig12: The Freundlich adsorption plots for MG adsorption onto GO and BGP at a temperature of 303 K. Click here to View figure |
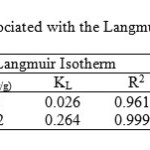 |
Table3: Results and parameters associated with the Langmuir and Freundlich models Click here to View table |
From the results, it can be concluded that for BGP adsorbent, the Freundlich isotherm (R2> 0.97) fits the experimental results comparably to the Langmuir isotherm (R2> 0.96). The slope 1/n provides information about surface heterogeneity and surface affinity for the solute. If a higher value of 1/n is obtained, it corresponds to greater heterogeneity of the adsorbent surface. Interestingly, for GO adsorbent, the Langmuir isotherm (R2> 0.99) fit the experimental results better than the Freundlich isotherm (R2> 0.93), indicating a homogenous adsorbent surface. The MG ions were occupying only specific sites of the GO adsorbent, which is valid for monolayer sorption onto a surface. The maximum adsorption capacities were found to be 28.73 and 384.62 mg/g for BGP and GO, respectively. For comparison, the maximum adsorption capacity for this dye using other adsorbents is presented in Table 4. It is evident that the GO material has a high adsorption capacity for MG removal from aqueous solution relative to the other carbon-based adsorbents.
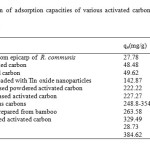 |
Table4: Comparison of adsorption capacities of various activated carbon and carbon-based adsorbents for MG Click here to View table |
Conclusion
Graphene oxide (GO) proved to be a highly effective adsorbent for malachite green (MG) removal from aqueous solution. Its pHpzc value was 4.1, suggesting that the surface of GO should be predominantly positive at pH values lower than 4.1 and negative at pH values higher than 4.1. The surface charge density should increase or decrease as the pH value deviates more or less from the pHpzc. The optimum conditions for removal of MG from aqueous solution were a 300 mg/L initial concentration of MG with 0.02 mg adsorbent at pH 5.1, and the adsorption state was completed with in 40 min. In addition, the adsorption capacity of GO decreased in the presence of higher ionic strength. This result corresponds to theoretical considerations defining that when the electrostatic forces between the adsorption surface and the adsorbateions are attractive, an increase in ionic strength will decrease the adsorption capacity. The maximum adsorption capacity of GO for MG was 384.62 mg/g, which is over 10 times higher than that of BGP (28.73 mg/g) according to their relevant functional groups.
The adsorption process of MG follows the pseudo-second-order kinetics model, indicating that the overall rate of MG uptake is controlled by external mass transfer at the initial stage of adsorption. In addition, the driving forces that control the adsorption rate later are attributable to intra-particle diffusion. Thermodynamic study of the adsorption process revealed that it was mainly an exothermic spontaneous reaction. The adsorption isotherms fit well with the Langmuir and Freundlich models for GO and BGP, respectively. Therefore, the present study provides an excellent adsorbent for dye removal from aqueous solution. This adsorbent can also potentially be used for wastewater treatment.
Acknowledgements
This research was financially supported by KhonKaen University, and the Ministry of Science and Technology, Bangkok, Thailand.
References
- Akar, E.; Altinişik, A.; Seki, Y. Ecol. Eng.2013,52,19-27.
- Podstawczyk, D.; Witek-Krowiak, A.; Chojnacka, K.; Sadowski, Z. Bioresour. Technol.2014, Http://Dx.Doi.Org/10.1016/J.Biortech.2014.01.015
- Arellano-Cárdenas, S.; López-Cortez, S.; Cornejo-Mazón, M.; Mares-Gutiérrez, J.C.Appl. Surf. Sci.2013, 280,74-78.
- Srivastava, S.; Sinha, R.; Roy, D. Aquat. Toxicol. 2004,66,319-329.
- Fallah, A.A.; Barani, A.Food Control. 2014, 40, 100-105.
- Sudova, E.; Machova, J.; Svobodova, Z.; Vesely, T. Veterinarnimedicina. 2007, 52, 527-539.
- Kalpana, P.; King, P. Asian J. Chem. 2014, 26, 75-81.
- Chen, C.X.; Hou, Y.C.; Li, B.; Yi, W.Z. Asian J. Chem.2013, 25,3167-3171.
- Cuiping, B.; Wensheng, X.; Dexin, F.; Mo, X.; Dong, G.; Zhongxue, G.; Yanshui, Z. Chem. Eng. J.2013, 215-216, 227-234.
- Kant, S.; Pathania, D.; Singh, P.; Dhiman, P.; Kumar, A. Appl. Catal. B 2014,147,340-352.
- Xu, R.; Jia, M.; Zhang, Y.; Li, F. Microporousmesoporous Mater. 2012,149,111-118.
- Lee, Y.C.; Kim, E.J.; Yang, J.W.; Shin, H.J. J. Hazard. Mater.2011, 192,62-70.
- Kusvuran, E.; Gulnaz, O.; Samil, A.; Yildirim, O. J. Hazard. Mater.2011, 186,133-143.
- Roosta, M.; Ghaedi, M.; Shokri, N.; Daneshfar, A.; Sahraei, R.; Asghari, A. Spectrochim. Acta, Part A. 2014, 118, 55-65.
- Zhang, G.; Yi, L.; Deng, H.; Sun, P. J. Environ. Sci.2014, 26, 1203-1211.
- Wang, L.; Zhang.J.; Zhao, R.; Li, C.; Li, Y.; Zhang, C. Desalination.2010, 254, 68-74.
- Zhang, J.; Li, Y.; Zhang, C.; Jing, Y.J. Hazard. Mater.2008, 150, 774-782.
- Hameed, B.H.; El-Khaiary, M.I. J. Hazard. Mater.2008, 159, 574-579.
- Guo, Y.; Zhang, H.;Tao, N.;Liu, Y.;Qi, J.;Wang, Z.; Xu, H. Mater. Chem. Phys. 2003,82,107-115.
- Rahman, I.A.;Saad, B.; Shaidan, S.; Sya Rizal, E.S.Bioresour.Technol.2005, 96,1578-1583.
- Bulut, E.; Özacar, M.;Ayhanşengil, I. Microporousmesoporous Mater.2008, 115,234-246.
- Han, R.;Wang, Y.;Sun, Q.;Wang, L.;Song, J.;He, X.;Dou, C. J. Hazard. Mater.2010,175,1056-1061.
- Gong, R.;Feng, M.;Zhoa, J.;Cai, W.;Liu, L.Bioresour. Technol. 2009, 100, 975-978.
- Gong, R.;Jin, Y.;Chen, F.;Chen, J.;Liu, Z.J. Hazard. Mater. B. 2006,137, 865-870.
- Hameed, B.H.;El-Khaiary, M.I. J. Hazard. Mater.2008, 154, 237-244.
- Hwa Beak, M.;Ijagbemi, C.O.;Jin, O.S.;Su Kim, D.; J. Hazard.Mater.2010, 176, 820-828.
- Ahmad, R.;Kumar, R.J. Environ. Manage.2010, 91, 1032-1038.
- Mittal, A.J. Hazard. Mater. B.2006, 133, 196-202.
- Tang, H.; Zhou, W.;Zhang, L. J. Hazard. Mater. 2012, 209-210, 218-225.
- Bekçi, Z.;Özveri, C.;Seki, Y.;Yurdakoç, K. J. Hazard. Mater.2005, 154, 254-261.
- Samiey, B.;Toosi, A.R.; J. Hazard. Mater. 2010, 184, 739-745.
- Zhang, L.; Zhang, H.;Guo, W.;Tian, Y. Appl. Clay Sci. 2014, 93-94, 85-93.
- Rong, X.; Qiu, F.; Qin, J.; Yan, J,;Zhao, H.; Yang, D. J. Ind. Eng. Chem. 2014, Http://Dx.Doi.Org/10.1016/J.Jiec.2013.12.083
- Shamsizadeh, A.; Ghaedi, M.;Ansari, A.;Azizian, S.;Purkait, M.K.J. Mol. Liq.2014, 195, 121-128.
- Sharma, Y.C. J. Chem. Eng. Data. 2011, 56, 478-484.
- Tian, Y.;Liu, P.; Wang, X.;Lin, H. Chem. Eng. J. 2011, 171, 1263-1269.
- Ahmad, M.A.;Alrozi, R. Chem. Eng. J. 2011, 171, 510-516.
- Nethaji, S.;Sivasamy, A.;Thennarasu, G.; Saravanan, S. J. Hazard. Mater. 2010, 181, 271-280.
- Santhi, T.;Manonmani, S.;Smitha, T. J. Hazard. Mater. 2010, 179, 178-186.
- Méndez, A.;Fernández, F.;Gascó, G. Desalination. 2007, 206, 147-153.
- Arriagada, D.C. J. Mol. Model. 2013, 19, 919-930.
- Li, Z.;Young, R.J.;Wang, R.;Yang, F.;Hao, L.;Jiao, W.;Liu, W. Polymer. 2013, 54, 5821-5829.
- Xue, Y.;Liu, Y.;Lu, F.;Qu, J.;Chen, H.;Dai, L. J. Phys. Chem. Lett. 2010, 3, 1607-1612.
- Madadrang, C.J.;Kim, H.Y.;Gao, G.;Wang, N.;Zhu, J.;Feng, H.;Gorring, M.;Kasner, M.L.;Hou, S. Acs Appl. Mater. Interfaces. 2012, 4, 1186-1193.
- Yan, H.; Tao, X.; Yang, Z.; Li, K.; Yang, H.; Li, A.;Cheng, R. J. Hazard. Mater.2014, 268, 191-198.
- Li, Y.;Du, Q.;Liu, T.;Peng, X.;Wang, J.;Sun, J.;Wang, Y.;Wu, S.;Wang, Z.;Xia, Y.;Xia, L. Chem. Eng. Res. Des. 2013, 91, 361-368.
- Debnath, S.;Maity, A.;Pillay, K. J. Environ. Chem. Eng. 2014, 2, 260-272.
- Chen, H.; Gao, B.; Li, H. J. Hazard. Mater. 2014, Http://Dx.Doi.Org/10.1016/ J. Jhazmat. 2014.03.063
- Sun, L.;Fugetsu, B. Chem. Eng. J. 2014, 240, 565-573.
- Yang, Z.; Ji, S.;Gao, W.; Zhang, C.; Ren, L.;Tjiu, W.W.; Zhang, Z.; Pan, J.;Liu, T. J. Colloid Interface Sci.2013, 408, 25-32.
- Ramesha, G.K.;Vijaya Kumara, A.;Muralidhara, H.B.;Sampath, S. J. Colloid Interface Sci. 2011, 361, 270-277.
- Nuengmatcha, P.;Mahachai, R.;Chanthai, S. Asian J. Chem.2014, 26 ,1321-1323.
- Hummers, W.S.;Offeman, R.E. J. Am. Chem. Soc. 1958, 80, 1339.
- Kongsri, S.;Janpradit, K.;Buapa, K.;Techawongstien, S.; Chanthai, S.Chem. Eng. J 2013, 215-216,522-532.
- Zhao, G.; Ren, X.; Gao, X.; Tan, X.; Li, J.; Chen, C.; Huang, Y.;Wang, X. Dalton Trans. 2011, 40, 10945-10952.
- Saha, P.;Chowdhury, S.;Gupta, S.;Kumar, I. Chem. Eng. J. 2010, 165, 874-882.
- Hadavifar, M.;Bahramifar, N.;Younesi, H.;Li, Q. Chem. Eng. J.2014, 237,217-228.
- Zhang, H.;Tang, Y.;Liu, X.;Ke, Z.;Su, X.;Cai, D.;Wang, X.;Liu, Y.;Huang, Q.;Yu, Z. Desalination. 2011,274 ,97-104.
- Vadivelan, V.;Kumar, K.V.J. Colloid Interface Sci.2005, 286, 90-100.


![]()


