The synthesis of Ag nanoparticles and loading it on activated carbon as a novel adsorbent for removing methyl orange by using surface response methodology
S. Javad Hosseini1, H. Aghaie1* and M. Ghaedi2*
1Chemistry Department, Tehran Science and Research Branch, Islamic Azad University, Tehran, Iran 2Chemistry Department, Yasouj University, Yasouj, Iran
DOI : http://dx.doi.org/10.13005/ojc/300449
Article Received on :
Article Accepted on :
Article Published : 29 Dec 2014
After synthesizing Ag nanoparticles and loading onto activated carbon (from olive stone), the adsorption of methyl orange (MO) onto the prepared nanoparticles was studied. In this connection, the effect of experimental parameters such as pH range, reagent concentration, contact time, dosage amount of adsorbent and so on, on the adsorption process were studied. The experimental results were analyzed upon various kinetic models such as pseudo first order reaction, pseudo second order reaction, Elovich model, intraparticle diffusion model and various adsorption isotherms such as Langmuir isotherm, Freundlich isotherm and Temkin isotherm.
KEYWORDS:Adsorption; Ag Nanoparticle; Isotherm; Activated carbon
Download this article as:| Copy the following to cite this article: Hosseini S. J, Aghaie H, Ghaedi M. The synthesis of Ag nanoparticles and loading it on activated carbon as a novel adsorbent for removing methyl orange by using surface response methodology. Orient J Chem 2014;30(4). |
| Copy the following to cite this URL: Hosseini S. J, Aghaie H, Ghaedi M. The synthesis of Ag nanoparticles and loading it on activated carbon as a novel adsorbent for removing methyl orange by using surface response methodology. Available from: http://www.orientjchem.org/?p=6243 |
Introduction
Anionic dyes may be toxic, carcinogenic and even mutagenic and generate serious hazards to aquatic living organisms and ecosystems1-7.Biodegradation is a difficult task and required great attention and emphasis potential. Many studies have been carried out on adsorption of organic anionic dyes by various adsorbents8,10. Of the dyes, the water-soluble reactive and acid dyes are the most problematic because of their tendency of passing through conventional treatment systems without affectability11-15.Recently removal of dyes through adsorption on activated carbon(AC) has been found to be very effective16 but fairly high cost limits its application17.
Methyl Orange (MO) as a water-soluble azo dye (well-known carcinogenic organic substance) widely is used in textile, printing, paper manufacturing, pharmaceutical and food industries but also in research laboratories as an acid base indicator due to its ability to function as a weak acid (Schem 1)18.
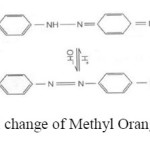 |
Scheme1: Chemical change of Methyl Orange structure by pH. Click here to View scheme |
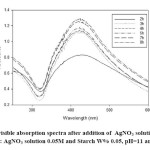 |
Fig1: Evolution of UV-visible absorption spectra after addition of AgNO3 solution into the soluble starch solution ; conditions: AgNO3 solution 0.05M and Starch W% 0.05, pH=11 and Temperature 60 . Click here to View figure |
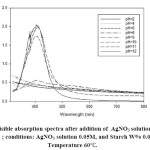 |
Fig2: Evolution of UV-visible absorption spectra after addition of AgNO3 solution into the soluble starch solution at various pHs ; conditions: AgNO3 solution 0.05M, and Starch W% 0.05, pH, 2 up to 12 and Temperature 60. Click here to View figure |
Microbial succession and intestinal enzyme activities in developing rats have also been studied about MO19, and it was found that this dye can increase nitro and azo reduce activities significantly, with the appearance of anaerobes in the large intestine. Always, this dye, entering the body through ingestion, metabolizing into aromatic amines by intestinal microorganisms. Reductive enzymes in the liver can also catalyze the reductive cleavage of the azo linkage to produce aromatic amines, and can even lead to intestinal cancer20,21. MO is a representative contaminate in industrial wastewater and shows poor biodegradability22. Various physical, chemical and biological methods including adsorption23-25, oxidation or ozonation26, 27, membrane separation28, biodegradation29, coagulation and flocculation30 are available for removing MO. Adsorption over a surface with highly ionic character is mostly effective and very fast for removing a dye with opposite ionic character31. Adsorption techniques have a good potential for removing organics from water due to their high efficiency and ability to separate a wide range of chemical compounds32-34. Metal nanoparticles (M-NPs) have a wide range of applications in science, technology, and medicine35. It is a well-known that silver ions and silver-based compounds are highly toxic to microorganisms which include 16 major species of bacteria36, 37. There are many ways reported in various literatures to synthesize silver nanoparticles49. These include physical, chemical, and biological methods.
The physical and chemical methods are numerous but some of these methods are expensive or use toxic substances which are major factors that make them „not so favored‟. An alternate, feasible method to synthesize silver nanoparticles is to employ biological methods by using microbes and plants38. In this work we used the green synthesis for producing the Ag nanoparticles, Ag-NPs, by using the soluble starch as reducing agent. The green synthesis of Ag NPs involves three main steps, which must be evaluated based on green chemistry perspectives, including: (1) selection of solvent medium, (2) selection of environmentally benign reducing agent, and (3) selection of nontoxic substances for the Ag-NPs stability39, 40.
The present work at first focuses on the effects of operating parameters which affect on Ag-NPs synthesis, such as pH, time of reaction, initial silver nitrate concentration and starch concentration and in the second step, on the analysis of effective parameters on the dye adsorption by Response Surface Methodology (RSM). Our purpose is: (i) to better understand the relationship between the affective factors and the response (the capacity of the adsorption); and(ii) to determine the optimum conditions for the next step of dye adsorption onto synthesized silver nanoparticles loaded on activated carbon (Ag-NPs-AC).
Experimental
Materials and methods
All chemicals including NaOH, HNO3, starch and other reagents, with the highest available purity were purchased from Merck, Darmstadt, Germany. MO was used as received without any further purification; while its color was stable under experimental conditions. A stock solution of MO was prepared by dissolving its required amount in distilled water and the working solutions with desired concentrations were prepared by successive dilutions of the stock solution. The concentration of the dye was determined at 412 nm using Jusco UV-Visible spectrophotometer model V-530, while the pH was adjusted and measured by pH/Ion meter model-686, metrohm.
Preparation of silver nanoparticles
The aqueous solutions of silver nitrate and starch were prepared in deionized water according to the experimental design (Table 1). In order to prepare Ag nanoparticles, a 400 μL adequate AgNO3 solution was added to 100 ml starch solution of desired concentration (Table 1) and then adjusting the pH mixture on the desired value by adding an adequate solution of NaOH or HNO3 to the prepared mixture (Table 1).
The mixture was magnetically stirred at a fixed speed. The mixture presented a pale yellow color after nearly one minute, indicating the initial step of Ag-nanoparticles formation.
The experiment was runed at various pHs, various silver nitrate concentrations, various starch concentrations and various times according to Table 1, in order to obtain the optimum conditions for synthesizing the Ag nanoparticles (Table 1).
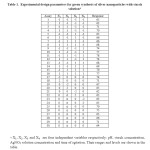 |
Table1: Experimental design parameters for green synthesis of silver nanoparticles with starch solution* Click here to View table |
To deal with the reaction time, we run the experiment and took the UV-visible spectra at various times respect to the initial time (Figs. 1and 2).
The formation of Ag nanoparticles was followed by the surface plasmon resonance (SPR) and as can be seen from the Fig. 1 the SPR band was increased with the reaction time.
The effect of solution pH on the Ag nanoparticles formation was studied and the results are shown in Fig. 2. The Ag nanoparticles formation at pHs lower than 9 was not favorable, but at a fairly higher pH was favorable. This may be due to the deprotonation of hydroxyl group of starch. Indeed, the charge transfers of hydroxyl group takes place easier in alkaline media.
The adsorption process
The adsorption of MO from aqueous solution onto Ag nanoparticles was performed in a static mode. Experiments were performed according to the first central composite design (CCD) matrix as expert design. In all stages, for investigating the influences of variables and evaluation of their interaction, 100 ml of MO solution with constant initial concentration and pH, was mixed with known adsorbent dose and stirred for different time at 400rpm. The mixture was agitated in an orbital shaker at room temperature at desired speed. Finally, mixture was separated by centrifugation at 4000 rpm for 10 min. The residual concentration was determined using Jusco UV-Visible spectrophotometer model V-530nm. The response (removal efficiency or removal percentage, ( )) of MO was calculated as:

where C0 and C0 are initial and residual concentration of MO respectively.
In all experiments and stages, the final concentration of MO was evaluated using calibration curve obtained at the same conditions. Removal percentage, Y%, for each run was calculated and optimum values of Silver nitrate concentration, starch solution concentration, pH and contact time were determined and reported in Table 3.
Results and discussion
Model equation
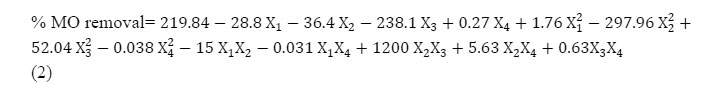
According to the four applied variable CCD experimental designs, 30 experiments including six replicates at the center point were performed to optimize the conditions and other points (according to Table 1). The obtained values of MO removal were entered in “Design Expert” software (as response) and quadratic model was selected to fit results for dye removal. A polynomial function respect to the pH (X1), starch concentration (X2), Silver nitrate concentration (X3) and reaction time (X4) for calculating the percentage of MO removal is presented in the eq. (2).
The three dimensional response surface plots of the quadratic model (eq. 2) were drawn to show the effect of the variables on the efficient of prepared nanoparticle on the dye removal.
Adsorption Kinetics
One of the essential requirements for the proper interpretation of the experimental data obtained during kinetic studies is to identify the step(s) governing overall rate of removal during the adsorption process41-43. The three flowering steps are thought to be involved during the adsorption of any organic or inorganic compounds over the surface of adsorbent:
a. Transport of adsorbate to the surface of the adsorbent, call film diffusion,.
b. Transport of the adsorbate within the pores of the adsorbent, call particle diffusion,.
c. Adsorption of adsorbate on the interior surface of the adsorbent.
The kinetics of adsorption process is an indicating factor controlling the efficiency of the process and the equilibrium time and showing the rate of adsorption uptake on Ag-NPs-AC(silver nanoparticles loaded on activated carbon)44. In order to identify the potential rate controlling steps involved in the process of adsorption, three kinetic models were used to fit the experimental data of the dye adsorption; including pseudo first- and pseudo second- order, Elovich kinetic as well as intraparticle diffusion models onto Ag-NPs-AC45.
The pseudo-first order
kinetic model (Fig. 9) can be represented by the following Lagergen rate equation46:
log (qe – qt) = log qe – (k1/ 2.303 t). (3)
where qe and qt are the amounts of adsorbed adsorbate (mg/g) onto the adsorbent at equilibrium and at contact time (t), respectively, and k1 is the pseudo- first-order rate constant (min-1). The values of qe and k1 can be evaluated from the intercept and slope of eq.(3). The experimental values of qe were not close to the calculated ones. It suggests that the kinetics of MO adsorption onto Ag-NPs-AC did not satisfactorily control by the pseudo first-order model and, hence, cannot be a diffusion controlled phenomenon.
The pseudo-second-order
kinetic model eq.(4) (Fig.10) was tested and showed a good agreement with the experimental data (table 4)

where k2 is the rate constant of pseudo-second-order adsorption (g/(mg min))
In addition, we examined Elovich equation (eq. 5 and Fig. 11) for representing our experimental data (see table 4)

where α is the initial adsorption rate (mg/(g min)), β and is the desorption constant related to the extend of surface coverage and activation energy for chemisorption (g/mg).
Finally, we pay attention to the intraparticle diffusion model (eq. 6)

where kid is the intraparticle diffusion rate constant (mg/g min1/2) and C is the intercept. If the mechanism of adsorption process follows the intraparticle diffusion, the plot of qt versus t1/2 should be a straight line and kid and C can be calculated from the slope and intercept of the plot (Fig.12). The values of C give an idea about the thickness of the boundary layer, i.e., the larger the intercept leads to the larger rate-controlling step47, 48.
In order to study the effect of other conditions such as initial concentration of dye or the amount of adsorbent dosage on dye removal, we selected two dosages (0.008g and 0.025g) of adsorbent and three various initial concentration of dye ( Experimental data reported in Table 4).
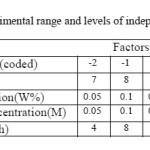 |
Table2: Experimental range and levels of independent variables Click here to View table |
Adsorption isotherms
The equilibrium data that commonly known as adsorption isotherms, describe how the adsorbate interacts with adsorbent, and give a comprehensive understanding of the nature of interaction. It is basically important to optimize the design of an adsorption system. The obtained parameters from the different models provide important information on the surface properties of the adsorbent and its affinity to the adsorbate. Several isotherm equations have been developed and employed for such an analysis, and the 3 important isotherms, the Langmuir (Figs. 13-16 and Table 5), Freundlich (Fig. 17) and Temkin (Fig. 18) isotherms were applied to fit experimental data (Table 6).
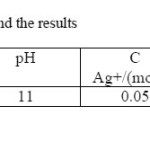 |
Table3: Process optimum conditions and the results Click here to View table |
Some important results
Indeed, this research consists of two parts; one, Ag nanoparticles synthesis, and the other, thermodynamic and kinetic interpretation of the adsorption process of MO adsorption onto the synthesized nanoparticles.
The Ag-NPs synthesis was carried out under the conditions of tables 1 and 2, and the obtained optimum conditions are reported in table 3. The Figs. 3-8 show the effect of various couples of parameters, such as AgNO3 concentration – pH couple, starch solution – pH couple and so on, on the efficiency of synthesized Ag-NPs-AC for the dye removal.
The results of kinetic and thermodynamic experiments are gathered in tables 4-6 and represented graphically in Figs. 9-18.
Fig. 3 shows the effect of AgNO3 concentration and pH on the efficiency of synthesized Ag-NPs-AC for the dye removal. Increasing the AgNO3 concentration at pH≥9, provided an increased in the dye removal percentage.
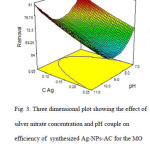 |
Fig3: Three dimensional plot showing the effect of silver nitrate concentration and pH couple on efficiency of synthesized Ag-NPs-AC for the MO removal Click here to View figure |
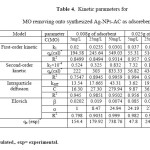 |
Table4: Kinetic parameters for MO removing onto synthesized Ag-NPs-AC as adsorebent Click here to View table |
Fig. 4 shows the effect of starch solution and solution pH couple on the efficiency of Ag-NPs-AC for the dye removal. The lower concentration of starch and higher pH lead to the better dye removal.
fig4
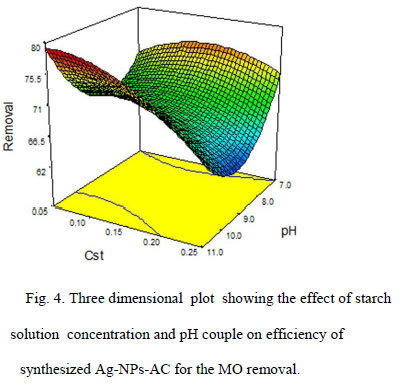 |
Fig4: Three dimensional plot showing the effect of starch solution concentration and pH couple on efficiency of synthesized Ag-NPs-AC for the MO removal. Click here to View figure |
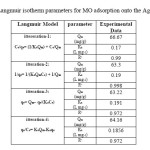 |
Table5: Langmuir isotherm parameters for MO adsorption onto the Ag-NPs-AC Click here to View table |
 
After Fig. 5, the lower concentration of the two considered solutions gives a better efficiency.
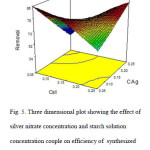 |
Fig5: Three dimensional plot showing the effect of silver nitrate concentration and starch solution concentration couple on efficiency of synthesized Ag-NPs-AC for the MO removal. Click here to View figure |
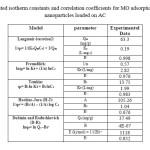 |
Table6: Calculated isotherm constants and correlation coefficients for MO adsorption onto the silver nanoparticles loaded on AC Click here to View table |
Fig. 6 is connected to the pair interaction of pH and time. With “higher pH-lower time” and “lower pH-higher time” the efficiency of Ag-NPs-AC for the dye removal is better.
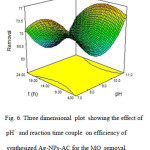 |
Fig6: Three dimensional plot showing the effect of pH and reaction time couple on efficiency of synthesized Ag-NPs-AC for the MO removal. Click here to View figure |
Addressing to Fig. 7, we see that the lower concentration of starch with a short time is better conditions for synthesizing Ag-NPs-AC for the dye removal. Fig. 8 shows that upon increasing in the AgNO3 concentration, the percentage of dye removal becomes more satisfactory.
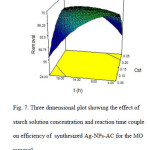 |
Fig7: Three dimensional plot showing the effect of starch solution concentration and reaction time coupleon efficiency of synthesized Ag-NPs-AC for the MO removal Click here to View figure |
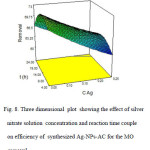 |
Fig8: Three dimensional plot showing the effect of silver nitrate solution concentration and reaction time couple on efficiency of synthesized Ag-NPs-AC for the MO removal Click here to View figure |
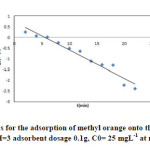 |
Fig9: Pseudo-first-order kinetics for the adsorption of methyl orange onto the silver nanoparticles loaded on AC; conditions: pH=3 adsorbent dosage 0.1g, C0= 25 mgL-1 at room temperature. Click here to View figure |
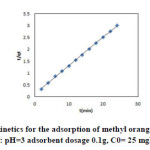 |
Fig10: Pseudo-second-order kinetics for the adsorption of methyl orange onto the silver nanoparticles loaded on AC ; conditions: pH=3 adsorbent dosage 0.1g, C0= 25 mgL-1 at room temperature. Click here to View figure |
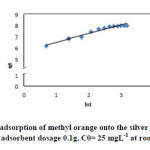 |
Fig11: Elovich kinetic for the adsorption of methyl orange onto the silver nanoparticles loaded on AC ; conditions: pH=3 adsorbent dosage 0.1g, C0= 25 mgL-1 at room temperature. Click here to View figure |
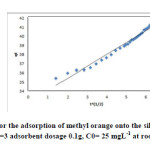 |
Fig12: Intraparticle diffusion for the adsorption of methyl orange onto the silver nanoparticles loaded on AC ; conditions: pH=3 adsorbent dosage 0.1g, C0= 25 mgL-1 at room temperature. Click here to View figure |
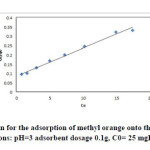 |
Fig13: The Langmuir isotherm for the adsorption of methyl orange onto the silver nanoparticles loaded on AC(iteration 1) ; conditions: pH=3 adsorbent dosage 0.1g, C0= 25 mgL-1 at room temperature. Click here to View figure |
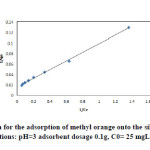 |
Fig14: Langmuir isotherm for the adsorption of methyl orange onto the silver nanoparticles loaded on AC(iteration 2) ; conditions: pH=3 adsorbent dosage 0.1g, C0= 25 mgL-1 at room temperature. Click here to View figure |
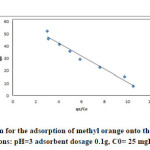 |
Fig15: The Langmuir isotherm for the adsorption of methyl orange onto the silver nanoparticles loaded on AC(iteration 3) ; conditions: pH=3 adsorbent dosage 0.1g, C0= 25 mgL-1 at room temperature. Click here to View figure |
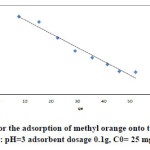 |
Fig16: The Langmuir isotherm for the adsorption of methyl orange onto the silver nanoparticles loaded on AC(iteration 4) ; conditions: pH=3 adsorbent dosage 0.1g, C0= 25 mgL-1 at room temperature. Click here to View figure |
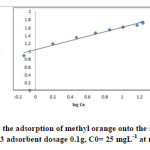 |
Fig17: Freundlich isotherm for the adsorption of methyl orange onto the silver nanoparticles loaded on AC ; conditions: pH=3 adsorbent dosage 0.1g, C0= 25 mgL-1 at room temperature. Click here to View figure |
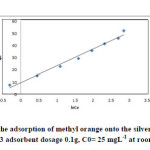 |
Fig18: Temkin isotherm for the adsorption of methyl orange onto the silver nanoparticles loaded on AC ; conditions: pH=3 adsorbent dosage 0.1g, C0= 25 mgL-1 at room temperature. Click here to View figure |
Conclusion
Synthesized silver nanoparticles by starch solution and loaded onto activated carbon (from olive stone) appeared to be an excellent adsorbent for removal methyl orange dye from aqueous solutions. The effect of experimental parameters such as pH range reagent concentration, contact time, dosage amount of adsorbent and so on, on the behavior and efficiency of synthesized Ag-NPs-AC and the adsorption process were investigated and the resultant values were kinetically better consistent with the pseudo second order reaction and Elovich model and thermodynamically to the Langmuir, Freundlich and Temkin models. Langmuir model fitted better our experimental results.
References
- Mohan S. V, Roa C N, Prasad K K and Karthikeyan J, Waste Manage., 2002, 22, 575-582.
- M. Ghaedi, et al., J. Ind. Eng. Chem. (2012), http://dx.doi.org/10.1016/j.jiec.2012.08.006
- C. Moreno-Castilla, F. Carrasco-Marı´n, M.V. Lo´pez-Ramo´n, M.A. A ´ lvarez-Merino, Carbon 39 (2001) 1415.
- D. Lozano-Castello´ , M.A. Lillo-Ro´denas, D. Cazorla-Amoro´ s, A. Linares-Solano, Carbon 39 (2001) 741.
- M.A. Lillo-Ro´denas, D. Lozano-Castello´ , D. Cazorla-Amoro´ s, A. Linares-Solano, Carbon 39 (2001) 751.
- G.H. Oh, C.R. Park, Fuel 81 (2002) 327.
- M.A. Lillo-Ro´denas, D. Cazorla-Amoro´ s, A. Linares-Solano, Carbon 41 (2003) 267.
- Ghosh .D and B.hattacharyya, KG, Appl Clay Sci., 2002, 20, 295-300.
- Bulut .E, Ozacar .M and Sengil .I. A, J Hazard Mater., 2008, 154, 613–622.
- M. GHAEDI, S. J. HOSSEINI and S. RAMEZANI, Platinum Nanoparticles Loaded on Activated Carbonas Novel Adsorbent for the Removal of Congo Red,http://www.e-journals.net, E-Journal of Chemistry2012, 9(1), 63-74.
- T. Robinson, G. Mcmullan, R. Marchant, P. Nigam, Remediation of dyes in textileeffluent: a critical review on current treatment technologies with a proposedalternative, Bioresour. Technol. 77 (2001) 247–255.
- R.-S. Juang, R.-L.Tseng, F.-C.Wu, S.-H.Lee,Adsorptionbehaviour of reactive dyesfrom aqueous solutions on chitosan, J. Chem. Technol. Biotechnol. 70 (1997)391–399.
- S. Karcher, A. Kornmuller, M. Jekel, Removal of reactive dyes by sorption/complexation with cucurbituril,Water Sci. Technol. 40 (1999) 425–433.
- Z. Aksu, S. Tezer, Equilibrium and kinetic modelling of biosorption of RemazolBlack B by R. arrhizus in a batch system: effect of temperature, Process Biochem.36 (2000) 431–439.
- T. O’Mahony, E. Guibal, J.M. Tobin, Reactive dye biosorption by Rhizopusarrhizusbiomass, Enzyme Microbial Technol. 31 (2002) 456–463.
- R.B. Venkata, C.A. Sastray, Removal of dyes from aqueous solutions by cellulosicwaste orange peel, Indian J. Environ. Prot. 7 (1987) 363–376.
- F. Yuzhu, T. Viraraghavan, Dye biosorption sites in Aspergillusniger, Bioresour.Technol. 82 (2002) 139–145.
- Kucukosmanoglu, M., Gezici, O. and Ayar, A. (2006) Theadsorption behaviors of methylene blue and methyl orange ina diaminoethanesporopolleninmediated column system. Sep.Purif. Technol. 52 (2), 280–287.
- Chang, R.W., Chadwick, J. Allison, J.C., Hayes, Y.O., Talley,D.L. and Autry, C.E. (1994) Microbial succession andintestinal enzyme activities in the developing rat. J. Appl.Bacteriol. 77 (6), 709–718.
- Chung, K.T., Stevens Jr. S.E. and Cerniglia, C.E. (1992) Thereduction of azo dyes by the intestinal microflora. Crit. Rev.Microbiol. 18 (3),175–190.
- Chung, K.T. (1983) The significance of azo-reduction in themutagenesis and carcinogenesis of azo dyes. Mutat. Res. 114(3), 269–281.
- El Qada, E.N., Allena, S.J. and Walker, G.M. (2008) Adsorptionof basic dyes from aqueous solution onto activated carbons.Chem. Eng. J. 135 (3), 174-184.
- Namasivayam C and Kavitha D, Dyes Pigments, 2002, 54, 47–58.
- Ghaedi. M, Zamani Amirabad .S, Marahel F, NasiriKokhdan S, Sahraei R andDaneshfar A, SpectrochimActa Part A: MolBiomolSpectrosc, 2011, 83, 46–51.17. F. Yuzhu, T. Viraraghavan, Dye biosorption sites in Aspergillusniger, Bioresour.Technol. 82 (2002) 139–145.
- Chatterjee. S, Lee .D. S, Lee. M. W and Woo. S. H, Biores. Technol., 100, 2009, 2803–2809.
- Malik. P. K and Saha. S. K, Sep Purif Technol., 2003, 31, 241–250.
- Vogelpohl. A and Kim. S. M, J IndEng Chem., 2004, 10, 33–40.
- Ciardelli. G, Corsi. L and Marussi. M, ResourConservRecycl., 2001, 31, 109–113.
- Gopinath. K. P, Murugesan. S, Abraham J, Muthukumar. K and Bacillus. S. P, BioresourTechnol., 2009, 100, 6295–6300.
- Orfao. J. J. M, Silva. A. I. M, Pereira. J. C. V, Barata. S. A, Fonseca. I. M, Faria. P. C. C andPereira M F R, J CollInterf Sci., 2006, 296(2), 480–489.
- Nandi. B. K, Goswami A and Purkait M K, J Hazard Mater., 2009, 161(1), 387–395.
- Slejko. F. L, Adsorption Technology, New York, 1985.
- Suffet. I. H and McGurie. M. J, Ann Arbor Sci Michigan, 1985, 1–2.
- Jain. R. and Sikarwar. S, J Hazard Mater., 2008, 152, 942–948.
- Kreyling. W, Parameters of nanoparticles determiningdistribution and accumulation in secondary targetorgans. Toxicol.Lett.2007, 172, S35.http://dx.doi.org/10.1016/j.toxlet.2007.05.121
- Slawson. RM, Trevors. JT, Lee, H: Silver accumulation and resistance inPseudomonas stutzeri. Arch. Microbiol. 158, 398–404 (1992)
- Zhao. GJ, Stevens. SE: Multiple parameters for the comprehensive evaluationof the susceptibility of Escherichia coli to the silver ion. Biometals 11,27–32 (1998)
- Sukumaran Prabhu and Eldho. K. Poulose: Silver nanoparticles: mechanism of antimicrobialaction, synthesis, medical applications, andtoxicity effects, International Nano Letters 2012, 2; 32, http://www.inl-journal.com/content/2/1/32
- Raveendran. P, Fu. J, Wallen SL. J Am ChemSoc 2003;125:13940.
- Virender. K, Sharma. Ria A. Yngard, Yekaterina Lin:Silver nanoparticles: Green synthesis and their antimicrobial activities, Advances in Colloid and Interface Science 145, 83–96 (2009)
- Ghaedi. M., Ghezelbash. GR., Marahel, F. (2010) Equilibrium,Thermodynamic, and Kinetic Studies on Lead (II) Biosorption from Aqueous Solution by Saccharomyces cerevisiaeBiomass. Clean-Soil Air Water. 38(9), 877-885.
- M. Ghaedi, F. Karimi, B. Barazesh, R. Sahraei, A. Daneshfar: Removal of Reactive Orange 12 from aqueous solutions by adsorption on tinsulfide nanoparticle loaded on activated carbon, Journal of Industrial and Engineering Chemistry 19 (2013) 756–763
- Lata. H., Garg, V.K., Gupta, R.K., (2008) Adsorptive removalof basic dye by chemically activated Parthenium biomass:equilibrium and kinetic modeling. Desalination. 219,250–261.
- M. Ghaedi, A. Ansari, M.H. Habibi, A.R. Asghari, Removal of malachite green from aqueous solution by zinc oxidenanoparticle loaded on activated carbon: Kinetics and isotherm study, Journal of Industrial and Engineering Chemistry 20 (2014) 17–28
- S. Javad Hosseini, SyamakNasiri Kokhdan1, A. Mohamad Ghaedi1 and S. SamanMoosavian, Comparison of multiwalled carbon nanotubes and activated carbon for efficient removal of Methyl Orange:Kinetic and Thermodynamic investigation. Fresenius Environmental Bulletin, volume 20, No 1a (2010)
- Lagergren, S. (1898) Zurtheorie der sogenennten adsorptiongelosterstoffe, Kungliga .Svenskavetenskademiens. Handlingar,24, 1–39.
- Kavitha, D. and Namasivayam, C. (2007) Experimental andkinetic studies on methylene blue adsorption by coir pith carbon,Bioresour. Technol. 98 (1), 14–21.
- Demirbas, E. and Nas, M.Z. (2009) Batch kinetic and equilibriumstudies of adsorption of Reactive Blue 21 by fly ash andsepiolite. Desalination. 243 (1-3), 8–21.
- Aruna Jyothi Kora and Jayaraman Arunachalam, Green Fabrication of Silver Nanoparticles byGumTragacanth (Astragalus gummifer): A Dual Functional Reductant and Stabilizer; Hindawi Publishing Corporation Journal of Nanomaterials Volume 2012, Article ID 869765, 8 pagesdoi:10.1155/2012/869765

This work is licensed under a Creative Commons Attribution 4.0 International License.
![]()
A New Edition of Web of Science
Journal Impact Factor
2022: 0.5
Five Year: 0.8
Journal is Indexed in

Cabells Whitelist
![]()


