Synthesis, spectroscopic, thermal, electrical conductivity and antimicrobial interpretations of new VO(II), Zn(II), Pd(II), Au(III) and Pt(IV) complexes with hypertensive atenolol drug
Department of Chemistry, Faculty of Science, Princess Nora Bint Abdul Rahman University, Riyadh, Kingdom Saudi Arabia
DOI : http://dx.doi.org/10.13005/ojc/300402
Download this article as:
![]()
New complexes of VO(II), Zn(II), Pd(II), Au(III) and Pt(IV) with atenolol (ATN) hypertensive drug ligand were synthesized and characterized by elemental analysis, conductometry, magnetic susceptibility, UV–Vis, IR, ESR, 1H-NMR spectroscopy, X-ray diffraction analysis of powdered samples, scanning electron microscopy (SEM), and thermal analysis. The IR spectral data suggested that the ATN ligand behaves as a monobasic bidentate ligand towards the central metal ion with nitrogen atom of –NH secondary amine and the oxygen atom of –OH group after deprotonated. From the microanalytical data, the stoichiometry of the complexes 1:2 (metal: ligand) was found. The ligand and their metal complexes were screened for antibacterial activity against (Escherichia coli, and Staphylococcus aureus) and fungicidal activity against (Aspergillus flavus and Candida albicans). The Electrical conductivities of ATN and its metal complexes were also measured with DC electrical conductivity in the temperature range from room to 483 K.
KEYWORDS:Transition metals; Atenolol; Spectroscopic studies; Thermal analyses; DC electrical conductivity
Introduction
Metallo-pharmaceutical interactions were playing a significant role in therapeutic and diagnostic medicine industrials. In literature survey, the studies were proved that when bioorganic molecules were introduced as transition metal chelates they have been increased activities and more therapeutic importance were presented [1, 2]. The discovery and development of new metallodrugs remain an ever growing area of research in medicinal inorganic chemistry [3-5], which may usefully be divided into two main categories: firstly, ligands as drugs which target metal ions in some form, whether free or protein-bound; and secondly, metal-based drugs and imaging agents where the central metal ion is usually the key feature of the mechanism of action [6]. The therapeutic application of metal complexes including for examples: bleomycin antibiotic causes DNA strand scission through formation of an intermediate metal complex requiring a metal ion cofactor such as copper or iron for the activity in the treatment of cancer [7]. Antibiotic drugs of the tetracycline family are chelators of Ca2+ and Hg2+ ions. The ruthenium polyaminocarboxylate complexes (Ru-pac) possess cysteine protease inhibition activity, these complexes act as metallo-inhibitor agents
for disease progression [8]. The cisplatin, carboplatin were the first and second generation platinum drugs respectively, which were widely used in the treatment of cancer [9]. On the base of the structural analogy between Pt(II) and Pd(II) complexes, some studies of palladium compounds as suitable drugs have been carried out [10]. Geometry and complex forming processes of Pd(II) are very similar to those of Pt(II) therefore it was speculated that palladium complexes may also have antitumour activities and serve as good models for the understanding of more inert Pt(II) anticancer drugs [11-14]. The auranofin and other Au(I) complexes were well known as antiarthritic drugs, but they also inhibit the growth of cultured tumor cells “in-vitro” and many have antimitochondrial activity[15]. Auranofin has recently become known as a potent and specific inhibitor of thioredoxin reductase [16]. The antihypertensive and insulin-mimetic agents have been directed towards coordination chemistry of vanadium complexes [17].
Hypertension is one of the major causes of disability and death in the world. Today, approximately 1 billion people worldwide suffer from high blood pressure, and the number is expected to reach to 1.56 billion by the year 2025 [18]. The physiological activity of anti-hypertension of some substituted aminoalcohols that act as beta-blockers was the reason for their relatively wide use in medical practice in the last years. At the same time, due to the presence of amino- and hydroxy-groups in their molecules they are active donors especially suitable for coordination of biometals such as copper and zinc [19-23]. Atenolol (ATN; Fig. 1), chemically known as 4-(2-hydroxy-3-[(1- methylethyl) amino] propoxy) benzeneacetamide [24], is a β1-selective (cardio selective) adrenoreceptor antagonist drug widely used in the treatment of hypertension, antiangina treatment to relieve symptoms, improve tolerance, and as an antiarrhythmic to help regulate heartbeat and infections. It is also used in management of migraine prophylaxis, hyperthyroidism, and tremors [25]. The drug is official in Indian Pharmacopoeia [26] which describes a UV-spectrophotometric method and also in British Pharmacopoeia [27] which recommends high-performance liquid chromatographic (HPLC) method for its determination. The therapeutic importance of atenolol was behind the development of numerous methods for its determination. The different method techniques adapted to the analysis of Atenolol have been reported [28-34]. However, Literature survey reveals that there is no attempt has been made to study the complexation of ATN by transition metals except copper [35-38].Sodiumatenolol dithiocarbamate (ADTC) and its complexes with copper, nickel, zinc, cobalt and cadmium have been synthesized [39].
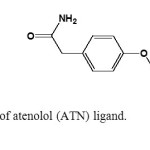 |
Fig1: Structure of atenolol (ATN) ligand. Click here to View figure |
Atenolol is an aminoalcohol and induces a chiral center .The combination of hydroxy- and amino-groups makes atenolol a good chelating ligand, allowing the formation of a five- membered ring. However, literature survey has revealed that very little attempt has been made to study the complexes of transition metal ions with the above mentioned drug ligand. It is a thought of interest to study the synthesis and characterization, thermal behavior, electrical conductivity and biological screening of the new transition metal complexes of VO(II), Zn(II), Pd(II), Au(III) and Pt(IV) with atenolol drug molecule. The processes of thermal degradation of the ligands and their metal complexes have been investigated by thermoanalytical method (TG/DTG). The Coats-Redfern and Horowitz-Metzeger integral methods have been used to determine the associated kinetic parameters for the successive steps in the decomposition sequence. Drug compounds are biologically active; these compounds have become of interest to be studied biologically, and compared their activities against two species of bacteria (Staphylococcus aureus and Escherichia coli) and two fungal species (Aspergillus flavus and Candida albicans). In addition, DC electrical conductivity measurements, as a function of temperature, were also carried out to have an idea about the type of conduction mechanism in these compounds. DC electrical conductivity: Intensive research activities on organic semiconducting materials have led to insights into their chemical and physical properties. In the present investigation DC electrical measurements were carried out on VO(II), Pd(II), Au(III) and Pt(IV) ATN complexes as a function of temperature. These measurements gave an idea about electronic structure and identification of the conduction mechanisms operating in different samples.
Experimental
Materials
All chemicals pure atenolol drug, (AuCl3, PtCl4, PdCl2, VOSO4 and ZnCl2), solvents (ethanol and dimethylsulfoxide DMSO), reagents (saturated solution of AgNO3 (check chloride ions) and BaSO4 (check sulfate ions)), were commercially available from BDH and were used without further purification.
Preparation of the metal (II, III, IV) drug complexes
All the prepared complexes under investigation were synthesized similarly according to the following procedure:
In general, 2 mmol of pure atenolol drug ligand was dissolved in 25 mL ethanol then mixed with 25 mL of hot ethanolic solution (60 oC) of 1 mmol of metal chlorides (Au(III), Pt(III), Pd(II) and Zn(II)) or metal sulphate like VO(II) ion. A mixtures with molar ratio of 1:2 (M: ligand), at adjusted pH = 8–9 using 1 M ethanolic ammonia solution were refluxed with continuous stirring at 60–70 oC for about 4 h. The mixtures were left overnight until precipitated. The precipitates obtained were filtered off and washed several times using methanol then left over anhydrous calcium chloride. The yield percent of the products collected were about 60–70%.
Analyses
Spectral measurements
IR spectra of the metal complexes were recorded on Bruker infrared spectrophotometer as potassium bromide pellets, and in the range 400–4000 cm-1, at Ain Shams University. The electronic spectra of the complexes were measured in DMSO solvent with concentration of 1×10⁻³ M, in rang 200–1100 nm by using Unicam UV/Vis spectrometer, at Cairo University. The proton NMR spectra were recorded on a Varian FT- 300 MHz spectrometer in d6-DMSO solvent, using TMS as internal standard (at Cairo University, Giza, Egypt). SEM images were obtained using a Jeol Jem-1200 EX II Electron Microscope at an acceleration voltageof 25 kV. The samples were coated with a gold plate. X-ray diffraction (XRD) patterns of the samples were recorded on a X Pert Philips X-ray diffractometer. All the diffraction patterns were obtained by using CuKα1 radiation, with a graphite monochromator at 0.02o/min scanning rate. The electron spin resonance (ESR) spectrum for vanadyl(IV)/ATN complex was performed on Jeol, JES-FE2XG, ESR-spectrometer, Frequency 9.44 GHz with Jeol Microwave unit.
Micro analytical analysis
Carbon, hydrogen and nitrogen analysis of the complexes have been carried out in Vario EL Fab. CHNS Nr.11042023, at Central Laboratory, Faculty of Science, Cairo University, Egypt. The amount of water and the metal content percentage were determined by thermal analysis methods.
Molar conductance
The molar conductance of 10-3 M solutions of the atenolol ligand and their metal complexes in DMSO solvent were measured on a HACH conductivity meter model. All the measurements were taken at room temperature for freshly prepared solutions.
Melting point measurements
Stuart Scientific electro thermal melting point apparatus was used to measure the melting points of the ligands and their metal complexes in glass capillary tubes in degrees Celsius.
Magnetic measurements
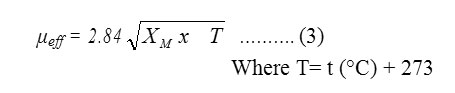
The mass susceptibility (Xg) of the solid complexes was measured at room temperature using Gouy’s method by a magnetic susceptibility balance from Johnson Metthey and Sherwood model, at Cairo University Central Lab. The effective magnetic moment (μeff) values were obtained using the following equations (1, 2 and 3).
Where:
Ro = Reading of empty tube
L = Sample length (cm)
M = Sample mass (gm)
R = Reading for tube with sample
CBal = balance calibration constant = 2.086
XM = Xg x M.Wt. ……….(2)
The values of XM as calculated from equation (2) are corrected for the diamagnetism of the ligands using Pascal’s constants, and then applied in Curie’s equation (3).
Thermal analysis
Thermogravimetric Analysis (TGA) experiments were conducted using Shimadzu TGA-50H thermal analyzers at (MicroAnalyticalCenter, Ain Shams University-Cairo-Egypt). All experiments were performed using a single loose top loading platinum sample pan under nitrogen atmosphere at a flow rate of 30 mL/min and a 10 o C/min heating rate for the temperature range 25–800 o C.
Biological screening
The atenolol drug ligand and their metal complexes were tested for their antimicrobial activity against two species of bacteria (S. aureus and E. coli) and two fungal species (A. flavus and C. albicans) using filter paper disc method [40].The screened compounds were dissolved individually in DMSO (dimethylsulfoxide) in order to make up a solution of 1000 lg/mL concentration for each of these compounds. Filter paper discs (Whatman No. 1 filter paper, 5 mm diameter) were saturated with the solution of these compounds. The discs were placed on the surface of solidified Nutrient agar dishes seeded by the tested bacteria or Czapek’s Dox agar dishes seeded by the tested fungi. The diameters of inhibition zones (mm) were measured at the end of an incubation period, which was 24 h at 37 o C for bacteria, and 4 days at 28 o C for fungi. Discs saturated with DMSO are used as solvent control. Ampicillin 25 lg/mL was used as a reference substance for bacteria and 30 lg/mL Mycostatin for fungi [41, 42].
Results and discussions
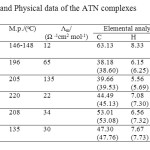 |
Table1: Analytical and Physical data of the ATN complexes Click here to View table |
The metal complexes of ATN with Au(III), Pt(IV), Pd(II), VO(II) and Zn(II) were synthesized. Some physical properties and analytical data of the new five complexes were summarized in Table 1. The satisfactory elemental analysis results (Table 1) show that the Au(III), Pt(IV), Pd(II), VO(II) and Zn(II) complexes with atenolol drug were of 1:2 (metal: ATN) molar ratio. The Au(III), Pt(IV), Pd(II), VO(II) and Zn(II) synthesized complexes have brown, yellow, brown, dark green and yellowish white in color, respectively. The melting points of ATN complexes ranged from 135-220 oC (Table 1). These complexes were partially soluble in hot methanol, dimethylsulfoxide and dimethylformamide, but insoluble in water and some other organic solvents. The suggested formula structures of the complexes were based on the results of the elemental analyses, molar conductivity, (infrared, UV–visible) spectra, effective magnetic moment in Bohr magnetons, as well as the thermal analysis (TG), and characterized by X-ray powder diffraction (XRD) and scanning electron microscopy (SEM).
Molar conductance
The molar conductance values for the Au(III), Pt(IV), Pd(II), VO(II) and Zn(II) ATN complexes were determined in DMSO at the concentration of (1×10⁻³ mol/cm3). These values (Table 1) were presence in the range of 22-135 Ω -1cm2 mol-1, but the free ligand has a lower value 12 Ω -1cm2 mol-1. From the results exhibited in Table 1, the Pd(II), VO(II) and Zn(II) complexes have non-electrolytic nature, but Au(III) complex has slightly electrolytic behavior. On the other hand, the complex of Pt(IV) has a good electrolyte nature because of its has two ionizable chloride ions in the outer sphere of coordination state.
Electronic spectra
The UV absorption spectra of ATN show two absorption peaks at 225 nm and 274 nm corresponding to different electronic transitions of the molecule [43]. The spectra of the complexes were taken in DMSO in order to obviate the effect of the solvent. The electronic spectra of the five complexes obtained show broad asymmetric band in the UV region (relatively weak, low-energy bands). These data are in accord with the assumption for the formation of M–N and M–O bonds [44]. The electronic spectra of all complexes contain bands with higher molar absorptivity in the 300–250 nm range, and these bands are assigned to primarily ligand-centered transitions. The bands at higher energies are associated with benzene rings π-π* transitions [44].
 |
Fig2: The UV absorption spectra of ATN and their complexes Click here to View figure |
Infrared Spectra
It is worth mentioning that in solid phase, ATN ligand is involved in two strong intermolecular hydrogen bonds through (NH2 and C=O) groups and (–OH and –NH) groups [45]. The i.r. spectrum of atenolol (Fig. 3a) shows two bands at 3356 and 3174 cm-1 assigned to the OH, NH2 and NH group stretching frequencies, no single band related to ν(OH) was observed in the ligand spectra. The intense infrared band at 1639 cm-1 with the shoulder at 1670 cm-1 is assigned to ν(C=O) vibrations. The doubling of this band can be explained on the basis of different H bonding arrangements of the molecules in solid state [45, 46]. The mode δ(NH) not seen in the IR or Raman experimental spectrum. This fact can be explained by taking into account the intermolecular HB effects which are expected to have an important blue-shifting effect on this band and most probably, it is contained in the broad peak centered at1639 cm-1 in the IR spectrum. This supposition is sustained by the observed IR peak in the spectrum of metoprolol, another b-blocker with a similar structure to atenolol but without amide groups, at 1634 cm-1 that can be safely assigned to δ(NH) mode since this molecule does not contain the carbonyl group [47]. In comparison with the published spectra [47-52] of the free ATN spectra (Fig. 3a), the infrared spectra of ATN complexes (Fig. 3b-f) contain the characteristic absorption bands of ATN. The most significant FT-IR bands assignments are listed in (Table 2) and based on the following evidences:
- The ligand band at 3174 cm-1 corresponding to the secondary amine ν(NH) vibration is slightly positively shifted in the spectra of the complexes, also the bands at 2964 cm-1 and 2924 cm-1 which assigned to the asymmetric and symmetric stretching of the methyl groups attached to (HNC) group, respectively, where shifted toward lower wavenumber for νs(CH3) and towards higher wavenumber for νas(CH3) as a result of complexation. This situation confirms that involvement of the nitrogen atom from the aminoalcohol fragment of the ligand in the complexation with metal ions.
- An important band of the atenolol is that corresponding to ν(CO) and δ(NH) vibrations, because it is intense and very sensitive to structure features. A partial overlapping of the bands corresponding to these vibration modes occurs, making the spectra appear as a doublet [53]. In the complex this band is blue shifted, indicating the participation of –NH group in the chelation process.
- The characteristic band for δ(COH) is downshifted in the complex compared to the same vibration in the pure ligand, and this may be refer to the stability of the hydroxyl group as a result of deprotonation and cleavage of hydrogen bonds during the complexation or that mean this group is flat with metal [54]. The band for the ν(C–O) of alcoholic group of ATN that appears at 1037 cm-1 has blue shifted after complexation, indicating the participation of the alcoholic group in the coordination.
- The absorbation maximum at 3356 cm-1 was assigned to ν(NH2). Fermi– resonance between the symmetric NH2 frequency and the overtone of the NH2 bending mode caused appearance the doublet bands. Such splitting of the ν(NH2) is observed when NH2 function participates in the formation of inter H-bond. The asymmetric stretching vibration of NH2 group in free ATN appeared at 3356 cm-1. This stretching band of amide group in the metal complexes are split (in case of zinc(II), Pd(II) complexes) and appeared in the 3366–3218 cm-1 region at near or slightly higher wavenumber than comparative bands in free ATN because of hydrogen bonds [55]. The position of the band corresponding to the δ(OCNH2) vibration in the free ATN is observed at 1298 cm-1. In the complexes, this band does not shift to higher or lower region; these facts confirm that the nitrogen atom of the amide group did not involve in the chelation process.
- The ν(C-C ring) vibration band is existed at 1612 cm-1 remains almost un-shifted with respect to the free ligand. The same behavior is observed for the bands at 1244 and 886 cm-1, assigned to δ(CH2) and ring breathing, respectively.
- The low intensity bands in the region of 600–400 cm-1 are assigned to M–N and M–O vibrations [56]. These data assume a bidentate manner of coordination of ATN ligand with the metal ions through –NH and deprotonated of –OH group from the aminoalcohol moieties of two different ATN molecules.
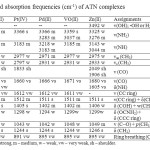 |
Table2: Infrared absorption frequencies (cm-1) of ATN complexes Click here to View table |
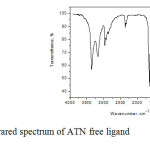 |
Fig3a: Infrared spectrum of ATN free ligand Click here to View figure |
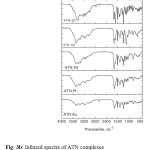 |
Fig3b: Infrared spectra of ATN complexes Click here to View figure |
ESR and magnetic measurements
The diffuse reflectance electronic spectra of VO(II)/ATN complex in the visible region show the characteristic bands of VO(II) in a square pyramidal configuration. The absorptions at around 13,333 cm-1 and the weak broad band at 17,544 cm-1 are assigned to the spin allowed 2B2→2E, and 2B2→ 2B1 transitions [57]. Magnetic moments of VO(II)/ATN complex was measured at room temperature and effective magnetic moment (µeff) value is 1.73 B.M. that the magnetic moment values of the vanadyl complexes ranges from 1.71-1.76 B.M which correspond to a one electron of the 3d1 system of square-pyramidal oxovanadium(IV) complexes [58].
The ESR spectrum of the VO(II)/ATN complex was recorded in DMSO at room temperature (Fig. 4). The spectrum at room temperature show eight lines, which are due to hyperfine splitting arising from the interaction of the unpaired electron with a 51V nucleus having the nuclear spin I = 7/2. This confirms the presence of a single V(IV) cation as the metallic centre in the complex. Both of g|| and g┴ are in good agreement for a square pyramidal vanadyl complexes [59]. The g||, g ┴, A|| and A ┴ values were calculated from the spectrum and the trend of g values calculated from the spectrum (g|| < g┴ < 2), which are in good agreement for a square pyramidal structure.
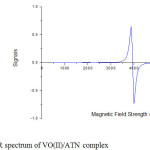 |
Fig4: ESR spectrum of VO(II)/ATN complex Click here to View figure |
1H-NMR spectra
The 1H-NMR spectra data of the ATN free ligand in (DMSO-d6) (Fig. 5 and Scheme 1) has a sharp singlet at 4.916 ppm due to the –OH proton, this peak disappeared completely in the spectra of the ATN metal complexes, due to the deprotonation of the –OH group. At the same time, the peak from the –OCH proton was deshielded in the spectra of all complexes as listed in Table 3 because of the strong influence of the electronegativity of the oxygen atom of OH. The coordination processes with all metal ions lead to upfield shifting of the –NH proton signals with a chemical shift difference. The ATN metal complexes show a sharp singlet at 1.048 –1.155 ppm due to methyl protons thus suggesting the magnetically equivalence of these protons. The –CH protons, in the complexes appear as a triplet at 2.49–3.11 ppm and a sharp singlet at 3.65−4.00 ppm due to –CH2 protons and these signals are influenced to a low degree with complex formation. These facts strongly support the coordination a site already discussed above and is deduced on the basis of other experimental results.
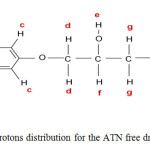 |
Scheme1: Scheme of protons distribution for the ATN free drug ligand Click here to View scheme |
Table 3: 1H-NMR absorption frequencies (cm-1) of ATN and their complexes
| Protons |
δ- Chemical shift (ppm) |
|||||
| ATN* | ATN | Au(III) | Pt(IV) | Pd(II) | Zn(II) | |
|
a |
7.410 | 7.350 | 7.5117.4287.342 | 7.436 | 7.383 | 7.371 |
|
b |
7.158 | 7.1657.136 | 7.1907.166 | 7.1917.162 | 7.1787.149 | 7.1747.149 |
|
c |
6.855 | 6.8356.8426.8646.873 | 6.8996.8946.870 | 6.8946.8666.792 | 6.9036.877 | 6.9386.915 |
|
d |
3.840 | 3.8193.840 | 3.9663.949 | 3.9983.963 | 3.9393.922 | 3.915 |
|
e |
5.000 | 4.916 | — | — | — | — |
|
f |
3.910 | 3.8603.908 | 3.4873.474 | 3.9463.9113.3453.322 | 3.9793.955 | 4.2244.079 |
|
g |
2.539 | 2.4932.564 | 2.0572.4962.490 | 2.5002.480 | 2.6902.6162.499 | 2.5022.497 |
|
h |
1.500 | 1.5001.924 | 1.2601.2441.201 | 1.2971.2671.250 | 1.6051.5811.240 | 1.3061.288 |
|
i |
2.680 | 2.6372.734 | 3.0772.9652.934 | 3.0743.0652.9682.895 | 2.9822.9612.8812.7562.716 | 2.8082.773 |
|
j |
0.970 | 0.9580.961 | 1.0481.0541.071 | 1.138 | 1.2191.197 | 1.2621.155 |
|
k |
0.975 | 0.9780.983 | 1.1961.179 | 1.2471.231 | 1.1731.1081.0871.0531.031 | 1.138 |
|
l |
6.850 | 6.8266.790 | 6.8666.794 | 6.8946.7926.792 | 6.8506.788 | 6.8786.792 |
|
m |
3.285 | 3.312 | 3.4273.4243.4043.3483.327 | 3.2963.2813.2573.117 | 3.4773.4273.4043.2863.2233.003 | 3.2863.2233.076 |
* http://homepage.ntlworld.com/bhandari/Imperial/Atenolol/Spectroscopy.htm
 |
Fig5A: 1H-NMR spectra of a- ATN free ligand and b- Zn/ATN complex Click here to View figure |
 |
Fig5B: 1H-NMR spectra of a- ATN free ligand and b- Zn/ATN complex Click here to View figure |
Thermal analyses and kinetic studies
Thermal analysis of the ligand
The TG curve (Fig. 6) of the atenolol free ligand shows four main consecutive steps of mass loss at the temperature ranges (30–624 oC) with no residue left over at the end of the decomposition process (Table 4). At the first step (30–286 oC), the mass loss of 10.02% corresponds to elimination of the ethane molecule (Cal. = 10.52%). The mass loss (37.83%) at the second step (286–374 oC) is assigned to a strong release of (2C2H2 +H2O+NO+½H2) with Cal. = 37.20%. The activation energies calculated for the first and second steps are 2.6600×10⁴ and 1.28000×10⁵ kJ mol-1, respectively (Table 5). The mass loss of 28.43% at the third step (374–547 oC) was consistent with the evolution of the benzene ring (Cal. =29.31%), the activation energy of this step was 5.8150×10⁴ kJ mol-1. Finally, the fourth step (547-624 oC) of 23.72% mass loss was due to releasing the remaining of the ATN molecule (Cal. = 22.17%). The activation energy of this step was 2.62000×10⁵ kJ mol-1. The ∆ S*, ∆H* and ∆ G* calculated for these four-steps were (-1.695×10² ,-7.865×10, -1.81×10² and 1.37×10 J k-1mol-1), (2.3000×10⁴, 1.23000×10⁵, 5.2050×10⁴ and 2.55000×10⁵ kJ mol-1) and (9.6050×10⁴, 1.70000×10⁵, 1.85000×10⁵ and 2.43500×10⁵ kJ mol-1), respectively. The TGA (TG and DTG) curves recorded for the Au(III), Pt(II), Pd(II), VO(II) and Zn(II) atenolol complexes were given in Fig. 6 and represented in Table 4. These curves, which characterize and compare the thermal decomposition behavior of the ligand and its complexes at the heating rate of 10 oC min-1 under nitrogen, generally show consecutive steps for almost uninterrupted mass losses in the sequential decomposition of these complexes (i.e. no clear plateau between the steps on TG curves) over the experimental temperature range (30–800 oC).
Thermal analysis of the atenolol complexes
Table 4 and 5 compare the characteristic thermal and kinetic parameters determined for each step in the decomposition sequence of the complexes. These parameters were determined using Coats–Redfern and Howrtiz Metzger equations [60, 61], and represented as the average values of the two equations .It can be seen clearly that the mass losses (∆m%) obtained from the TGA curves and that calculated for the corresponding molecule, molecules or fragment were in good agreement as was the case for all of these complexes. However, as the compositions of the decomposition products (fragments) of the backbone and of the final decomposition products (i.e. final residues) were not proved, thermal decomposition with ill-defined fragments (i.e. equivalent fragments) and ill-defined final states’ products were considered for describing the thermal decomposition of these five complexes. The thermal decomposition process of these five complexes can be described as follows:
3-6-2-1-Au–ATN
The TG thermogram of [Au(ATN)2].6H2O.Cl (Fig. 6) involves three successive degradation steps at 30–273, 273–327 and 327–800 oC . The first step (30 –273 oC) at DTG of 150 oC, the mass loss of 12.88% was consistent with the evolution of the uncoordinated water molecules (Cal. 12.40%).The activation energy calculated is 1.5150×10⁴ kJ mol-1 (Table 5). Consequently, (5C2H2+4H2+2NO) (found 24.13%; Cal. 22.74%) may be eliminated in the second step (273–327 oC) at DTG of 300 oC. The activation energy for this step was found to be 2.14500×10⁵ kJ mol-1. The mass loss of 36.63% at the third step (327–800 oC) of the DTG peak (538 oC) was due to the evolution of (2C6H6+C2H2+HNCO+NO+4H2O+HCl) (Cal. 38.07%). The activation energy of this step was 220.5 kJ mol-1. At the end of the decomposition posses the final residue of an ill-defined state was 22.24%, corresponding to one gold metal and few carbon atoms (22.62%). The ∆ S*, ∆H* and ∆ G*calculated for these three-steps were (-6.6×10, 8.38×10, and -1.88×10² J k-1mol-1), (1.1575×10⁴, 2.09500×10⁵, and -1.1900 ×10⁴ kJ mol-1) and (9.0050×10⁴, 1.59000×10⁵, and 9.8550×10⁴ kJ mol-1), respectively.
3-6-2-2-Pt–ATN
The thermolysis of [Pt(ATN)2].3H2O.2Cl (Fig. 6) was characterized by two decomposition steps in the range 30–600 oC. The first step (30–358 oC) of 26.65% mass loss and a DTG peak at 196 oC represents the elimination of (4C2H2+3H2O+2NO+3H2) with Cal. 26.35%. The activation energy was found to be 1.7300×10⁴ kJ mol-1. The mass loss of (found 44.06% and Cal. 45.03%) at the second step (358–600 oC) with TDTG at 480 oC was due to releasing the remaining of the ATN. The activation energy calculated was 4.3400×10⁴ kJ mol-1 (Table 5). At the end of the decomposition presses, the total residual mass of 23.64% is in agreement with the final product of one platinum atom and few carbon atoms (22.93%). The values (-1.82×10², and -1.905×10²JK-1 mol-1), (1.3390×10⁴ and 3.7150×10⁴ kJ mol-1) and (9.8550 x 10⁴and 218.1 kJ mol_1) were the entropy, enthalpy and free energy changes of activation calculated for the two decomposition steps, respectively.
3-6-2-3-Pd–ATN
The TG and DTG curves of [Pd(ATN)2].6H2O (Fig. 6) show four degradation steps of a sequential mass loss with various DTG peaks, and mass loss processes. The first-step (30–143 oC) at a TDTG of 86 oC was assigned to dehydrate of two adsorbed-water (found 4.37%, Cal. 4.83%). The second (143–213 oC), third (213–373 oC) and fourth (373–600 oC) steps were accompanied by 9.71%, 26.95% and 31.58% mass loss due to the release of (4H2O uncoord.; Cal. 9.67%), (5C2H2+2H2O+N2+2H2; Cal. 26.59%) and (2C6H6 +2NO+H2O+5H2; Cal. 32.76%), respectively. Their DTG peaks occur at 178, 293, 318 and 486 oC. The final residue (17.72%) is assigned to Palladium oxide + few carbon atoms (Cal. 16.43%). The activation energies calculated of these four steps are 4.9150×10⁴, 1.46950×10⁵, 7.7700×10⁴ and 1.25000×10⁵ kJ mol-1, respectively, and the values (-1.51×10², 4.28×10, -1.55×10²and -1.315×10²JK-1mol-1), (4.6250×10⁴, 1.43600×10⁵, 7.3000×10⁴ and 1.19000×10⁵ kJ mol-1) and (1.00350×10⁵, 1.24000×10⁵, 1.60500×10⁵ and 2.18500×10⁵ kJ mol-1) were their entropy, enthalpy and free energy changes of activation, respectively.
3-6-2-4-VO–ATN
The TG degradation curve of [VO(ATN)2].2H2O (Fig. 6) reveals four decomposition steps at 36–112, 112–172, 172–385 and 385–800 oC. The first-step (30-112) at a DTG of 74 oC was assigned to the elimination of two water adsorbed molecules (found 5.24%, Cal. 5.54%). The activation energy was 6.2050×10⁴ kJ mol-1 for this step. The removal of one acetylene and one hydrogen molecules (found 4.22%, Cal. 4.31%) takes place at the second step (112–172 oC) with TDTG at 142 oC. At third step (172–385 oC) with DTG of 278 oC, the mass loss of 50.44% was consistent with the release of (2C6H6 +4C2H2+2NO+H2 (Cal.49.60%). The activation energy calculated for the second and third steps were 8.0700×10⁴ and 7.3650×10⁴ kJ mol-1 respectively, (Table 5). At the fourth step (385–800 oC), the mass loss of 20.19% with a strong DTG (592 oC) was due to the release of the remaining ATN (Cal.19.71%). The activation energy this step was 4.7350×10⁴ kJ mol-1. The ill-defined residue at the end of the decomposition reaction may be (½ V2O5 molecule + few carbon atoms (found 16.22%, Cal. 16.47%). The ∆ S*, ∆H* and ∆ G*calculated for these four steps were (-1.0515×10², -8.935×10, -1.595×10² and -1.85×10² J k-1mol-1), (5.9150×10⁴, 7.7250× 10⁴, 6.9050×10⁴and 4.0150×10⁴ kJ mol-1) and (9.5750×10⁴, 1.14500×10⁴, 1.56500× 10⁵ and 1.99500×10⁵ kJ mol-1), respectively.
3-6-2-5-Zn–ATN
The thermolysis of [Zn(ATN)2].6H2O as it follows from (Fig. 6) and referred in Table 5 reveals three decomposition steps at 30–190, 190–420 and 420-800 oC. The first mass loss occurred between 30 and 190 oC at a DTG of 107 oC is due to dehydration of two water uncoordinated molecules, with a loss of 5.13% which is closed matching with theoretical calculation 5.12%. The activation energy was 2.4350 ×10⁴ kJ mol-1 for this step. The second stage, from 190-420 oC at a DTG of 420 oC, is due to the initial decomposition of this complex, the mass loss of 70.39% was consistent with the release of (2C6H6+6C2H2+4H2O+2NO+O2+3H2) with Cal.68.49%. The third-step (420-800) at a DTG of 610 oC was assigned to the elimination of (2C2H2+H2O+N2+3H2). The activation energy calculated for the second and third step was 7.1800×10⁴ and 4.3550×10⁴ kJ mol-1, respectively (Table 5). At the end of the decomposition presses, the total residual mass of 11.02% is in agreement with the final product of one zinc oxide (11.56%). The values (-1.815×10², 1.25×10 and -1.845× 10² JK-1 mol-1), (2.1150×10², 6.7000×10⁴ and 3.6250×10⁴ kJ mol-1) and (9.0150×10⁴, 1.35500×10⁵ and 1.99500×10⁵kJ mol-1) were the entropy, enthalpy and free energy changes of activation calculated for the three decomposition steps, respectively.
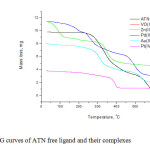 |
Fig6: TG curves of ATN free ligand and their complexes Click here to View figure |
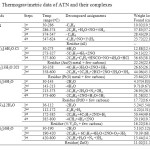 |
Table4: Thermogravimetric data of ATN and their complexes Click here to View table |
Table 5: Kinetic thermodynamic data of ATN and their complexes a=ATN, b= Au-ATN, c= Pt-ATN, d= Pd-ATN, e= VO-ATN, f= Zn-ATN
|
∆G* (kJ mol-1) |
∆H* (kJ mol-1) |
∆S* (J k-1mol-1) |
∆E (kJ mol-1) |
r |
∆G* (kJ mol-1) |
∆H* (kJ mol-1) |
∆S* (J k-1mol-1) |
E (kJ mol-1) |
r |
||
|
1.22*105 |
2.74*104 |
-2.20*102 |
3.10*104 |
0.9204 |
7.01*104 |
1.86*104 |
-1.19*102 |
2.22*104 |
0.8062 |
1st |
a |
|
1.69*105 |
1.29*105 |
-6.65*10 |
1.34*105 |
0.9927 |
1.71*105 |
1.17*105 |
-9.08*10 |
1.22*105 |
0.9943 |
2nd |
|
|
2.13*105 |
5.77*104 |
-2.12*102 |
6.38*104 |
0.9715 |
1.57*105 |
4.64*104 |
-1.50*102 |
5.25*104 |
0.9699 |
3rd |
|
|
2.43*105 |
2.62*105 |
2.26*10 |
2.69*105 |
0.9945 |
2.44*105 |
2.48*105 |
-4.80*102 |
2.55*105 |
0.9955 |
4th |
|
|
1.22*105 |
1.52*104 |
-2.51*102 |
1.88*104 |
0.9746 |
5.81*104 |
7.95*103 |
1.19*102 |
1.15*104 |
0.8836 |
1st |
b |
|
1.57*105 |
2.14*105 |
9.19*10 |
2.19*105 |
0.9927 |
1.61*105 |
2.05*105 |
7.57*10 |
2.10*105 |
0.9942 |
2nd |
|
|
2.39*105 |
4.54*104 |
-2.39*102 |
5.22*104 |
0.9404 |
1.45*105 |
3.35*104 |
-1.37*102 |
4.03*104 |
0.9222 |
3rd |
|
|
1.35*105 |
1.84*104 |
-2.49*102 |
2.23*104 |
0.9978 |
6.21*104 |
8.38*103 |
-1.15*102 |
1.23*104 |
0.9875 |
1st |
c |
|
2.21*105 |
4.35*104 |
-2.36*102 |
4.97*104 |
0.7531 |
1.40*105 |
3.08*104 |
-1.45*102 |
3.71*104 |
0.6871 |
2nd |
|
|
9.87*104 |
4.95*104 |
-1.37*102 |
5.24*104 |
0.9416 |
1.02*105 |
4.30*104 |
-1.65*102 |
4.59*104 |
0.9481 |
1st |
d |
|
1.21*105 |
2.02*105 |
1.78*102 |
2.05*105 |
0.9981 |
1.27*105 |
8.52*104 |
-9.24*10 |
8.89*104 |
0.9987 |
2nd |
|
|
1.60*105 |
7.84*104 |
-1.44*102 |
8.31*104 |
0.9337 |
1.61*105 |
6.76*104 |
-1.66*102 |
7.23*104 |
0.9372 |
3rd |
|
|
2.17*105 |
1.27*105 |
-1.19*102 |
1.33*105 |
0.9975 |
2.20*105 |
1.11*105 |
-1.44*102 |
1.17*105 |
0.9933 |
4th |
|
|
9.45*104 |
6.24*104 |
-9.23*10 |
6.53*104 |
0.9776 |
9.70*104 |
5.59*104 |
-1.18*102 |
5.88*104 |
0.9821 |
1st |
e |
|
1.14*105 |
8.01*104 |
-8.16*10 |
8.35*104 |
0.9849 |
1.15*105 |
7.44*104 |
-9.71*10 |
7.79*104 |
0.9875 |
2nd |
|
|
1.55*105 |
7.38*104 |
-1.48*102 |
7.84*104 |
0.9929 |
1.58*105 |
6.43*104 |
-1.71*102 |
6.89*104 |
0.9984 |
3rd |
|
|
2.56*105 |
4.74*104 |
-2.42*102 |
5.46*104 |
0.9924 |
1.43*105 |
3.29*104 |
-1.28*102 |
4.01*104 |
0.9891 |
4th |
|
|
1.07*105 |
2.49*104 |
-2.16*102 |
2.81*104 |
0.9860 |
7.33*104 |
1.74*104 |
-1.47*102 |
2.06*104 |
0.9844 |
1st |
f |
|
1.64*105 |
7.14*104 |
-1.60*102 |
7.62*104 |
0.9889 |
1.70*105 |
6.26*104 |
1.85*102 |
6.74*104 |
0.9948 |
2nd |
|
|
2.63*105 |
4.39*104 |
-2.48*102 |
5.12*104 |
0.9705 |
1.36*105 |
2.86*104 |
-1.21*102 |
3.59*104 |
0.9017 |
3rd |
In Table 5, the negative ΔS* values indicate that the activated complexes have more ordered structure than the reactants and the reactions were slower than normal [62]. The positive values of ΔG* indicate the non-spontaneous character for the reactions at the transition-state. The positive ΔH* values show endothermic transition-state reactions [63]. From the abnormal values of Z, the reactions of the complexes at the transition-state can be classified as a slow reaction [64].
SEM and XRD studies
The microstructure, surface morphology and chemical composition of VO(II), Zn(II), Pd(II), Au(III) and Pt(IV) with ATN complexes were studied using scanning electron microscopy. Typical scanning electron micrographs are shown in Fig 7a-f. The surface morphology of SEM micrograph reveals the well sintered nature of the complexes with variant grain sizes and shapes. The distribution of the grain size is homogeneous except for Zn-ATN VO-ATN complexes, Fig. 4b&c, where small-to-medium particles of nearly same size. Clear very small grains are obtained with agglomerates for Pt(IV) complex, Fig. 4f. The particle size distribution of the ATN complexes was evaluated and the average particle sizes of these were found to be 10-1000 μm, respectively. The x-ray powder diffraction patterns in the range of 4o< 2θ < 80o for the VO(II), Zn(II), Pd(II), Au(III) and Pt(IV) ATN complexes were carried in order to obtain an idea about the lattice dynamics of the resulted complexes. X-ray diffraction of these complexes were recorded and shown in Fig. 8a-f. The values of 2θ, d value (the volume average of the crystal dimension normal to diffracting plane), full width at half maximum (FWHM) of prominent intensity peak, relative intensity (%) and particle size of complexes were calculated. The maximum diffraction patterns of ATN, VO(II), Zn(II), Pd(II), Au(III) and Pt(IV) complexes exhibited at 2θ/d-value(Ǻ)= 6.4/13.79, 20.30/4.37, 19.83/4.48, 12.08/7.33, 38.15/2.36 and 14.50/6.17, respectively. The crystallite size could be estimated from XRD patterns by applying FWHM of the characteristic peaks using Deby-Scherrer equation 4 [65].
D= Kλ/βCosθ ……….. (equ. 4)
Where D is the particle size of the crystal gain, K is a constant (0.94 for Cu grid), λ is the x-ray wavelength (1.5406 Ǻ), θ is the Bragg diffraction angle and β is the integral peak width. The particle size was estimated according to the highest value of intensity compared with the other peaks. These data gave an impression that the particle size located within nano scale range.
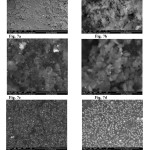 |
Fig7: SEM images of a-ATN, b-VO(II), c-Zn(II), d-Pd(II), e-Au(III) and f-Pt(IV) complexes |
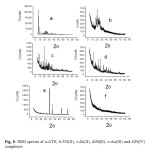 |
Fig8: XRD spectra of a-ATN, b-VO(II), c-Zn(II), d-Pd(II), e-Au(III) and f-Pt(IV) complexes |
The structures of the complexes of atenolol with VO(II), Zn(II), Pd(II), Au(III) and Pt(IV) ions have been confirmed form the elemental analyses, IR, 1H-NMR, molar conductance, UV-Vis, solid-reflectance, ESR, magnetic properties and thermal analysis data. Thus, from the IR spectra, it is concluded that ATN behaves as a monobasic bidentate ligand coordinated to the metal ions via the deprotonated –OH group and lone pair of electron on the nitrogen atom of secondary amine –NH group. From the molar conductance data, it is found that the complexes are non-electrolytes except for Au(III) and Pt(IV) complexes. Because of the above observations, four coordinated geometries are suggested for the investigated complexes. As a general conclusion, the investigated complexes structures can be given as shown in Figs. 9.
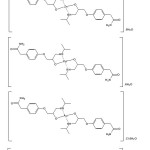 |
Fig9: Suggested structures of VO(II), Zn(II), Pd(II), Au(III) and Pt(IV) ATN complexes |
Antimicrobial studies
The results in-vitro of biocidal activities of the ATN ligand and its metal complexes clearly show that the compounds have both antibacterial and antifungal potency against the tested organisms. The complexes showed more activity than free ligand. Biological studies were observed in term antimicrobial activities of target complexes against gram-positive (Staphylococcus aureus) and gram-negative (Escherichia coli) and two strains of fungus (Aspergillus flavus and Candida albicans). Result from the agar disc diffusion tests for antimicrobial activities of target compounds are presented in Table 6. By comparison between the biological evaluation of ATN complexes with the standards Tetracycline as (antibacterial agent) and Amphotericin B as (antifungal agent), the results of highest-to-lowest effective can be summarized as follows;
1. Escherichia coli
Pd(II)=Pt(IV)> Zn(II)> Au(III) = VO(II) = ATN
2. Staphylococcus aureus
Pt(IV)> Pd(II) = Zn(II)> Au(III) =VO(II) = ATN
3. Aspergillus flavus
Pd(II)> Pt(IV) = Au(III) = Zn(II) = VO(II) = ATN
4. Candida albicans
Pd(II)> Pt(IV)> Au(III) = Zn(II) = VO(II) = ATN
A possible mode for increase in antibacterial activity may be considered in light of overtone’s concept [66] and Tweedy’s chelation theory [67]. On chelation, the polarity of the metal ion will be reduced to a greater extent due to the overlap of the ligand orbital and partial sharing of the positive charge of the metal ion with donor groups [68]. Chelation reduces the polarity of the metal ion considerably, mainly because of the partial sharing of its positive charge with donor groups and possible electron delocalization on the whole chelate ring. The lipids and polysaccharides are an
important constituent of cell wall and membranes, which are preferred for metal ion interaction. Chelation can considerably reduce the polarity of the metal ion, which in turn increases the lipophilic character of the chelate. Thus, the interaction between metal ion and the lipid is favored. This may lead to the breakdown of the permeability barrier of the cell, resulting in interference with normal cell processes. If the geometry and charge distribution around the molecule are incompatible with the geometry and charge distribution around the pores of the bacterial cell wall, penetration through the wall by the toxic agent cannot take place, and this will prevent toxic reaction within the pores. Except for these, some important factors that contribute to the activity are nature of the metal ion, nature of the ligand, coordinating sites, geometry of the complex, concentration, hydrophilicity, lipophilicity, and the presence of co-ligands. Certainly, steric and pharmokinetic factors also play a decisive role in deciding the potency of an
antimicrobial agent. The presence of lipophylic and polar substituents is expected to enhance antibacterial activity. Heterocyclic ligands with multifunctionality have a greater chance of interaction either with nucleoside bases (even after complexation with a metal ion) or with biologically essential metal ions present in the biosystem and can be promising candidates as bactericides since their tendency is to react with enzymatic functional groups to achieve a higher coordination number.
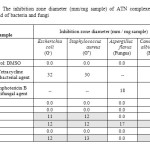 |
Table6: The inhibition zone diameter (mm/mg sample) of ATN complexes against some kind of bacteria and fungi |
Electrical conductivity studies
In semiconductor materials, conduction mechanisms depend on several parameters such as the degree of crystallinity, thermal excitation, impurities, lattice defects, non-stoichiometry and temperature. Various mechanisms have been proposed to describe the electrical conductivity. Mott and Gurney [69] have shown that for any intrinsic semi-conductor which contains impurity centers the conductivity can be written as the sum of two terms:
![]()
Where σ and are constants, E1 is the intrinsic activation energy and E2 is the activation energy needed to excite the carriers from the corresponding trap levels (valence band) to the conduction band. In Eq. (5) one term has large activation energy and a large coefficient, while the term due to the impurity has smaller activation energy and a much smaller coefficient. In this case, if ln σ is plotted against 1000/T (Arrhenius law i.e. thermally activated behavior) in the usual way, the curve will has a kink separating two lines. This case has been found for a crystal contains two kinds of impurity center with different activation energies. To study the temperature dependence of the conduction mechanism Arrhenius plots of lnσ versus 1000/T of VO(II), Pd(II), Au(III) and Pt(IV) ATN complexes are listed in Table 7. It has been mentioned that the value of the pre-exponential σ1 (or σ2) can be used to confirm whether the conduction was realized by the extended states or by the localized states [70]. The value of σ1 is in the range of 103-104 S/cm for the extended states conduction [71] and a smaller for the conduction by hopping between localized states. In the present work, as can be seen in Table 7, the values of σ1 are small; in the order of 10-11-10-12 S/cm, which indicates that the conduction takes place by hopping mechanism. This result is confirmed by small values of activation energy in region I, which was between 0.15 and 0.25 eV. Variable-range-hopping (VRH) mechanism was successful applied for samples with moderate concentrations of dopants [72]. Under all circumstances where N(E) is finite but states are localized near the Fermi energy, VRH theory is applied. By neglecting the variation of mobility of the electrons and holes in an electric field with temperature, then the VRH conductivity can be written in the form [73].
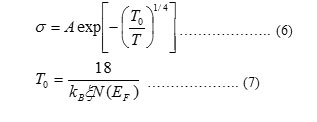
Where, ξ is the localization length and kB is Boltzmann’s constant.
By plotting ln σ against T-1/4, T0 can be calculated from the slope of the line for each complex. Taking a reasonable value for ξ such as 10-9 m [73], N(EF) can be calculated from Eq. (7). Then, it is now possible to estimate other hopping parameters such as hopping distance (R) and the average hopping energy (W) [73]:
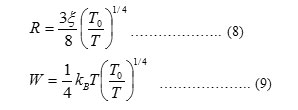
Where, in this theory the excitations are localized by pinning to the donor (ATN) or acceptor (metal (II, III and IV) ions and have discrete energies in a range that includes the Fermi energy. A good fit of the measured data is essential but not sufficient criterion for applicability of the VRH theory. The hopping parameters should satisfy the Mott requirements. The range of energies of the localized states is assumed to be > kT in the temperature range considered. At higher temperatures in this range hopping takes place between sites that are close together, but at lower temperatures it can take place only between states separated by low energies, even though the nearest such states may be some distance away. It clearly confirmed that there is Mott VRH conductivity in the temperature range between 300 and 374-392 K for VO(II), Pd(II), Au(III) and Pt(IV) ATN complexes. Density of states N(EF), the calculated value of hopping distance (R) at 300 K and the corresponding value of average hopping energy (W) were shown in Table 8.
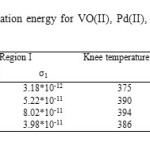 |
Table7: Variation of activation energy for VO(II), Pd(II), Au(III) and Pt(IV) ATN complexes |
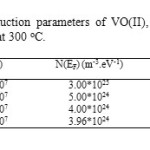 |
Table8: The hopping conduction parameters of VO(II), Pd(II), Au(III) and Pt(IV) ATN complexes at 300 oC. |
References
- N.P. Farrel, J. Williamson, D.J.M. Mclaren, Biochem. Pharmacol., 1984, 33(7), 961.
- B.C.L. Cheung, H.T. Tyler, J.M.L. Sun, P.R. Cullis, Biochim. Biophys. Acta, 1998, 1414 , 205.
- M. Mascini, G. Bagni, M.L.D. Pietro, M. Ravera, S. Baracco, D. Osella, Biometals., 2006, 19, 409.
- I. Kostova, Recent Pat Anti-Cancer Drug Discov., 2006, 1, 1.
- Z. Guo, P.J. Sadler, Advances in inorganic chemistry, vol. 49. San Diego: Academic Press; 2000. p. 183–306.
- J.E.F. Reynolds, Ed., Martindale The Extra Pharmacopoeia, 31st ed.; The Royal Pharmaceutical Society; London,1996. Martindales Pharmacopeia.
- R.T. Dorr, D.D. Von-Hoff DD, Drug Monographs In: Cancer Chemotheraphy Hand Book, 2nd Edn., Norwalk, Connecticut : Appleton & Lange, 1994; 227-236; M. Perry, The chemotherapy source book, Bleomycin sulfate product monograph. In: BC Cancer agency, cancer drug manual. Williams & Wilkins, Philadelphia, Lippinocott, 2002; pp.237-239.
- D. Chaterjee, A. Mitra, G.S. Dey, Ruthenium Polyaminocarboxylate Complexes: Prospects for their use as metallophar-maceuticals. Platinum Metals Review, 2006, 50(1), 2.
- I. Kostova, Platinum complexes as anticancer agents Recent patents on anticancer drug discovery, 2006, 1, 1.
- B. Rosenberg, L. Van Camp, J. Trosko, V. Mansour, Nature, 1969, 222, 385.
- A. Divsalar, A. Saboury, H. Mansouri-Torshizi, B. Hemmatnejad, Bull. Korean Chem. Soc., 2006, 27, 1801.
- H. Mansouri-Torshizi, M.I. Moghaddam, A. Divsalar, A. Saboury, Bioorg. Med. Chem., 2008, 16, 9616.
- M. Saeidfar, H. Masouri-Torshizi, G. Behbehani, A. Divsalar, A. Saboury, Bull. Korean Chem. Soc., 2009, 30, 1951.
- S. Butour, F. Wimmer, S. Wimmer, P. Castan, Chem. Biolog. Inter., 1997, 104, 165.
- M.J. McKeage, L. Maharaj, S.J. Berners-Price, Coord. Chem. Rev., 2002, 232, 127.
- S. Gromer, J. Wissing, D. Behne, K. Ashman, R.H. Schirmer, L. Flohé, K. Becker, Biochem. J., 1998, 332, 591.
- A. Butler A, C.J. Carrano, Coord. Chem. Rev., 1991, 109, 61.
- Hypertension etiology. Hypertension statistics 2010: http://www.healthstats.com/en/hypertension-statistics.
- P.R. Bontchev, H. Kadum, B. Evtimova, Ch. Nachev, E.Zhecheva, D. Mehandjiev, D. Ivanov, J. Inorg. Biochem., 1992, 48, 153.
- I. Pantcheva, P.R. Bontchev, Ch. Nachev, in: G. Ondrejovic, A. Sirota (Eds.), Progress in Coordination and Organometallic Chemistry, Slovac Technical University Press, Bratislava, 1997, 209–214.
- P.R. Bontchev, I. Pantcheva, B.B. Ivanova, D. Mehandjiev, Bulg. Chem. Commun. 1999, 31, 59.
- P.R. Bontchev, B.B. Ivanova, R.P. Bontchev, D.R. Mehandjiev, D.S. Ivanov, Polyhedron, 2000, 19, 1843.
- V. Getova, D. Mehandjiev, V. Skumryev, P.R. Bontchev, J. University Chem. Technology and Metallurgy, 2006, 41(2), 193.
- The Merck Index: An Encyclopedia of Chemicals, Drugs, and Biologicals, Merck & Co., Whitehouse Station, NJ, USA, 11th edition, 1989.
- R.N. Hegde, B.E. Kumara Swamy, B.S. Sherigara, S.T. Nandibewoor, Int. J. Electrochem. Sci., 2008, 3(3), 302.
- Indian Pharmacopoeia,Ministry ofHealth and FamilyWelfare, Government of India, New Delhi, India, 4th edition, 1996.
- British Pharmacopoeia, vol. I, Her Majesty’s Stationary Office, London, UK, 1988.
- M.A. Gotardo, R. Sequinel, L. Pezza, H.R. Pezza, Ecletica Quimica, 2008, 33(4), 7.
- D.D. Rao, N.V. Satyanarayana, S.S. Sait, Y.R. Reddy, K. Mukkanti, Chromatographia, 2009, 70(3-4), 647.
- K.A. Azzam, A.A. Elbashir, M.A. Elbashir, B. Saad, S.A. Hamid, Analyt. Lett., 2009, 42(10), 1458.
- M. Shamsipur, F. Jalali, S. Haghgoo, Analyt. Lett., 2005, 38(3), 401.
- L.L. Yu, J.C. Liu, H.K. Li, Yaowu Fenxi Zazhi, 2010, 32-30(3), 538.
- N. Bashir, S.W.H. Shah, M. Bangesh, R. Riazullah, J. Sci. Industrial Res., 2011, 70(1), 51.
- K. Basavaiah, U. Chandrashekar, P. Nagegowda, J. Serb. Chem. Soc., 2006, 71(5), 553.
- P.R. Bontchev, I.N. Pantcheva, G.P. Gochev, Trans. Met. Chem., 2000, 25, 196.
- P.R. Bontchev, I.N. Pantcheva, Trans. Met. Chem., 2002, 27, 1.
- A. Golcu, C. Yucesoy, S. Serin, Syn. React. Inorg. Met.-Org. Chem., 2004, 34(7), 1259.
- O. Cozar, L. Szabo, I.B. Cozar, N. Leopold, L. David, C. Cainap, V. Chis, J. Mol. Struct., 2011, 993, 357.
- A. Gölcü and P. Yavuz, Russ. J. Coord. Chem., 2008, 34(2), 106.
- F. Ulf, L. Eckehard, Ger. Offen. 1976, 2(542), 598.
- H. Ryuji, O. Kazuo, T. Motoaki, Y. Shozo, T. Keiko, H. Sadao, S. Takashi, CA 92: 41920t, Jpn. Kokai Tokyo Koho 1979, 79(14), 968.
- Z.I. Shramova, V.G. Voronin, V.A. Aleshina, M.G. Pleshakov, A.P. Zuev, A.S. Zaks, V.P. Kotegov, S.G. Gasanov, CA 99: 534w, USSR SU 1983, 992, 512.
- M. Ahmed, N. Jamadar, A.S. Shetty, Acta Chim. Pharm. Indica, 2012, 2(3), 134.
- G.W. Wilkinson, Comprehensive Coordination Chemistry; Pergamon Press: Oxford, 1987.
- R.A. Esteves de Castro, J. Canotilho, R.M. Barbosa, M. Ramos Silva, A. MatosBeja, J.A. Paixao, J.S. Redinha, Cryst. Growth Des., 2007, 7, 496.
- M. Picquart, L. Grajcar, M.H. Baron, Z. Abedinzadeh, Biospectroscopy 1999, 5, 328.
- O. Cozar, L. Szabo, I.B. Cozar, N. Leopold, L. David, C. CaØinap, V. Chis, J. Mol. Struct., 2011, 993, 357.
- A. Gölcü, P. Yavuz, Russ. J. Coord. Chem., 2008, 34(2), 106.
- P.R. Bontchev, I.N. Pantcheva, Trans. Met. Chem., 2002, 27, 1.
- P.R. Bontchev, I.N. Pantcheva, G.P. Gochev, Trans. Met. Chem., 2000, 25, 196.
- Seema, Monika Datta, Eur. Chem. Bull., 2013, 2(11), 942
- P.R. Bontchev, H.Kadum, B. Evtimova, C. Nachev, E. Zhecheva, D. Mehandjiev, D. Ivanov, J. Inorg. Biochem., 1992, 48, 153.
- D.L. Pavia, G.M. Lampman, G.S. Kriz, Introduction to Spectroscopy, 3rd ed., Harcourt College, Orlando, USA, 2001.
- S. Abass, H. Al-kahdimy, A.A.H. Al-Amiery, R.E. Wagie, H.A. Hussain, J. Chem. Pharm. Res., 2010, 2(3), 394.
- S. Demir, V.T. Yilmaz, B. Sariboga, O. Buyukgungor, J. Mrozinski, J. Inorg. Organomet. Polym., 2010, 20, 220.
- K. Nakamoto, Infrared and Raman Spectra of Inorganic and Coordination Compounds, Wiley and Sons, New York, 1978.
- A.B.P. Lever, Inorganic Electronic Spectroscopy; Elsevier: Amsterdam, The Netherlands, 1986, 385–392.
- M. Tsuchimoto, G. Hoshina, N. Yoshioka, H. Inoue, K. Nakajima, M. Kamishima, M. Kojima, S. Ohba, J. Solid State Chem., 2000, 153, 9.
- U. Valentina, B.S. Felicia, A. Victoria, A. Corina-Cristina, B. Mihaela, O. Rodica, M. Dana, Molecules, 2010, 15, 1578-1589.
- H.H. Horowitz, G. Metzger, Anal. Chem. 1963, 35, 1464.
- W. Coats, J. P. Redfern, Nature (London) 1964, 201, 68.
- A.A. Frost, R.G. Pearson,”kinetics and Mechanism”, Wiley, New York 1961.
- M.M. Hamada, A.-H.M. Shallaby, O. El-Shafai, A.A. El-Asmy, Trans. Met. Chem., 2006, 31, 522.
- P.K. Sharma, A.K. Sen, S.N. Dubey, Indian J. Chem., 1994, 6, 291.
- C.X. Quan, L.H. Bin, G.G. Bang, Mater. Chem. Phys. 2005, 91, 317.
- M.N. Patel, P.B. Pansuriya, P.A. Parmar, D.S. Gandhi1, Pharma. Chem., J., 2008, 42(12), 687.
- B.G. Tweedy, Phytopathology, 1964, 55, 910.
- P.K. Panchal, P.B. Pansuriya, M.N. Patel, J. Enz. Inhib. Med. Chem., 2006, 21, 203.
- N.F. Mott, R.W. Gurney, Electronic Processes in Ionic Crystals, Oxford University Press, 1950.
- M. Fadel, A. A. Nijim, H. T. El Shair, Vacuum 1995, 46, 1279.
- N. F. Mott, Philos. Mag. 1970, 22, 7.
- N.F. Mott, E.A. Davis, Electronic Properties in Non-Crystalline Materials, Oxford, 1971.
- B.I. Shklovskii, A.L. Efros, Electronic Properties of Doped Semiconductors, Springler, Berlin, 1984.


![]()


