Solvatochromism and preferential solvation in mixtures of Methanol with Ethanol, 1-Propanol and 1-Butanol
DOI : http://dx.doi.org/10.13005/ojc/300450
Download this article as:
![]()
The spectral shift of 4-nitroaniline was determined in pure methanol, ethanol, 1-propanol and 1-butanol and binary mixtures of methanol with other 1-alkanols at 25 ⁰C by UV-vis spectroscopy. The effect of specific and non-specific solute-solvent interactions on the spectral shift was investigated by using the linear solvation energy relationship concept. A multiple linear regression analysis was used to correlate the spectral shift with microscopic Kamlet-Taft parameters (a, b and p*) in pure solvents. Results indicate that the spectral shift is highly related with the specific solute-solvent interactions. In binary mixtures, a nonideal behavior of spectral shift was observed respective to the analytical mole fraction of alcohols; indicating preferential solvation. The spectral shifts were fitted to a known preferential solvation model named solvent exchange model to calculate the preferential solvation parameters. The preference of solute to be solvated by one of the solvating species relative to others was explained in terms of solvent-solvent and solute-solvent interactions.
KEYWORDS:Solvatochromism; Preferential solvation; 1-alkanols; Uv-vis spectroscopy
Introduction
Solvatochromism is a phenomenon describing the spectral shift of a solute induced by a change in the solvent polarity, and provides valuable information about interactions that occur in the solvation shell of solute [1-4]. The electronic transition energy of the solute in maximum absorption, ET, is a function of all types of interactions between solute and solvent components. These interaction may be classified into two types including specific interactions such as hydrogen bonding and electron donor acceptor interactions, and nonspecific interactions such as polarity–polarizability interactions [2, 3, 5-7]. The change in position of the absorption maxima and therefore ET values upon changing the solvent composition can reveal the type of the solute-solvent as well as solvent-solvent interactions occurring in the solvent mixtures. Also, ET parameters of a solute can be used in order to achieve information about the preferential solvation phenomena in the mixed solvent.
Various models both theoretical and experimental methods have been developed to the problem of preferential solvation in the literature. Among the theoretical models, models such as the quasi lattice-quasi chemical theory, the Kirkwood-Buff theory, the dielectric enrichment developed by Suppan, the competitive preferential solvation theory of Nagy, and the stepwise solvent exchange model of Covington has been used successfully in many of papers [8-13]. Bosch and Roses have been developed the solvent exchange model to consider the preferential solvation experimentally [14-16]. This model is a modified version of the stepwise solvent exchange model introduced by Connors which gives equations that correlate ET values of a solute with the solvent composition [17]. In this model, competition between solvent species to solvate the solute is explained by some exchange equilibria in the solvation shell of solute. For each exchange reaction an equilibrium constant, known as preferential solvation parameter, is introduced, which relates the mole fraction of solvents around the solute to that in the bulk mixture. Also, the formation of associating species is postulated from solvent-solvent interaction in the solvation shell. Recently, this model has been modified by consideration of the associating species formation explicitly in both solvation shell and bulk mixture [18-20].
Experimental
Chemicals
All pure alcoholic solvents including methanol, ethanol, 1-propanol and 1-butanol were supplied as analytical reagent grade from Merck. The solvatochromic probe 4-nitroaniline was obtained from Sigma.
Measurements
Spectrophotometric measurements were performed on a UV-vis Shimadzu 2100 spectrophotometer with a Pentium 4 computer and using thermostated matched 10 mm quartz cells at 298.15 K. All aqueous binary mixtures were carefully prepared by weighing at the required molar ratio with an electrical balance accurate to ± 0.1 mg. Stock solution of 4-nitroaniline was prepared in ethanol. 50 µL of the stock solution was transferred to 5 mL glass volumetric tubes. After the evaporation of the ethanol under reduced pressure, 3.5 mL of the pure or the binary solvent was pipetted into the tubes and the mixtures were sonicated to a clear and homogenous solution and then kept in the dark. The final concentration of the solute in the tubes was obtained approximately at 10 µM. To exclude oxygen from the system, a stream of purified nitrogen gas was passed through solutions prior to each spectrophotometric measurement. The electronic absorption spectra were recorded over the wavelength range of (300-700) nm at a rate of 140 nm min-1 with a slit width of 2 nm. At least three replicate spectrophotometric measurements were done for each solution with an accuracy of ± 0.05 nm. The wavenumber of the maximum absorbance, umax, in a particular solvent mixture was calculated from the first derivative of the spectrum data.
Result and Discution
The wavelength of the maximum absorbance, nmax, in a particular solvent was introduced into Eq. 1 to calculate the molar electronic transition energies, ET values.
ET(kcal·mol-1) = hcNAnmax(cm-1) = 2.85915 nmax(cm-1) (1)
where h, c and NA are Planck’s constant, the velocity of light and Avogadro’s number, respectively. The values of the ET as a function of mole fraction of methanol are presented in Tables 1-3 and Figs. 1-3. To treatment of solvent effect in pure solvents, the concept of the linear solvation energy relationships (LSER) was used. LSER has been established by Kamlet, Abboud and Taft, in which each of nonspecific and specific interactions have a linear contribution to the total solvation energy of solvent dependent phenomena [21]. In general form, LSER takes the form of Eq. 2.
ET = A0 + aa + bβ + pπ* (2)
 |
Table1: Density and maximum wavenumber and ET of 4-nitroaniline in binary mixtures of methanol with ethanol at 25 ⁰C Click here to View table |
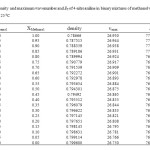 |
Table2: Density and maximum wavenumber and ET of 4-nitroaniline in binary mixtures of methanol with 1-propanol at 25 ⁰C Click here to View table |
The a, β and π* are the Kamlet and Taft solavatochromic parameters (KAT) which define the hydrogen-bond donor acidity, hydrogen-bond acceptor basicity and dipolarity/polarizability of solvents respectively [22-24]. The A0, a, b, and p are regression coefficients; A0 is intercept whereas a, b and p quantify the sensitivity of ET values to the acidity, basicity and dipolarity/polarizability of solvent respectively. The number of parameters in Eq. 2 depends physically on the nature of solute and solvent and the significance of the solute-solvent interactions. The value of a, β and π* for pure 1-alkanols are presented in Table 3. In order to explain the obtained ET values through the KAT solvent parameters, the protonation constants were correlated with solvent properties by means of multiple linear regressions analysis in Microsoft EXCEL program [25]. The F-statistic values were used to assess which of the LSER equations is statistically optimum model. The best predictive mathematical equation in the fitted models was obtained to be Eq. 3, which had the highest F-statistic and smallest standard deviation values.
ET = 73.26(0.46) + 6.34(0.86)π* ; r2 = 0.96, F = 53.93 (3)
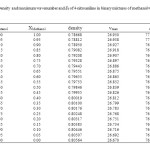 |
Table3: Density and maximum wavenumber and ET of 4-nitroaniline in binary mixtures of methanol with 1-butanol at 25 ⁰C Click here to View table |
F and r2 are squared correlation coefficient and F-statistic values respectively. The number in bracket shows the standard deviation of each regression coefficient. This result indicates that the spectral shift is mainly dependent on the nonspecific electrostatic solvent-solute interactions in pure 1-alkanol solvents. The regression coefficient of π* parameter in correlated model has a positive sign which means an increase in the polarity of the media increases ET values.
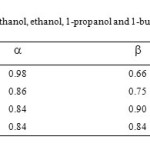 |
Table4: The a, b and p* for pure methanol, ethanol, 1-propanol and 1-butanol at 25 ⁰C. Click here to View table |
As shown in Figs. 1-3, the ET value of 4-nitroaniline has a nonlinear behavior upon changing the mole fraction of methanol in all the three binary mixtures. The ideal solvation behavior is presented by dashed lines. A deviation from linearity is evident in all binary mixtures, resulting in a preferential solvation of 4-nitroaniline by one of the components in the mixtures.
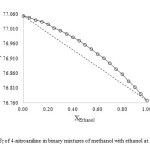 |
Fig1: ET of 4-nitroaniline in binary mixtures of methanol with ethanol at 25 ⁰C Click here to View figure |
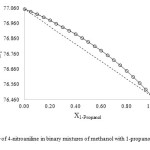 |
Fig2: ET of 4-nitroaniline in binary mixtures of methanol with 1-propanol at 25 ⁰C Click here to View figure |
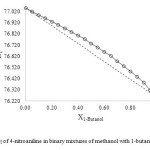 |
Fig3: ET of 4-nitroaniline in binary mixtures of methanol with 1-butanol at 25 ⁰C Click here to View figure |
To explain in quantitative detail, the variation of the ET value was treated using of a modified solvent exchange model introduced by El-Seoud to calculate the parameters of preferential solvation [5, 18-20]. According to this model, for a binary mixture including two solvents S1, S2 and solvatochromic indicator I, the following equilibria may be written for the exchange of solvents in solvation shell of solute.
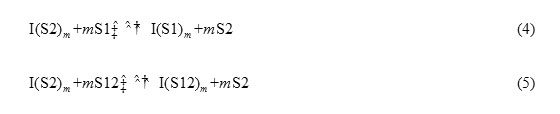
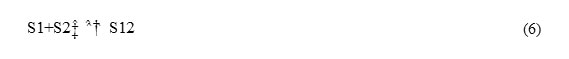
where I(S1), I(S2) and I(S12) show the solute solvated by S1, S2 and S12, respectively. The parameter m presents the number of exchangeable solvent molecules in the solvation shell, which affects the solvatochromic properties of the solute. Solvating species S12 shows the associating species which are formed by solvent-solvent interactions. The most striking feature of El-Seoud model is that the formation of S12 explicitly is considered in bulk mixtures according to the following equation as the ratio of 1:1.
The constants of the exchange equilibria in Eqs. 4 and 5 are defined by the preferential solvation parameters (f1/2, f12/2 and f12/1) which relate the mole fraction of solvating species in the solvation shell to that of the same species in bulk.
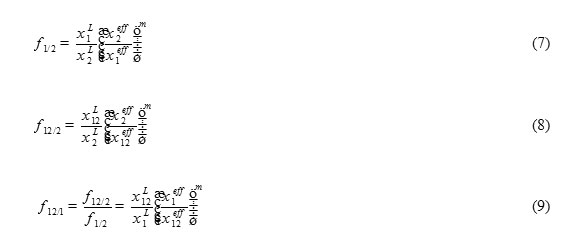
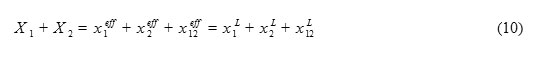
In fact, fi/j quantifies the tendency of the solute to be solvated by solvent i in the preference of solvent j; the fi/j > 1 means that the solute is more selectively solvated by solvent i relative to solvent j, and vice versa. The and are the local and effective mole fractions of solvating species of i in the solvation shell and bulk mixture respectively. Effective mole fractions are related, through the association constant (Kassoc) of Eq. 6, to the analytical mole fraction of pure solvents (X1 and X2). It is clear that the sum of all mole fractions in each region must be equal to unity.
The observed ET value depends directly on the local composition and, as given in Eq. 11, is a weighted average of ET values corresponding to each of solvating species present in the solvation shell.
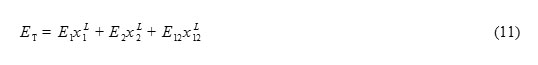
Where E1, E2 and E12 are ET values if solute is solvated by pure S1, S2 and S12 respectively. Introducing Eqs. 7, 8 and 10 into Eq. 11 and rearranging in terms of effective mole fractions gives Eq. 12.
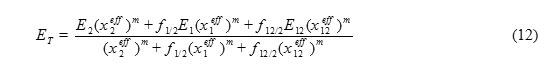
In this work, S1 and S2 represent pure methanol and other 1-alkanol solvents respectively. The value of Kassoc is necessary for calculation of effective mole fractions in each binary mixture. The Kassoc can be calculated from nonideal dependency of some physical properties of binary mixtures, such as density, on their bulk composition [19, 20]. In this work, the Kassoc for each binary mixture, was determined by manipulation of density data. The values of density for each binary mixture were extracted from the literature and presented in Tables 1-3 [26]. The Kassoc for Eq. 6 is given by following
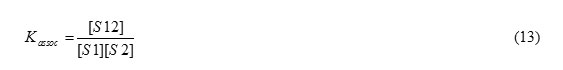
Based on mass balance, the effective concentration of S1, [S1], and S2, [S2], are given by
[S1]tot = [S1] + [S12] (14) [S2]tot = [S2] + [S12] (15)Therefore, [S12] can be calculated by
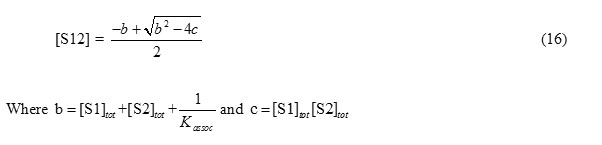
In a mixture of S1, S2 and S12, density may be expressed by
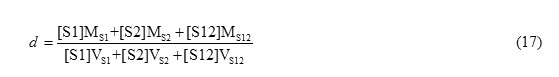
Where Mi and Vi stands for molecular mass and molar volume of i respectively. Literature data of density were fitted to Eq. 17 by nonlinear curve fitting in OriginPro 8.5 program. The calculated association constant for formation of S12 in binary mixture of methanol with ethanol, 1-propanol and 1-butanol is 0.058, 0.090 and 0.029 M-1 respectively. The experimental ET values were fitted to Eq. 12 by a nonlinear regression procedure performed in OriginPro 8.5; Results are shown in Table 5.
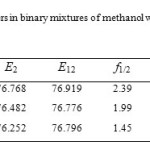 |
Table5: Preferential solvation parameters in binary mixtures of methanol with ethanol, 1-propanol and 1-butanol at 25 ⁰C. Click here to View table |
The preferential solvation parameter f1/2 is higher than unity in all binary mixtures, indicating the solute is selectively solvated by methanol respective to the cosolvent in the mixture. Since the extent of f1/2 decreases from ethanol to 1-butanol, the electrostatic interaction has little contribution to the direction of this preferential solvation parameter in these binary mixtures. 4-nitroaniline is a high hydrogen bonding donor substrate. Therefore from ethanol to 1-butanol, by increasing of b, the f1/2 decreases. The preferential solvation parameter f12/2 is higher than unity in all binary mixtures, indicating that 4-nitroaniline is more efficiently surrounded by S12 as compared to S2. Therefore, in competition between S2 and S12, the solute more favorably interact with S12 due to a stronger interaction, resulting in the f12/2 > 1.
In all binary mixtures, f12/2 is greater than f1/2. Therefore result indicate that in binary mixture of methanol with ethanol, 1-propanol and 1-butanol, the affinity for solvation of 4-nitroaniline is as S12 > S1 > S2.
Conclusion
The solvatochromism of 4-nitroaniline was studied by UV-vis spectroscopy at 25 ⁰C. Results of LSER in pure alcohols indicate that the spectral shift of 4-nitroaniline is strongly affected by nonspecific interactions. The association constant of solvent-solvent interaction was calculated from density data in each binary mixtures. Solvent exchange model was successfully fitted to the observed ET values by considering effective mole fractions of solvating species. The preferential solvation parameters were calculated from the model. The results indicate that in competition between S1 and S2, former prefer to solvate 4-niroaniline. Also according to f12/2 > 1, 4-nitroaniline prefer to be surrounded by S12 respective to S2. The value of f12/2 is greater than f1/2 in all cases; indicating S12 has highest affinity to solvate 4-nitroaniline.
Acknowledgment
The authors gratefully acknowledge the financial and other support of this research, provided by the Islamic Azad University, Islamshahr Branch,Tehran,Iran.
References
- Farajtabar, A.; Jaberi, F.; Gharib, F.; Spectrochim. Acta, Part A. 2011, 83, 213.
- Reichardt, C. Chem. Rev. 1994, 94, 2319.
- Reichardt, C. Wiley-VCH, Weinheim, Germany. 2004.
- Maitra, A.; Bagchi, S. J. Mol. Liq. 2008,137, 131.
- El Seoud, O.A,Pure Appl. Chem. 2007, 79, 1135.
- Umadevi, M.; Suvitha, A.; Latha, K.; Rajkumar, B.J.M.; Ramakrishnan, V. Spectrochim. Acta, Part A .2007, 67, 910.
- Giusti, L.A.; Marini, V.G.; Machado, V.G.J. Mol. Liq. 2009, 150, 9.
- Raveendran, G.; Kumari, SN,; Orient.J. Chem, 2012, 28(3), 1371-1378.
- Ben-Naim, A. J. Phys. Chem. 1989, 93, 3809.
- Marcus, Y. J. Chem. Soc., Faraday Trans. 1988, 1, 84 ,1465.
- Marcus, Y.Aust. J. Chem. 1983, 36, 1719.
- Suppan, P. J. Chem. Soc., Faraday Trans. 1987, 1, 83, 495.
- Nagy, O.B.; Wa Muanda, M.; Nagy, J.B. J. Phys. Chem. 1979, 83, 1961.
- Covington, A.K.; Newman, K.E. Pure Appl. Chem. 1979, 51, 2041.
- Buhvestov, U. ; Rived, F. ; Ràfols, C.; Bosch, E. ; Rosés, M. J. Phys. Org. Chem. 1998, 11, 185.
- Hisaindee, S.; Graham, J.; Rauf, M.A.; Nawaz, M.; J. Mol. Liq. 2012, 169, 48.
- Moita, M.L.; Teodoro, R.A.; Pinheiro, L.M. J. Mol. Liq. 2007, 136, 15.
- Skwierczynski, R.D.; Connors, K.A. J. Chem. Soc., Perkin Trans. 1994, 2, 467.
- Tada, E.B.; Silva, P.L.; Tavares, C. ; El Seoud, O.A. J. Phys. Org. Chem. 2005,18, 398.
- Tada, E.B.; Silva, P.L.; El Seoud, O.A. J. Phys. Org. Chem. 2003,16, 691.
- Bastos, E.L.; Silva, P.L.; El Seoud, O.A. J. Phys. Chem. A. 2006, 110, 10287.
- Taft, R.; Abboud, J.L.; Kamlet, M. ; Abraham, M. J. Solution Chem. 1985,14, 153.
- Kamlet, M.J.; Abboud, J.L.; Taft, R.W. J. Am. Chem. Soc. 1977, 99, 6027.
- Taft, R.W.; Kamlet, M.J. J. Am. Chem. Soc. 1976, 98, 2886.
- Kamlet, M.J.; Taft, R.W. J. Am. Chem. Soc. 1976, 98, 377.
- Billo, E.J. Excel for Chemists: A Comprehensive Guide. Wiley, Weinheim, Germany, 2001.
- Boruń, A.; Żurada, M.; Bald, A. J. Therm. Anal. Calorim. 2010, 100, 70,7.


![]()


