Preparation of TiO2/SiO2 nanocomposite with non-ionic surfactants via sol-gel process and their photocatalytic study
Ruchi Nandanwar1, Purnima Singh1, Fazil F. Syed2 and Fozia Z. Haque3*
1Department of Physics, Sarojini Naidu Govt. Girls P.G. (Autonomous) College, Barkatullah University,Bhopal 462016, Madhya Pradesh, India
2Department of Chemistry, Mumbai University, Mumbai 400 032, Maharashtra, India
3Department of Physics, Maulana Azad National Institute of Technology, Bhopal, Madhya Pradesh, India,
DOI : http://dx.doi.org/10.13005/ojc/300417
Article Received on :
Article Accepted on :
Article Published : 16 Dec 2014
The study presents that the TiO2/SiO2 nanocomposite particles were prepared from using TTIP precursor for titania and TEOS precursor for silica, by using a sol-gel method at low temperature in acidic pH with various templates: poly(ethylene glycol) (PEG) and Triton X-100 (TX-100). The properties of resulting Ti/Si nanocomposites materials were characterized by X-ray diffraction (XRD), Scanning Electron Microscopy (SEM), UV-Vis absorption spectroscopy; Photo-Luminescence spectra and Fourier transform infrared (FTIR) techniques. The results show that the TS cores were uniformly coated by Triton X-100 exhibited regular morphology and having spherical nanoparticles. XRD result showed that TS:TX having smaller crystallite size than the TS:TX nanocomposite particles and in both samples only include anatase phase. The UV–Vis spectrum of as-synthesized samples shows absorption in the visible range. The PL emission intensity of TS:TX nanocomposite was slightly decreased compared with TS:PEG nanocomposite due to decrease in recombination rate. From FTIR results metal oxide stretching was confirmed in both the samples. The photocatalytic activity of samples was tested for degradation of methylene blue (MB) solutions. The results clearly showed that TS coated Triton X-100 sample exhibited higher activity than that of TS:PEG under UV irradiation, due to the low recombination rate of photo-generated electrons and holes.
KEYWORDS:TiO2/SiO2; nanocomposite; sol-gel method; non-ionic surfactants; morphology; optical properties; XRD; FT-IR
Download this article as:| Copy the following to cite this article: Nandanwar R, Singh P, Syed F. F, Haque F. Z. Preparation of TiO2/SiO2 nanocomposite with non-ionic surfactants via sol-gel process and their photocatalytic study. Orient J Chem 2014;30(4). |
| Copy the following to cite this URL: Nandanwar R, Singh P, Syed F. F, Haque F. Z. Preparation of TiO2/SiO2 nanocomposite with non-ionic surfactants via sol-gel process and their photocatalytic study. Available from: http://www.orientjchem.org/?p=5890 |
Introduction
Titanium dioxide nanomaterials that have been intensively studied because of their unique properties, various uses [1, 2] and versatile applications, for example, in photocatalysis, optoelectronic devices, environmental purification, photo-eletrochemical solar energy conversion and optical coating [3, 4]. There are several techniques for synthesizing titania nanoparticles through controlled nucleation and growth processes in dilute Ti (IV) solutions [5-7]. Among them the sol-gel process is one of the most convenient ways to synthesize various metal oxides due to some advantages, such as homogeneity at molecular level, a wide range of a precursor selection, control over microstructure, low demands upon reagent purity, possibility of a fine adjustment of the end product properties and low processing temperature [8].
TiO2 crystallizes in three types: anatase, rutile and brookite. Among the three above, crystalline titania, especially its anatase phase is an n-type semiconductor [9, 10] has most stable modification for small particle samples with high surface areas and owing to higher photocatalytic activity is commonly used for photocatalysis [11]. Most researchers have paid greater attention to TiO2 anatase phase in photocatalytic reactions and photo-electrochemical cell and its potential application in degradation of various environmental pollutants under ultraviolet (UV) irradiation [12] and in both gaseous and liquid phases because of its strong oxidizing power, non-toxicity and long-term photo-stability [13, 14]. For more than a decade, studies have mainly concentrated on the suspension of TiO2 fine powder because of its higher photocatalytic activity and itself photo-degrade pollutant molecules when radiated with UV radiation compared to TiO2 thin films [15]. TiO2 powders possess interesting optical, dielectrical, and catalytical properties, which results in industrial applications [16, 18]. In recent years great efforts have been devoted to the study of TiO2 materials by sol-gel photocatalytic degradation of organic and inorganic contaminants of water and air [19-20]. The synthesis of TiO2 by the sol-gel method has proven to be a very useful tool for photo-induced molecular reactions to take place on a titanium dioxide surface [21]. Titania has band gap energy of around 3.2 eV and is therefore a UV absorber. When TiO2 is subjected to UV light (λ > 385 nm), an electron/hole pair (eCB−/hVB+) is generated. Photo-catalytic reactions take place primarily on the surface of TiO2, where the photo-generated electrons and holes are trapped. In general, good crystalline materials with optimum surface area are ideal candidates as photocatalysts.
Recently, titania-silica composite materials have been obtained by sol–gel method due to its possible capability in controlling the textural and surface properties of the composite, to offer unique advantages for the preparation of such highly dispersed tetrahedrally coordinated and transparent photocatalysts and especially to be applied for coating material [22]. This sol-gel process provides to synthesis mesoporous TiO2/SiO2 composite materials showed to enhanced stability, textural properties and enhanced surface area which increases the photo current in the field dependent photoconductivity and useful for applications as catalysts and solar-cells [23, 24]. SiO2 has high thermal stability, good carriers properties and excellent mechanical strength has been widely used in the material synthesis field which adsorbing organics and transfers those adsorbed compounds to active sites on TiO2 and also benefits to the dispersion of the TiO2 particles [24-27]. The addition of SiO2 on TiO2 matrix suppresses the crystal growth of TiO2 and enhanced the photocatalytic performance [28]. Abdolreza Nilchi [29] et.al reported that the sol-gel produced TiO2/SiO2 nanocomposite has good photocatalytic properties due to its anatase phase, existence of tetrahedral coordination of TiO2 in the SiO2 matrix and very large surface area. Kim et.al, [30] proposed two models for titanium dioxide activation in the presence of silicon dioxide. There are two types of interaction between TiO2 and SiO2: physically mixed and chemically bonded [31]. Shaozheng Hu et.al studied the SiO2-coated TiO2 composite materials with enhanced photocatalytic activity under UV light was prepared by a simple catalytic hydrolysis method [32].
There is a growing interest in the development of nanocomposites consisting of organic polymers and titania or amorphous silica nanoparticles. Mosurkal et.al view nanocomposites of siloxane copolymers and nano-TiO2 as ‘environmentally safe’ [33]. The textural properties of TiO2-SiO2 composites synthesized by sol-gel process were successively enhanced using surfactant to enhance the photocatalytic properties [34]. The TiO2-SiO2 coatings were also prepared with poly-ethylene-glycol (PEG) to lower the sol-gel processing temperature used to examine bio-compatibility of new biomaterials and derived implant coatings [35]. The formation of nanocomposites by the sol–gel method has been reported to be strongly dependent on the choice of a solvent and a foreign stabilizing surfactant. To synthesize TiO2-SiO2 nanocomposites at room temperature with the addition of polymer (PVA) could effectively suppress the particle growth and improve the stability of TS hydrosols [36]. Kimura Isao et.al reported to the preparation of composite microspheres with addition of oil-soluble surfactant to using a simple sol-gel in reverse suspension were suspended in dye solution under ultraviolet irradiation and examined the possibility of applying to wastewater treatment [37].
In this work, a novel sol–gel method was employed for the synthesis of TiO2-SiO2 nanocomposite particles with non-ionic surfactants polyethylene glycol (PEG) and polyethylene glycol tert-octylphenyl ether (Triton X-100) at low temperature. Photocatalytic degradation activities of the synthesized particles were studied using Methylene Blue (MB) as a model organic compound under UV light irradiation.
Experimental
Materials
All the chemical reagents used in this experiment were acquired from commercial sources and were used analytical grade purity. In this synthesis procedure, we use tetraethoxysilane (TEOS) (99.9 %, Sigma Aldrich) as a precursor material of SiO2 and titanium tetra-isopropoxide (TTIP) (99.9 %, Sigma Aldrich) as a precursor material of TiO2. And, using concentrated hydrochloric-acid (HCl) (99.9 %, Merck) as a catalyst and solvents absolute ethanol (99.9 %, Merck), polyethylene glycol (PEG) (Mw= 570 gram/mole), and polyethylene glycol tert-octylphenyl ether (Triton X-100) (Mw= 646.87 gram/mole) (99.9 %, Merck) were used without any further purification. Methylene Blue (MB) (Sigma Aldrich) was used a model organic compound for Photocatalytic study. Deionised water was used throughout the experiments. All the solutions were prepared using de-ionized water. The synthesis was carried out in the conditions of continuous stirring at the temperature of 60oC. The stirring was conducted using an electromagnetic stirrer with a stirring speed of ca. 1100 rpm.
Synthesis of Titania/Silica with Surfactants Composite
In the synthesis of TiO2/SiO2 composite particles were prepared according to the sol-gel method. Titanium tetra-isopropoxide (TTIP) (1 mole) prepared by dissolving in solvent ethanol (10 ml), and deionized water (35 ml) mixture was stirred for 10 min, pH range of 2.5. And, then added, catalyst hydrochloric-acid (HCl) (1 mole) drop-wise into the above mixture and magnetically stirred for 30 min. at temperature 60oC, in the pH range 1, to become a yellowish homogeneous transparent solution. Then, 1 mole of silica precursor material tetraethoxysilane (TEOS) was slowly added in the titania sol phase and the mixture was stirred for 1 hour at 60 °C. The surfactant (0.1 mole) was added to the above mixture was stirred for 1 hour at temperature 60oC. A white lump free paste was formed. The resulting pastes were dried at room temperature during 1 month. Finally, the product was grinded into a powder to obtain a resulting fine white powder and used for further material characterization. For convenience, the abbreviations TiO2/SiO2 prepared with surfactant PEG is denoted as TS:PEG and with surfactant Triton X-100 is denoted as TS:TX respectively.
Characterization
The prepared titania-silica composite nanoparticles were characterized for surface morphology was studied using scanning electron microscopy (SEM) (Model JEOL- JSM- 6390). Powder X-ray diffraction measurement was carried out using Bruker D8 Advance X-ray diffract-metre. The X-rays were produced using a sealed tube and the wavelength X-ray was 0.154 nm (CuK-alpha). The X-rays were detected using a fast counting detector based on Silicon strip technology (Bruker LynxEye detector). The optical properties studied using UV–Visible absorption spectra were recorded with a Carry 5000 UV-Vis-NIR spectrometer, and emission spectra were observed by photoluminescence spectroscopy (F-7000, Hitachi spectrophotometer) with excitation wavelength (λex) = 350nm using xenon lamp as source at room temperature.. The FTIR spectra were measured on a Bruker Model-Vertex 70 Spectroscopy with a wave number range of 1000 to 4000 cm-1.
Measurement of Photocatalytic Activity
The photocatalytic performances of the synthesized composite particles were studied by the degradation experiments using Methylene Blue (MB) dye as a model compound under ultraviolet light irradiation. An UV Xenon lamp with 125 W was used as UV source. Photocatalysis experiments were performed in a self designed photo-oxidation reactor which is a dark black box. The test materials was kept in a glass beaker covered with aluminum foil to prevent light from other sources from entering the beaker. This ensured that all light came from one direct source. The lamp was fitted on the top of the reactor. The distance between lamp and photocatalysis system was about 1 cm. Prior to illumination, a suspension containing 0.05g of powder catalyst was added 1 ml L-1 MB (10-4) aqueous solution was mixed in a glass beaker and magnetically stirred in dark for 30 min., to attain adsorption equilibrium and the solution was exposed to UV-visible irradiation. The experiment was performed at room temperature. At regular intervals, 5 ml solution were taken from the reactor and centrifuged to remove the photocatalyst before analysis by UV-visible spectrometer at 664 nm corresponding to maximum absorption wavelength (λmax) of MB.
Result and discussion
SEM Characterization
The study of morphologies of the powder samples of Ti/Si nano composite with surfactants PEG and Tritonx-100 was observed with SEM as shown in Fig. 1 (a) (b).
As it can be seen in Fig. 1 (a), the TS:PEG nanocomposite consists of irregular morphology due to the agglomeration of primary particles, which may cause the surface to be non-uniform and ill-defined. In Fig. 1 (b), the accumulation of particle indicates packed and dense structure. Whereas TS:TX nanocomposite particles exhibited regular morphology since the TS cores were uniformly coated by Triton X-100 and having well-structured granular nano-surface with clear interstices between the particles/aggregates. The TS:TX nanocomposite powder particles show the formation of uniform spherical and narrowly dispersed particles.
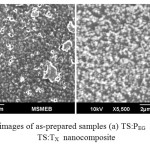 |
Fig1: SEM images of as-prepared samples (a) TS:PEG nanocomposite, and (b) TS:TX nanocomposite Click here to View figure |
X-ray Diffraction Analysis
The XRD diffraction patterns of sol–gel-derived nano TS:PEG and TS:TX composites were carried out on powder form are shown in Fig. 2. The crystallite type of the TS nanocomposite particles was the pure anatase. In the diffraction pattern, it is clearly assigned that the peaks of SiO2 are not observed because they are mainly amorphous in nature, and the diffractogram consist strongest diffraction peaks of TiO2 in anatase phase (with the reference pattern (JCPDS 21-1272) of TiO2).
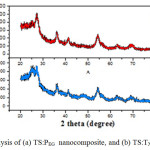 |
Fig2: XRD analysis of (a) TS:PEG nanocomposite, and (b) TS:TX nanocomposite
|
The powder samples showed the crystalline pattern and the observed d101 lines match the reported values for the anatase phase. The average crystallite size of the samples was determined from Scherrer’s equation [38] using the (101) reflections of the anatase phase assuming spherical particles. Using the Scherrer’s formula, D = K λ/ β cosθ, an estimate of the grain size (D) from the broadening of the main (101) anatase peak can be done, K is a constant depend on the crystallite shape (0.9), λ is the X-ray wavelength (in this case, λ = 1.5418 Å for Cu-Kα radiation), β is the full width at half maxima (FWHM) of the diffraction peaks (radian) and θ is the Bragg’s angle and also the unit cell volume as correlated to reference pattern as shown in Table 1.
The observed d101 anatase line for TS:TX sample is very broader and weaker than the TS:PEG sample. The broadening of the XRD peaks indicates that the particles are of very small crystallite size in nature [39]. The introduction of SiO2 can reduce the growth rate of anatase titania nanoparticle. The TS:TX nanoparticles growth is retarded due to the Si atom with Triton X-100, this agree with the small value of grain size and effectively increase the stability of anatase TiO2. The result illustrates that Triton X-100 template induces the formation of small and uniform anatase crystallite sizes. The diffraction peak intensity of the TS:TX composite material shows the high crystallinity than nano TS:PEG composite nanoparticle, resulting in production of more charge carriers and high surface area for photocatalytic activity. It is obviously shown that the TS:TX prepared powder sample is completely crystalline than TS:PEG and entirely consists of anatase phase.
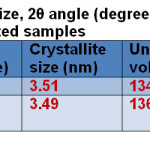 |
Table1: Crystallite size, 2θ angle (degree), unit cell volume and optical band gap of the as-synthesized samples Click here to View table |
UV-Visible Absorption Spectra
The UV–Visible absorption spectra of as-synthesized samples show in Fig. 3. It can be seen that the TS:PEG nanocomposites exhibited an absorption edge at 352 nm in Fig. 3a. The absorption edge of TS:TX nanocomposite slightly falls into the visible region at the wavelength of 400 nm as shown in Fig. 3b. The optical band gap can be calculated by the equation: Eg =1239.8/ λ where Eg is the band gap (eV) and λ (nm) is the wavelength of the absorption edge in the spectrum. The optical band gaps Eg for both the synthesized samples were estimated and tabulated in Table 1.
Both the as-synthesized samples show slightly similar absorption pattern, in which the TS:TX nanocomposite shows better absorbance in visible range compared to TS:PEG nano composite particles. Furthermore, due to the higher dispersity and the coverage of SiO2 on TiO2 surface restrained the absorption of UV light irradiation. In addition, the absorption spectra of the TS:TX sample shows stronger absorbance than TS:PEG nanocomposite particle under UV irradiation, indicating that TS:TX could be a promising approach for increasing the catalytic activity.
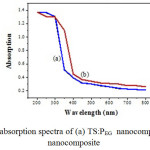 |
Fig3: UV-Visible absorption spectra of (a) TS:PEG nanocomposite, and (b) TS:TX nanocomposite
|
PL Spectroscopy Analysis
A photo luminescence spectrum in emission mode is done in the full spectrum range from 200 nm to 700 nm. Fig. 4 shows the PL emission spectrum of TS:PEG and TS:TX nanocomposite samples at the excitation wavelength of 350 nm.
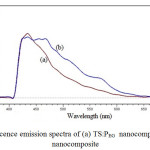 |
Fig4: Photoluminescence emission spectra of (a) TS:PEG nanocomposite, and (b) TS:TX nanocomposite Click here to View figure |
There is a wide photoluminescence band in the wavelength range of 410-600 nm. In whole emission spectra the peak is observed at near 434 nm for TS:PEG composite and 434.6 nm for TS:TX composite. The PL intensity of TS:TX nanocomposite was decreased compared with TS:PEG nanocomposite. The PL intensity of TS:TX was reduced and the shape of the PL spectrum obviously split into many side peaks, which shows the formation of resolved manifold lines were located on well-defined lattice sites. The lower PL intensity indicates the decrease in recombination rate, thus shows the higher photocatalytic activity [40]. This results indicated that, the interaction existed between SiO2 and TiO2, which cause the formation of the oxygen vacancy, thus to reduced the recombination rate of excited electrons and holes.
FTIR Spectroscopic Analysis
The FTIR spectra were measured in the spectral range from 400 to 4000 cm-1, and measurements were performed at room temperature. The FTIR spectra of the sol-gel derived nano TS:PEG and TS:TX samples of TiO2/SiO2 composite particles are presented in Fig. 5.
The transmittance in the range from 3612 cm-1 to 2862 cm-1 may be related to the presence of -OH stretching vibration. The peaks at 1639 cm−1 in the spectra are due to the bending vibration of the -OH group which is probably because the re-absorption of water from the atmosphere [41]. In Ssurfactant1, the IR spectrum shows a weak band peak at about 1512 cm-1 corresponding to the bending vibration of -OH groups. In Ssurfactant2, the IR spectrum shows a strong band peak at about 1512 cm-1 corresponding to the bending vibration of -OH groups.
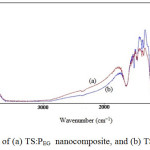 |
Fig5: FTIR spectra of (a) TS:PEG nanocomposite, and (b) TS:TX nanocomposite
|
The FTIR spectrum of the samples shows the strong band in the range at 1462 cm−1 is associated with the characteristic vibration modes of TiO2 (Ti-O). The band around at 654 cm-1 to 549 cm-1 attributes to the Ti-O-Ti stretching vibration of crystalline TiO2 phase [42]. The band near 1094 cm-1 corresponds to the asymmetric stretching vibration of Si-O-Si bond [43]. This confirms that the SiO2 phase is formed. The band observed at 949 cm-1 is associated with Si-O-Ti vibration [28] modes which are due to the overlapping from vibrations of Si-OH and Si-O-Ti bonds. Other peaks appear at 1380 cm-1 and 1353 cm-1, which may be attributed to organic solvents these peaks become quite weak and even vanish. These results indicate that TS:PEG and TS:TX nanoparticles were prepared by a combination of TiO2 with SiO2 nanoparticles which corresponds to the metal oxide bonds in both samples.
Photocatalytic Activity
The schematic diagram of setup for photocatalytic activity of nanocomposite samples under UV light source is shown in Fig. 6 and The Photocatalytic degradation study results are given in Fig. 7. The adsorption of MB dye without catalyst remains constant and gets saturated after 60 min., indicating that the contribution of self photolysis degradation was negligible. The TS:PEG composite sample exhibited slower rate of the photo degradation. The sample TS:TX shows the higher photo degradation that must be responsible for the two factors: firstly, surface phenomenon that is being very sensitive to the amount of surface -OH groups which may act as the principal reactive oxidant in the photoreactions [12]. Secondly, the low recombination rate of photo generated electrons and holes which caused the interactions in Ti-Si that improved the separation rate of photo generated electrons and holes, thus leading to the higher photo activity. The TS:TX absorbs the solute better than the TS:PEG catalyst and exibits remarkable improvement in the rate of photocatalytic degradation of MB. With sample TS:TX , only after few minute of exposure to UV light, about 50% of the methylene blue was degraded. These results confirms that the TS:TX nanocomposite crystal exhibit high photocatalytic activity than TS:PEG .
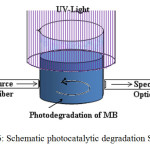 |
Fig6: Schematic photocatalytic degradation Setup Click here to View figure |
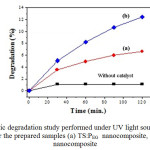 |
Fig7: Photocatalytic degradation study performed under UV light source with Methylene Blue (MB) for the prepared samples (a) TS:PEG nanocomposite, and (b) TS:TX nanocomposite
|
Conclusion
TiO2/SiO2 nanocomposite materials have been successfully synthesized via a simple and cheap non-ionic surfactants assisted sol-gel method. In XRD investigation, the anatase phase of TiO2 with nano-sized particles was obtained for both the samples. The suppressing effect of SiO2 on crystal growth of TiO2 is clearly observed with the addition of Triton X-100 could effectively decrease the crystallite size of TS composite particle. The TS cores were uniformly coated by Triton X-100 exhibited regular morphology and having spherical particles. Analysis of FTIR spectra shows that in nanocomposite structure Si-O-Si, Ti-O and Ti-O-Si bonds have been formed. The absorption spectra of the TS:TX nanocomposite sample shows better absorbance in visible region compared to TS:PEG nanocomposite particle. In PL optical properties for TS:TX composite shows lower PL intensity indicates that the decrease in recombination rate, thus higher photocatalytic activity. The TS:TX nanocomposite shows the higher photocatalytic activity in degradation of MB under UV light irradiation.
Acknowledgement
The authors would like to thank UGC-DAE-CSR Indore center, India for XRD characterizations facility.
References
- Oregan, B.; Gratzal, M. J. Nature 1991, 353, 737-740
- Kubota, Y.; Niwa, C.; Ohnuma, T.; Ohko, Y.; Talsuma, T.; Mori, T.; Fujishima, A. J. Photochem. Potoboil. A 2001, 141, 225
- Tryl, D. A.; Fujishima, A.; Honda, K. J. Electrochim. Acta 2000, 45, 2363-2376
- Gonzales, R. J.; Zallen, R.; in: M.F. Thorpe, M.I. Mitkova (Eds.), NATO-ASI. Proceedings, Amorphous Insulators and Semiconductors, Kluwer, Dordrecht, 1997.
- Kim, E. J.; Hahn, S. H. J. Mater. Lett. 2001, 49, 244-249
- Chen, Y. F.; Lee, C. Y.; Yen, M. Y.; Chiu, H. T. J. Crystal Growth 2003, 247, 363-370
- Dhage, S. R.; Choube, V. D.; Samuel, V.; Ravi, V. J. Mater. Lett. 2004, 58, 2310-2313
- Burns, A.; Hayes, G.; Li, W.; Hirvonen, J.; Demaree, J. D.; Shah, S. I. J. Materials Science and Engineering 2004, BXXX MSB 9793, 1-6
- Gugliemi, M.; Colombo, P.; Mancielli, D. J. Nan-Cryst. Sol. 1992, 147, 641-645
- Forro, L.; Chauvet, O.; Emin, D.; Zupplioli, L.; Berger, H.; Levy, F. J. Appl. Phys. 1994, 75(1), 633-635
- Liang, Y.; Gan, S.; Chambers, S. A.; Altman, E. I. J. Physical Review B 2001, 63, 235402-1
- Hoffmann, M. R.; Martin, S. T.; Choi, W.; Bahnemann, D. W. J. Chem. Rev. 1995, 95, 69-96
- Fujishima, A.; Rao, T. N.; Tryk, D. A. J. Photochem. Photobiol., C: Photochem. Rev. 2000, 1(1), 1-21
- Thompson, T. L.; Yates, J. T. J. Chem. Rev. 2006, 106(10), 4428-4453
- Yu, J. G.; Yu, J. C.; Cheng, B.; Zhao, X. J. J. Sol- Gel Sci. and Tech. 2002, 24, 39
- Rekoske, J. E.; Barteau, M. A. J. Phys. Chem. 1997, B101, 1113-1124
- Malato, S.; Blanco, J.; Vidal, A.; Alarcon, D.; Maldonado, M. I. J. Caceres, W. Gernjak, J. Solar Energy 2003, 75, 329-336
- Pawar, R.P., Orient J. Chem. 2013, 29(3), 1139-1142.
- Taghvaei, V.; Yangjeh A. H.; Behboudnia, M. J. Powder Technol. 2009, 195(1), 63-67
- Esmaili, M.; Yangjeh, A. H. J. Iran. Chem. Soc. 2010, 7, 70-82
- Jang, H. D.; Kim, S. K.; Kim, S. J. J. Nanopart. Res. 2001, 3, 141-147
- Marugan, J.; Lopez, M. J. Ind. Eng. Chem. Res. 2006, 45, 8900-8908
- Kumar, A.; Shyla, J. M.; Xavier, F. P. J. Appl. Nanosci. 2012, 2, 429-436
- Calleja, G.; Serrano, D. P.; Sanz, R.; Pizarro, P. J. Microporous and Mesoporous Materials 2008, 111, 429-440
- Minero, C.; Catozzo, F.; Pelizzetti, E. J. Langmuir 1992, 8, 481-486
- Ennaoui, A.; Sankalap, B. R.; Skryshevsky, V.; Lux-Steiner, M. C. J. Sol Energy Mater. Sol. Cells 2006, 90, 1533-1541
- Cheng, S.; Tsai, S. J.; Lee, Y. F. J. Catal. Today 1995, 26, 87-96
- Aziz, R. A.; Sopyan, I. Indian Journal of Chemistry 2009, 48A , 951-957
- Nilchi, A.; Darzi, S. J.; Garmarodi, S. R. J. Materials Sciences and Applications 2011, 2, 476-480
- Kim, S. W.; Kang, M.; Choung, S. J. J. Ind. Eng. Chem. 2005, 11(3), 416-424
- Gao, X.; Wachs, I. E. J. Catalysis Today 1999, 51, 233-254
- Hu, S.; Li, F.; Fan, Z. J. Bull. Korean Chem. Soc. 2012, 33(6), 1895-1899
- Mosurkal, R.; Samuelson, L. A.; Smith, K. D.; Westmoreland, P. R.; Parmar, V. S.; Yan, F. J. Macromolecular Science Part A Pure and Applied Chemistry 2008, 45, 924-46
- Shao, G. N.; Kim, Y.; Imran, S. M.; Jeon, S. J.; Sarawade, P. B.; Hilonga, A.; Kim, J. K.; Kim, H. T. J. Microporous and Mesoporous Materials 2013, 179, 111-121
- Aaritalo, V.; Meretoja, V.; Tirri, T.; Areva, S.; Jamsa, T.; Tuukkanen, J.; Rosling, A.; Narhi, T. J. Materials Sciences and Applications 2010, 1, 118-126
- Venckatesh, R.; Balachandaran, K.; Sivaraj, R. International Nano Letters 2012, 2(15), 1-5
- Kimura, I.; Kase, T.; Taguchi, Y.; Tanaka, M. Materials Research Bulletin. 2003, 38(4), 585-597.
- Castro, A. L.; Nunes, M. R. J. Solid State Sci. 2008, 10, 602-606
- Yeh, C. L.; Yeh, S. H.; Ma, H. K. J. Powder Technol. 2004, 145, 1-9.
- Hu, S. Z.; Wang, A. J.; Li, X.; Wang, Y.; Lowe, H. J. Chem. Asian 2010, 5, 1171-1177.
- Mohan, J.; “Organic spectroscopy principles and applications”, 2nd Eds. Narosha Publishing House Pvt. Ltd, New Delhi, 2009, 28-95.
- Lee, J. W.; Kong, S.; Kim, W. S. J. Mater. Chem. Phys. 2007, 106, 39-44.
- Yan, X. L.; He, J.; Evans, D. G.; Duan, X.; Zhu, Y. X. J. Appl. Catal. 2005, B 55, 243-252.

This work is licensed under a Creative Commons Attribution 4.0 International License.
![]()
A New Edition of Web of Science
Journal Impact Factor
2022: 0.5
Five Year: 0.8
Journal is Indexed in

Cabells Whitelist
![]()


