Kinetics and thermal decomposition of Tetrahydrazine lanthanum 2-hydroxy-1- naphthoate
Department of Chemistry, Government College of Technology, Coimbatore - 641013, Tamil Nadu, India.
DOI : http://dx.doi.org/10.13005/ojc/300458
Download this article as:
![]()
Tetrahydrazine lanthanum 2-hydroxy-1-naphthoate [La2(NA)3L4] (where NA and L indicate C10H6(2-O)(1-COO) and N2H4 respectively) was synthesised and characterised by micro elemental analysis, IR spectroscopy, simultaneous TG-DTA and X-ray diffraction (XRD) analysis. The results indicate that the compound loses hydrazine molecules in the temperature range 65 - 150 °C and decomposes to La2O3 at 675 °C through different intermediates, [La2O(CO3)2], [La2O2CO3] at 426 °C and 580 °C respectively. The intermediates of thermal decomposition and final product were confirmed by IR and X-ray diffraction. Coats and Redfern method has been implemented for the estimation of various kinetic parameters viz. energy of activation (E), pre-exponential factor (A),order of decomposition (n).The thermodynamic parameters like enthalpy of activation (ΔH) entropy of activation (ΔS) and free energy of activation (ΔG) have been calculated by using thermogravimetric data.
KEYWORDS:Hydrazine ligand; lanthanum complex; Thermal decomposition; Coats; Redfern equation
INTRODUCTION
Hydrazine complexes with lanthanum carboxylates are reported frequently owing to its application in the preparation of its oxide in micro and nanoscale.1-5 Complexes of aromatic carboxylates with hydrazine on thermal decomposition yield oxide in nanosize with high purity due to the fueling effects of hydrazine and high carbon content.6 Rare earth metal oxides are used in wide high–tech applications. The hexagonal structure phase of La2O3 is stable up to 2050 °C. It is an important component of automobile exhaust gas conversion7 and it is a catalyst support in the formation of gas conversion catalyst.8 La2O3 is an ingredient for the manufacture of piezoelectric and thermoelectric materials9 and as a catalyst of oxidative coupling of methane.10 It is also used as a refractory oxide for calcium light, optical glass11 and in the creation of ceramics as core arc electrodes.12 Moreover, the thermo–analytical study by Bakiz et al reveal that all lanthanum complexes decompose through various intermediates, LaOHCO3, La2O2CO3 forming lanthanum oxide as final product.13 Kinetic study of thermal decomposition of these types of complexes has also been attempted.8,14 & 15
Though many lanthanum aromatic carboxylates have been reported, complexes using 2– hydroxyl–1– naphthoic acid (NA) are little known. In this paper, preparation and characterisation of a new lanthanum complex using the above acid and hydrazine, a good bridging ligand. The thermal decomposition of the complexes has been thoroughly studied and kinetic study has also been performed using Coats Redfern equation.14 & 16
EXPERIMENTAL
Materials
Lanthanam oxide (La2O3), 2–hydroxy–1– naphthoic acid, 99.99% pure, hydrazine hydrate (N2H4 .H2O) (Analar grade) and con. HNO3 (sp.gravity = 1.4g/ml ) were used for preparation of compound.
Methods
Preparation of tetrahydrazine lanthanum 2-hydroxy-1- naphthoate
The title compound was prepared by adding slowly lanthanum nitrate solution [prepared by dissolving lanthanum oxide (0.325 g, 1 mmol) in minimum amount of conc. HNO3 (99.9% pure)] into a solution of ligand (60 mL). It is formed by mixing the acid (0.188 g, 1 mmol) and hydrazine hydrate (0.2 g, 4 mmol) in 60 mL of water, and stirring the solution at pH 5 for about 1 hour. The solution was kept for evaporation for ½ hour over hot water bath at 90 °C. A cluster of micro crystalline solid developed on cooling. The compound separated was filtered, washed with water, alcohol and then with ether and dried in a desiccator.
The composition was fixed by chemical analysis. Hydrazine content is determined by titrating against standard KIO3 (0.025 mol L-1) under Andrew’s conditions.17 The metal after destroying the hydrazine and organic matter by treatment with concentrated HNO3 and evaporating the excess HNO3 are determined by EDTA (0.01 mol L-1) complexometric titration.17 The analytical datas for the complex are, calculated: C – 41.06 %, H – 3.5 %, N -11.6 %, N2H4 –13.2 %, La –28 %. Found: C – 41.1 %, H – 3.6 %, N – 11.8 %, N2H4 – 13.5 %, La – 28.1 %.
FTIR analysis
IR spectra of the complexes in the region 4000 – 400 cm-1 were recorded as KBr pellets using a Shimadzu FTIR–8201 (PC)S spectrophotometer. IR–spectra of intermediates and final product are obtained from thin (>20 mg/m2), lightly loaded (<1%) KBr-supported (KBr, Jasco, spectroscopy grade) discs.
Thermal analysis
The TG–DTA experiments were carried out using Perkin Elmer, Diamond TG/DTA analyzer, in air atmosphere at a heating rate of 10°C/min, from room temperature to 721 °C using 5 to 10 mg of the samples. Nitrogen was used as a burger gas. Platinum cups were employed as sample holders and alumina as reference.
XRD analysis
The X–ray powder diffraction (XRD) patterns of the complexes were recorded using Bruker X–ray diffractometer (model AXS D8 Advance) employing Cu–Kα (λ = 1.5406) radiation with nickel filter. The operational settings for all the XRD scans are voltage: 40 kV, current: 30 mA, range: 3°–60° (2θ), scanning speed: 8°/min, slit width: 0.02°. For identification purpose, the relative intensities (I/I°) and the d–spacing (Aᶱ) are compared to standard diffraction patterns were matched with JCPDS standards.
Electron Microscopy
Samples of the final decomposition products (675 °C) were examined in a JEOL model JSM-6390 LV scanning electron microscope to characterize in the texture.
RESULTS AND DISCUSSION
IR spectra
The IR spectrum of the complex is shown in (Figure. 1. a). It shows a strong absorption band at 979 cm-1 due to N–N stretching vibration and a broad band stretching from 2800– 3500 cm-1 most probably due to νN-H. These observations indicate that hydrazine is present as a bidentate bridging ligand in the complex. The former peak is not found in the case of pure acid. Moreover, a sharp peak observed at 1680 cm-1 for carbonyl stretching is not observed in the case of complex but it is found to split into two peaks centred at 1572 and 1396 cm-1 owing to asymmetric and symmetric carbonyl stretching. Further, peaks observed at 591 and 500 cm-1 is attributed to stretching of La–O and La–N bonds respectively. These facts substantiate the complex formation of lanthanum with acid and hydrazine.
![Figure. 1. IR spectra of (a) [La2(NA)3L4], (b) [La2(NA)3], (c) [La2O(CO3)2], (d) [La2O2CO3], (e) La2O3](https://www.orientjchem.org/wp-content/uploads/2014/11/Vol30_No4_Kine_Karu_Fig1-150x150.jpg) |
Figure1: IR spectra of (a) [La2(NA)3L4], (b) [La2(NA)3], (c) [La2O(CO3)2], (d) [La2O2CO3], (e) La2O3 |
Thermal analysis
Simultaneous TG and DTA curves of the complex are shown in (Figure. 2) and the results are shown in (Table .1). The thermo analytical curves indicate the degradation of the complex in four steps.
![Figure. 2. TG and DTA curve of [La2(NA)3L4]](https://www.orientjchem.org/wp-content/uploads/2014/11/Vol30_No4_Kine_Karu_Fig2-150x150.jpg) |
Figure2: TG and DTA curve of [La2(NA)3L4]
|
The decomposition begins with the elimination of hydrazine molecules in the temperature range 65–150 °C showing endotherm at 85 °C. All the four molecules of hydrazine are eliminated taking temperature from the system. Hence, the decomposition is endothermic. The elimination is confirmed by taking the IR of the residual at 150 °C (Figure.1.b). The spectrum shows a complete vanishing of peak at 970 cm-1which appear in the IR of the complex (Figure.1.a). Further the stretching due to N–H is also lost in the IR spectrum of residual.
Step–2 indicates the decomposition of lanthanum carboxylate in to [La2O(CO3)2] which shows similar range of decomposition point, 426 °C and similarity in IR spectrum (Figure.1.b.) conforming to the data reported in the literature.8 This decomposition is accompanied by a sharp exothermic peak at 426 °C implying a sudden explosion reaction. This may be due to the association of fuelling effect of the hydrazine liberated and the carboxlyate moiety present in that complex.
Step–3 involves further decomposition of the compound to [La2O2CO3]which is confirmed by its IR spectrum shown in (Figure.1.c).This is exhibited by a small exothermic hump centered at 580 °C.
Step–4 indicates the final decomposition of the compound to La2O3 as evidenced from the similarity of IR spectrum of the residue with that reported.
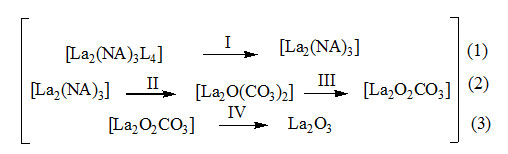
The observed mass losses in TG are in good agreement with the composition of intermediate and final product. The thermal decomposition steps are shown in the equation.
![Table 1. Thermal decomposition data of [La2(NA)3L4]](https://www.orientjchem.org/wp-content/uploads/2014/11/Vol30_No4_Kine_Karu_T1-150x150.jpg) |
Table1: Thermal decomposition data of [La2(NA)3L4] |
XRD analysis
The XRD patterns of the complex, intermediate and final product are shown in (Figure.3). The final product shows similarity with the JCPDS data of α– lanthanum oxide. All other intermediate show different diffraction patterns corresponding to [La2O(CO3)2]and [La2O2CO3]8 in (Figure.3.b-d). The diffraction pattern of the complex could not index, since it is a new compound.
![Figure. 3. XRD pattern of (a) [La2(NA)3L4], (b) [La2(NA)3], (c) [La2O(CO3)2], (d) [La2O2CO3], (e) La2O3](https://www.orientjchem.org/wp-content/uploads/2014/11/Vol30_No4_Kine_Karu_Fig3-150x150.jpg) |
Figure3: XRD pattern of (a) [La2(NA)3L4], (b) [La2(NA)3], (c) [La2O(CO3)2], (d) [La2O2CO3], (e) La2O3 |
SEM analysis
The particle size of lanthanum oxide (Figure.4) produced by the decomposition of the complex in revealed from sem image. The size of the particles varies from 29–50 nm. This is in good agreement with the values calculated from Scherrer’s formula D = Kλ/β cosθ, where λ is the X–ray wavelength, β is the full width of height maximum (FWHM) of a diffraction peak, θ is the diffraction angle and K is the Scherrer’s constant of the order of 0.89.18
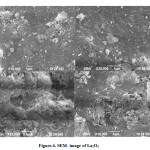 |
Figure4: SEM- image of La2O3 |
Thermal decomposition kinetics
The thermogravimetric analysis is a useful analytical technique for evaluating kinetic parameters of solid state reactions. It provides valuable quantitative information regarding the stability of the material. The following Coats and Redfern14, 16 equation was used to evaluate kinetic data from thermogravimetric curves.
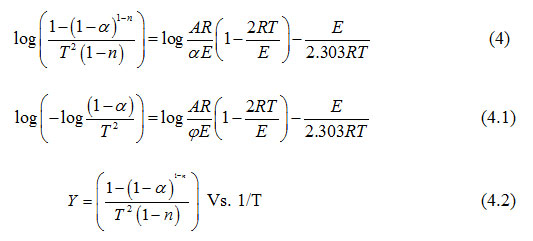
where α is the fraction of sample decomposed at time t, n is order of decomposition reaction, φ is heating rate in °C degree/min, T is temperature (K), A is frequency factor (s-1), R is gas constant (8.314 J.k-1mol-1) and E is the activation energy (kJ.mol-1). The order of decomposition was obtained by substituting different values of ‘n’ in to equation (4.2) to obtain the plots of best fit. The plots obtained are shown in (Figure. 5. a -d). Among all the plots for decomposition, the best fit curve gives the order of decomposition with slope of (–E/2.303R) and intercept of log AR/φE[1-(2RT/E)].
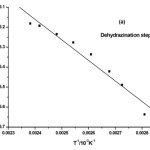 |
Figure 5 A Click here to View figure |
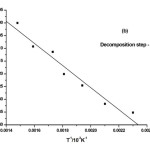 |
Figure 5 B Click here to View figure |
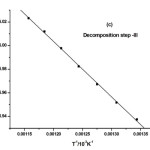 |
Figure 5 C Click here to View figure |
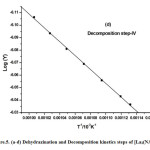 |
Figure5: (a-d) Dehydrazination and Decomposition kinetics steps of [La2(NA)3L4]
|
The value of activation energy (E) and pre-exponential factor (A) are calculated from the slope and intercept of the best fit curve respectively. The entropy of activation (ΔS), enthalpy of activation (ΔH) and free energy of activation (ΔG) are also calculated from the following equation.
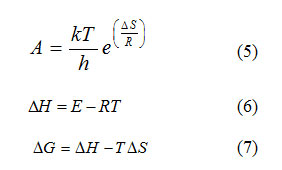
where h and k are Planck’s constant (6.626×10⁻³⁴ J.s) & Boltzmann constant (1.38×10⁻²³ J.k-1) respectively. The data obtained from the best fit curve are given in (Table.2).
The kinetic data indicate that the activation energy for step–II and step–III is lower when compared to step – I and IV revealing their exothermocity. The higher value for the initial step indicates that the complexes more stable.
![Table 2. Kinetic data of the thermal decomposition of [La2(NA)3L4]](https://www.orientjchem.org/wp-content/uploads/2014/11/Vol30_No4_Kine_Karu_T2.jpg) |
Table2: Kinetic data of the thermal decomposition of [La2(NA)3L4] |
CONCLUSION
The results of the present studies led to the following conclusion:
- The reaction of 2–hydroxy–1–naphthoic acid and hydrazine react with lanthanum nitrate at pH 5 yielded tetrahydrazine lanthanum 2–hydroxy–1–naphthoate.
- The thermal decomposition course of tetrahydrazine lanthanum 2–hydroxy–1–naphthoate May include the following path ways:
- The tetrahydrazine lanthanum 2–hydroxy–1–naphthoate is thermally stable but the Anhydrous naphthoate is unstable and the dehydrazination of naphthoate is responsible of the crystal coherency of La2O3.
- La2O(CO3)2 and La2O2CO3 are formed as intermediates during the decomposition of lanthanum 2–hydroxy–1–naphthoate but there were no regions of stability.
- Crystalline phase of La2O3 are detectable as the final decomposition product of [La2(NA)3L4]
- La2O3 obtained at 675 °C is in the form of nano particles having the size 29–50 nm.
- The activation energy values calculated by Coats–Redfern method show that the prepared compound is more stable.
REFERENCES
- Kuppusamy, K.; Govindrajan, S. Synth. React. Inorg. Met- Org. chem. 1996, 26, 225- 243
- Kuppusamy, K.; Govindrajan, S. Eur. J. Solid State Inorg chem. 1995, 32, 997- 1012
- Ravindranathan, P.; Patil, K. C. Am. Ceram. Soc. Bull. 1987, 66, 688-692
- Ravindranathan, P.; Mahesh, G. V.; Patil, K. C. J. Solid State chem. 1987, 66, 20-25
- Kula, A. J. Therm. Anal. Calorim. 2002, 68, 957-964
- Arunadevi, N.; Devipriya, S.; Vairam, S. Eng. Sci. Tech. 2009, 3, 1-8
- Murugan, V. A.; Navale, S. C.; Ravi, V. Matt Lett. 2006, 60(6), 848-849
- Balboul, B. A. A.; Ei-Roudi, A. M.; Samir, E.; Othman, A.G. Thermochim. Acta. 2002, 387(2), 109-114
- Cao, J.; Ji, H.; Liu, J.; Zheng, M.; Chang, X.; Zhang, A.; Xu, Q. Matt Lett. 2005, 59, 408-411
- Petryk, J.; Kolakowska, E. App. Cat. Envir. 2000, 24(2), 121-128
- Schweizer, T.; Samson, B. N.; Hector, J. R.; Brocklesby, W. S.; Hewak, D. W.; Payne, D. N. Infr. Phy. Tech. 1999, 40, 329-335
- Escudero, M. J.; Novoa, X. R.; Rodrigo, T.; Daza, L. J. Power Sources, 2002, 106(1-2), 196-205
- Bakiz, B.; Guinnetion, F.; Arab, M.; Benlhachemi, A.; Gavarria, J. R. M. J. Condensed Matter, 2010, 12(1), 60-67
- Ebrahimi–Kahrizsangi, R.; Abbasi, M. H. Trans. Nonferrous Met. Soc. China. 2008, 18, 217-221
- Shirsat, A. N.; Ali, M.; Kaimal, K. N. G.; Bhaaradwaj, S. R.; Das, D. Thermochim. Acta. 2003, 399, 167-170
- Coats, W.; Redfern, J. P. Nature, 1964, 201, 68-69
- Vogel, A. I., A Text Book of Quantitative Inorganic Analysis, Longmans, London, UK, (1975)
- Cao, G. Nano structures and nano materials, synthesis, properties and applications [M]. Imperial College Press: London, UK, (2004)


![]()


