Kinetic Spectrophotometric Determination of Morphine in Pharmaceutical Samples
Mohsen Keyvanfard1, Faeze Amri2
1Department of Chemistry, Majlesi Branch, Islamic Azad University, Isfahan, Iran
2Department of Chemistry, University of Payame Nour, Isfahan Branch, Iran
DOI : http://dx.doi.org/10.13005/ojc/300444
Article Received on :
Article Accepted on :
Article Published : 20 Nov 2014
Anew,sensitive, simple, inexpensive and fast kinetic spectrophotometric method was developed for the determination of trace amounts of morphine over the range of 12-60 ng/mL. The method is based on the catalytic effect of morphine on the reaction of bromate and methylene bluein acidic media is reported. The reaction was monitored spectrophotometrically by measuring the decrease in absorbance of methylene blue at 665 nm with a fixed-time 0.5-2.5 min from initiation
KEYWORDS:Morphine Kkinetic Ddetermination Methylene blueCatalytic
Download this article as:| Copy the following to cite this article: Keyvanfard M, Amri F. Kinetic SpectrophotometricDetermination of Morphine in Pharmaceutical Samples. Orient J Chem 2014;30(4). |
| Copy the following to cite this URL: Keyvanfard M, Amri F. Kinetic SpectrophotometricDetermination of Morphine in Pharmaceutical Samples. Available from: http://www.orientjchem.org/?p=5490 |
INTRODUCTION
Morphine extracted from the plant papaver somniferum1 Morphine (MO) is a useful drug in relieving patients of severe pain, but it’s excessive or habitual use frequently causes toxic symptoms2 Morphine is the primary constituent of opium. It is the most important drug of the opiates group3. The use of morphine as an analgesic in pre-term newborns is very common, due to the many painful procedures and stressful circumstances they under go 4, 24, 25 and it used for the therapy of reduce to severe pain, especially after surgical procedures.Toxic effects of morphine usage can be harmful for human.Morphine is a useful drug but it’s excessive or habitual use frequently is harmful.
Different methods have been reported for detecting morphine. These include: spectrophotometry 5, 6, immuno chromatography 7, potentiometry 8, 9, simultaneous voltammetric and amperometric 10, gc-mass 1, 11, 26, cyclicvoltametry and amperometry 12, cyclicvoltametry13, 14, sequential injection analysis 4,chemiluminescence 15, kinetic potentiometric 9, high performance liquid chromatography16-19, gas chromatography20, capillary electrophoresis21, ion mobility spectrometry22, 23. These methods are efficient, but require expensive instrument and are expensive and many of them have needing time to complete the determination. Some of this methods have high limit of detection. Therefore, the need for a sensitive, simple, fast and selective method for the determination of morphine is obvious. In this paper, we developed and validated a rapid, sensitive kinetic spectrophotometric method for the determination of morphine based on its catalytic effect on the reaction of bromate and methylene blue in acidic media.Morphine sulfate 5H2O has the following structure ( Figure 1).
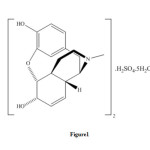 |
Figure1: Structure of morphine sulfate 5H2O. Click here to View figure |
EXPERIMENTAL
Reagents and Apparatus
Doubly distilled water and analytical reagent grade chemicals were used during all of the experimental studies. Methylene blue solution 3.1×10⁻⁴M was prepared by dissolving 0.0100 g of the compound (Merck) in water and solution was diluted to the mark in a 100 mL volumetric flask. Bromate stock solution 0.25 M was prepared by dissolving 4.1752 g of potassium bromate (M=167) in water and diluting to 100 mL in volumetric flask.Standard stock morphine solution 10 µg/mL was prepared by dissolving 0.0013 g of morphine sulfate 5H2O(M=758.83) in water and diluting to 100 mL in volumetric flask.The working solutions were prepared by serial dilution of it in water. Sulfuric acid solution was prepared by appropriate dilution of concentrated sulfuric acid (Merck).All glassware were cleaned with detergent solution, rinsed with tap water, soaked in dilute HNO3 solution (2%V/V), rinsed with water and dried.
Apparatus
Absorption spectra were recorded with a CECIL model 7500 spectrophotometer with a 1.0 cm quartz cell. A model pharmacia biotech (Novaspec II)spectrophotometer with 1.0 cm glass cuvettes was used to measure the absorbance at a fixed wavelength of at 665 nm. A thermostat water bath (Gallen Kamp Griffin, BGL240 V) was used to keep the reaction temperature at 30°C±0.1.A stopwatch was used for recording the reaction times.
Recommended Procedure. All the solutions and distilled water were kept in a thermostated water batch at30 °C±0.1 for 20 min for equilibration before starting the experiment. An aliquot of the solution containing 120-600 ng/mLmorphine was transferred into a 10 mL volumetric flask, and then 2.0 mL 0.5 M H2SO4, 1.0mL0.1 µg/mL morphine and 0.8mL3.1×10-4M methylene blue were added to the flask.The solution was diluted to 7.0mL with water. Then, 1.0mL 0.25 M bromate was added and the solution was diluted to the mark with water. The solution was mixed and a portion of the solution was transferred to the spectrophotometer cell. The reaction was followed by measuring the decrease in absorbance of the solution against water at 665 nm for 0.5–2.5 min from initiation of the reaction. This signal (sample signal) was labeled as ΔAs.The same procedure was repeated without addition of morphine solution and the signal (blank signal) was labeled as ΔAb. Time was measured just after the addition of last drop of bromate solution. Analytical signal was deference between sample signal and blank signal(ΔAs- ΔAb).
Results and Discussion
Methylene blue is a dye that can be oxidized with strong oxidizing agents.We found that trace amount of morphine have a catalytic effect on the this reaction. Therefore, by measuring the decrease in absorbance of methylene blue for a fixed time of 0.5-2.5min initiation of the reaction, the morphine contents in the sample can be measured. There are many methods, such as fixed-time, initial rate, rate constant and variable time methods for measuring the kinetic species. Among these, the fixed–time method is the most conventional and simplest, involving the measurement of ΔA at 665 nm( Figure 2). Methylene blue has the following structure ( Figure3).
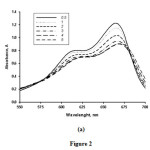 |
Figure2: Absorption spectrum for the morphinemethylene blue –BrO3− system with time. Conditions: H2SO4 , 0.10M; methylene blue, 2.5×10⁻⁵M; BrO3−0.025 M; temperature, 30 °C; interval time for each scan, 0.5and2.5from initiation of the reaction.a- in presence of 20ng/mL of morphineb-in absence of morphine.Click here to View figure |
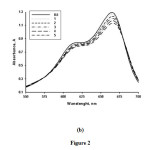 |
Figure 2BClick here to View figure |
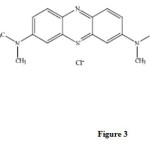 |
Figure3: Structure of methylene blue.Click here to View figure |
Influence of Variables
In order to take full advantage of the procedure, the reagent concentrations must be optimized. The effect of acid concentration, methylene blue concentration, bromate concentration and temperature on the analytical signal was studied.
The effect of sulfuric acid concentration on the analytical signal was studied in the range of 0.07 -0.13M ( Figure4).The results show that the analytical signal increases with increasing sulfuric acid concentration up to 0.10M and decreases at higher con-centrations. Therefore, a sulfuric acid concentration of 0.10 M was selected for further study.
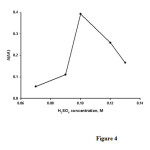 |
Figure4: Effect of H2SO4 concentration on the analytical signal. Conditions methylene blue3.1×10−5 M; BrO3−0.025 M;temperature, 30 °C and time of 3.5 min from initiation of the reaction. Click here to View figure |
The influence of methylene blue concentration on the analytical signal was studied in the concentration range of 1.2×10⁻⁵– 4.3×10⁻⁵ M ( Figure5).The results show that the analytical signal increases with increasing methylene blue concentration up to 2.5×10⁻⁵ M and decreases at higher concentrations. Therefore,a methylene blue concentration of 2.5×10⁻⁵ M was selected for further study.
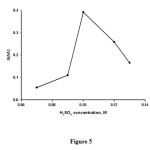 |
Figure5: Effect of methylene blue concentration(MB) on the analytical signal. Conditions: H2SO4, 0.10M; BrO3−, 0.025M, , temperature,30°C; and time of 3.5 min from initiation of the reaction.Click here to View figure |
Figure 6 shows the effect of the bromate concentration on the analytical signal for the range of 1.5×10⁻²-3.5×10⁻² M. This analytical signal increases with increasing bromate concentration up to 2.5×10⁻²M and decreases at higher concentrations. Therefore, a final concentration of 2.5×10⁻² M of bromate was selected as the optimum concentration.
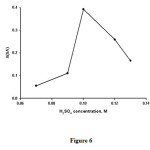 |
Figure6:Influence of BrO3− concentration on the analytical signal. Conditions: H2SO40.10 M ; methylene blue2.5×10−5M , temperature, 30 °C and time of 3.5 min from initiation of the reaction. Click here to View figure |
The effect of ionic strength on the analytical signal was studied. The results showed that, as the ionic strength increases, analytical signal slightly increases.
The effect of the temperature on the analytical signal was studied in the range 20–38°C with the optimum of the reagents concentrations. The results showed that, as the temperature increases up to 30°C, the analytical signal increases, whereas higher temperature values decrease the analytical signal (ΔA=ΔAs– ΔAb). Therefore,30°C was selected for further study.
Calibration Graph. Precision and Limit of Detection. Calibration graph were obtained using the fixed–time method. This method was applied to the change in absorbance over an interval of 0.5–2.5min from initiation of the reaction because it provided the best regression and sensitivity. The equation of the calibration graph is ΔA=0. 0145 C morphine + 0.2827(n=7, r =0.999) in the range of 12-60 ng/mL. The calibration graph was constructed by plotted of ΔAsat a fixed –time method versus morphine concentration.The limit of detection (Defined as DL=3 Sb/m, where DL, Sb and m are limit of detection, standard deviation of the blank signal and slope of the calibration graph, respectively) is equal to 1.8 ng/mL morphine.The relative standard deviation for five replicate determination of 12and 52 ng/mLmorphine was 1.50 and 0.87% respectively.
Interference Study. In order to assess the application of the proposed method to synthetic samples, the effect of various ions and substances on the determination of 20ng/mL morphine was studied. The tolerance limit was defined as the concentration of a added ions causing a relative error less than 3% the results are summarized in Table 1.
Table 1. Effect of foreign substances on the determination of 60 ng/mL morphine
|
Tolerance limit wion/w morphine |
Foreign ion |
|
1000 |
Na+, K+ |
|
700 |
Glocose |
|
500 |
Sucrose |
|
200 |
Urea, NH4+ |
|
100 |
Citric acid, Zn2+, Ag+, Fe3+ |
|
10 |
I– , Io3- |
|
5 |
Pb2+, So3-2 |
|
<1 |
Cl-, Br–, No3–, Pethidine, Tramadol, Methadone, Fentanyl |
Preparation of Real Samples
In order to evaluate the applicability of the proposed method to analysis of real sample the method was applied to pharmaceutical samples (ampoule) for determination of morphine.The results obtained by the proposed method are given in Table 2.
Table 2. Determination of free morphine in synthetic samples.
|
Recovery% |
RSD ( n=4) |
Morphine found |
Morphine added |
Sample |
|
0.48 |
103.5 |
62.1±0.3 |
60.0 |
Ampoule |
|
0.89 |
93.3 |
11.2±0.1 |
12.0 |
|
|
1.12 |
95.7 |
26.8±0.3 |
28.0 |
|
|
0.64 |
105.7 |
46.5±0.3 |
44.0 |
Table 3. Comparison of some methods for determination of morphine with proposed method.
|
Reference no |
DL/(ng/ml) |
LDR/(ng/ml) |
Method |
|
propesedmethod |
1.8 |
48-76 |
Kinetic spectrophotometry |
|
6 |
– |
1500-13500 |
Kinetic spectrophotometry |
|
16 |
60 |
– |
Ion mobility spectrometry |
|
21 |
28.5 |
171.18-57060 |
High performance liquid chromatography |
|
4 |
250 |
250-2000 |
Gc-mass |
|
15 |
20 |
50-2000 |
Gc-mass |
|
12 |
41 |
110-2900 |
Kinetic potentiometry |
|
11 |
10 |
– |
Immunochromatography |
|
14 |
3.5 |
3.5-1000.0 |
High performance liquid chromatography |
|
18 |
2.39 |
5.98-329.20 |
Cyclic voltammetry |
|
17 |
1.0 |
5-500 |
Gc-mass |
|
5 |
23 |
100-2500 |
Exploiting sequential injection analysis |
|
8 |
28.53 |
570.6-285300 |
Simultaneous voltammetric and amperometric |
|
19 |
5.7 |
57.06-11412 |
Cyclic voltammetry |
|
8 |
28.53 |
570.6-285300 |
Kinetic spectrophotometry |
CONCLUSION
The kinetic-spectrophotometric method developed for the determination of morphine is inexpensive, uses readily available reagents, allows rapid determination at low operating costs and shows simplicity,good precision and accuracy compared to other kinetic procedures as shown in Table 3. With this method,it is possible to determine morphine at levels as low as 12 ng/mL.
ACKNOWLEDGMENTS
The author are thankful to the Islamic Azad University-Majlesi Branch and University of Payame Nour-Isfahan Branch for the support of this work.
REFERENCES
- Van Thuyne, W., Van Eenoo, P., Delbeke, F.T., Chromatography B. 2003, 785, 245-251.
- Sakaia, G. ,Ogataa, K., Udab, T., Miuraa, T. and Yamazoe, T., Sensors and Actuators B: Chemical1998 , 49, 5-12.
- Idris, A.M., Alnajjar, A.O, Talenta 2008,77,522-526.
- Cherry, D.A., Gourlay, G.K., Agents Actions 1994, 42, 173-174.
- Malovanovic, G.A., Sekhtea, M.A., Mikrochimica 1984, 84, 477-483.
- Sheibani, A., Shishehbore, M.R., Mirparizi, E., SpectrochimicaActa Part A 2010,77, 535-538.
- Lyubavina, I.A., Zinchenko, A.A., Lapenkov, M.I., Nikolaeva, T.L. 2005, 31, 99-103.
- Hassan, S.S.M., El-Naby, E.H., Elnemma, E.M., Russian Journal of Bioorganic Chemistry 1996, 124, 55-62.
- Pejic, N., Anic, S., Mijatovic, M. Milenkovic, S., Ciric, J., Grozdic, T.,Nauka, tehnika,bezbednost 2003,13, 67-74.
- Xu, F., Gao, M., Wang, L., Zhou, T., Jin, L., Jin, J., Talanta 2002, 58, 427-432.
- Melent’ev, A. B., Journal of Analytical Chemistry 2003, 59, 566-570.
- Pournaghi-Azar, M.H., Saadatirad, A., Electroanalytical chemistry2008, 624, 293-298.
- Ganjali, M.R., Norouzi, P., Dinarvand, R., Farrokhi, R., Moosavi-movahedi, A.A., Materials Science and Engineering C.2008, 28, 1311-1318.
- Li, F., Song, J., Shan, C., Gao, D., Xu, X., Niu, L., Biosensors and Bioelectronics2010, 25, 1408-1413.
- Francisa, P.S., Adcock, J.L., Costin, J., Purcell, S.D., Pfeffer, F.M., Barnett, N.,J. Pharm. Biomed. Anal.2008, 48, 508-518.
- Rop, P. P., Grimaldi, F., Burle, J., De Saint Leger, M. N., Viala, A., Journal of Chromatography. B.1994, 661, 245-253.
- Domnguez-Ramrez, A. M., Cortes-Arroyo, A., y de la Peٌa, M. H., Aoki-Maki, K., Medina Lopez, J. R., Ros-Castaٌeda, C., Lopez-Munoz, F.J., Journal of Pharmaceutical and Biomedical Analysis 2006, 40, 1172-1178.
- Sato, K., Chiba, T., Chiba, R., Satou, S., Tanaka, S., ANALYTICAL SCIENCES.2001,17, 1041-1043.
- Berga, T., Lundanes, E., Chritophersen, A.S., Strand, D.H., J.Chromatogr. B.2009, 877, 421-432.
- Hofmann, U., Seefried, S., Schweizer, E., Ebner, T., Mikus, G., Eichelbaum, M., J.Chromatogr. B.1999, 727, 81-88.
- Mi, J.Q., Zhang, X.X., Chang, W.B., . J. Immunoassay Immunochem2004,25, 57-70.
- McCooeye, M.A., Ells, B., Barnett, D.A., Purves, R.W., uevremont, R., . Journal of Analytical Toxicology2001, 25, 81-87.
- Khyamian, T., Tabrizchi, M., Jafari, M.T., .TalantaQuantitative analysis of morphine and noscapine using corona discharge ion mobility spectrometry with ammonia reagent gas2006, 69, 795-799.
- Breivik, H., ActaAnaesthesiolScand 2001,45, 1059-1066.
- Lyun, A.M., Nespeca, M.K., Opheim, K.E., Slattery, J.T., Anesth. Analg1993, 77, 695-701.
- Javidnia, K., Miri, R., Miri, D., IJMS2006, 31, 213-215.

This work is licensed under a Creative Commons Attribution 4.0 International License.
![]()
A New Edition of Web of Science
Journal Impact Factor
2022: 0.5
Five Year: 0.8
Journal is Indexed in

Cabells Whitelist
![]()


