Computational Studies on 2(2-Hydroxyphenyl)-N-phenyl Nitrone, Spectroscopic Investigation.
1Department of Physics, S.A. Engineering College,Veeraraghavapuram-600077, India.
2Department of Applied Physics, Sri Venkateswara College of Engineering, Sripeumbadhur-602117 ,India.
3Department of Applied Chemistry, Sri Venkateswara College of Engineering, Sripeumbadhur-602117 ,India.
DOI : http://dx.doi.org/10.13005/ojc/300451
Download this article as:
![]()
The title compound 2(2-Hydroxyphenyl)-N-phenyl Nitrone (2HPNPN) was synthesized and characterized by FT-IR, FT-Raman spectral analysis. The molecular geometry, harmonic vibrational frequencies and bonding features of the title compound in the ground state are computed at three parameter hybrid functional Lee-Yang-parr/6-311++G(d,p) levels of theory. The assignments of the vibrational spectra have been carried out with the help of normal co-ordinate analysis (NCA) following the scaled quantum mechanical force field methodology (SQMF). Finally, the calculations are applied to simulated FT-IR and FT-Raman spectra of the title compound which show good agreement with observed spectra.
KEYWORDS:Computational Studies; The title compound; bonding features
Introduction
The nitrone chemical structure in its simplest form can be represented as X-CH=NO-Y. Nitrones began to be used in analytical chemistry applications in the late 1960s. Nitrones will react with and “trap” and stabilize free radical intermediates. Many chemical reactions have free radical intermediates. Since many of these intermediates exist for only a brief time they are therefore very difficult to characterize and study. Chemists showed in 1967 that some free radicals will react with nitrones to produce nitroxide free radicals1. The nitrone trapping of a free radical intermediate is represented in the following simple reaction where the free radical intermediate (R•) is trapped by a nitrone: X-CH=NO-Y+R• → X-CHR-NO•-Y. Janzen and Blackburn advanced the field significantly and utilized nitrones to trap free radicals and also coined the term “spin trap” for trapping free radical intermediates2. The reaction of the free radical species with a nitrone yields a product termed the spin-ad duct. The nitroxyl free radical spin-adduct is usually much more stable than the free radical therefore making it possible in principle to characterize the original free radical trapped using electron paramagnetic resonance methods 2. Shortly after beginning the use of nitrones to trap free radicals in analytical chemistry, scientists then began to use nitrones to trap free radicals in biochemical systems with reports first appearing in 19754 and 19764.
Experimental Section
The FT-IR spectrum of the compound was recorded in Bruker IFS 66V spectrometer in the range of 4000 to 400 cm-1. The spectral resolution is ±2 cm-1. The FT-Raman spectra of this compound was also recorded in the same instrument with FRA 106 Raman module equipped with Nd: YAG laser source operating at 1.064 μm line widths with 200 mW powers. The spectra were recorded with scanning speed of 30 cm-1 min-1 of spectral width 2 cm-1. The frequencies of all sharp bands are accurate to ±1 cm-1.
Computational Details
As the first step the optimized molecular structure, energy, and vibrational frequencies of the molecule have been calculated by using B36 exchange functional combined with the LYP7 correlation functional resulting in the B3LYP density functional method at 6-311++G(d,p) basis set. All the computations were performed using Gaussian 03 W program5 and Gauss-View molecular visualization program package on the personal computer5. Secondly, a comparison is made between the theoretically calculated frequencies and the experimentally measured frequencies. In this investigation we observed that the calculated frequencies were slightly greater than the fundamental frequencies. To improve the agreement between the predicted and observed frequencies, the computed harmonic frequencies are usually scaled for comparison. In this work the scaling of the force field was performed according to the SQMFF procedure8, The descriptions of the predicted frequencies during the scaling process were followed by the potential energy distribution (PED) matrix. The characterization of the normal modes using potential energy distribution (PED) was done with the MOLVIB -7.0 program written by10.
Molecular geometry
The structure of the molecule with numbering scheme for the atoms is presented in Figure 1.The optimized structure parameters of 2HPNPN calculated by DFT /B3LYP level with 6-311++ G (d, p) basis set are presented in Table 1. The results are compared with the available experimental data of similar systems, as data of crystal structure of 2HPNPN is not available8. The calculated C–C bond lengths of the ring vary from 1.36 to 1.45 Å.
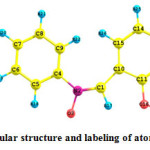 |
Figure1: Molecular structure and labeling of atoms in 2HPNPN |
However, the phenyl ring appears to be a little distorted from its regular hexagonal symmetry as the computed bond lengths: C10–C11, C10–C15, and C4–C5 are larger and C14–C15, C11–C12, C8–C9 are shorter. Breakdown of the regular hexagonal symmetry of the phenyl ring is also evident from the decrease in values of the bond angles C5–C4–C9, C11–C10–C15 and the increase in values of the bond angles C4–C9–C8, C1–C10–C15. The changes in the bond length or frequency and breakdown of regular hexagonal symmetry of the phenyl ring are attributed to the changes in charge distribution on the carbon atoms of the phenyl ring on substitution with hydroxyl group9. The structure of the molecule deviates significantly from planarity because the two phenyl rings are rotated around the C–C(N)–C axes. The central bond angle C10–C11–C12 at the carbonyl group is 120.27◦. The DFT/B3LYP values for all the bond lengths and bond angles have deviation of 1% of the experimental results. The total energy obtained by the DFT structure optimization for the title compound was found to be -707.25896 Hartrees.
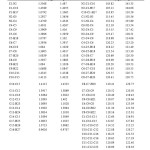 |
Table1: Optimized geometrical parameters for 2HPNPN with different basis set. Click here to View table |
Vibrational Assignments
The compound under investigation of 2HPNPN has 75 normal vibration modes and the detailed vibrational band assignments have been made based on normal co-ordinate vibrational analysis (NCA), normal mode descriptions characterized by PED are depicted in Table 2.
The compound under investigation possesses Cs point group with 75 degrees of freedom. The assignment of the experimental frequencies are based on the observed band frequencies in the FTIR and FT- Raman spectra of the 2HPNPN, confirmed by establishing one to one correlation between observed and theoretically calculated frequencies. For the plots of simulated IR spectrum pure Lorentzian band shape is used with a band width of 40 cm-1. Figure 2 and 3 show comparative representations of theoretically predicted FTIR and FT- Raman spectra at B3LYP/6-311++G(d,p) level of theory, along with experimental FT-IR and FT-Raman spectra respectively. From the PED calculation it was clear that many vibrations have a high degree of mixing with other modes, therefore we provide the following tentative assignments for almost all intense spectral features in the vibrational spectra of the molecule.
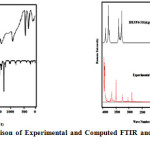 |
Figure2 & 3: Comparison of Experimental and Computed FTIR and FT-Raman Spectra of 2HPNPN. Click here to View figure |
OH-Vibrations
The O-H group gives rise to three vibrations (stretching, in-plane bending and out-of plane bending vibrations). The unbonded or free hydroxyl group of alcohol and phenols11 absorb strongly in the region 3650-3584 cm-1. Sharp free hydroxyl bands are observed only in the vapour phase or in very dilute solution in non-polar solvents. Intermolecular hydrogen bonding increases as the concentration of the solution increases and additional bands12 start to appear at 3550-3200 cm-1. The O-H group vibrations are likely to be the most sensitive to the environment, so they show pronounced shifts in the spectra of the hydrogen-bonded species. In our study, FT-IR band at 3459 cm-1 and FT- Raman band at 3521 cm-1 have been assigned to OH stretching vibration with maximum PED contributing 100%. A comparison of these bands with that of the computed values by B3LYP/6-311++G(d,p) (mode no.75) at 3539 cm-1 are well comparable. The O-H in-plane bending vibrations in phenols, in general, lies in the region 1150-1250 cm-1. The bands in FTIR spectrum at 1216 and 1205 cm-1 and in FT Raman spectrum bands at 1199 and 1182 cm-1 have been assigned to O-H in-plane bending vibration. The theoretically computed values (mode nos. 48-46) by B3LYP/6-311++G(d,p) method show very good agreement with the recorded experimental values, but these modes are appeared as a mixed mode as shown in the Table 2 . The position of band due to O-H out-of plane bending vibration for phenol lies in the region 290-320 cm-1 for free O-H and in the region 517-710 cm-1 for associated O-H11. The frequency increase with hydrogen bond strength because of the larger amount of energy required to twist the O-H bond out-of-plane12. In our present study, the bands which appeared at 594 & 271 cm-1 by B3LYP/6-311++G(d,p) method (mode nos 19 & 09 ) show excellent correlation with the recorded FTIR bands at 593 and 287 cm-1 and in FT Raman at 582 and 265 cm-1 are assigned as O-H out-of plane bending vibration, and appear as mixed mode as shown in Table 2. The NCA confirms that the out-of plane bending vibrations is not a pure mode.
C-H vibration
The hetero aromatic structure shows the presence of C-H stretching vibrations in the region 3100-3000 cm-1, which is the characteristic region for the ready identification of C-H stretching vibrations 18. In this region, the bands are not affected appreciably by the nature of substituents. For our title molecule the band corresponding to C-H stretching vibration at 3376, 3297, 3246, 3207, 3195, 3192, 3182, 3179,3169 and 3149 cm-1 (mode nos. 74-65) by B3LYP/6-311++G(d,p) shows excellent agreement with recorded spectral values as well as literature data19. The PED corresponding to this vibration is pure mode of contributing to 93-96% as shown in Table 2. The aromatic C-H in-plane bending modes of benzene and its derivatives are observed in the region 1300- 1000 cm-1 and are very useful for characterization purpose11. The C-H out-of plane bending modes are usually of weak intensity, arising in the region 1000- 750 cm-1. For our title molecule, the C-H in – plane bending vibrations appear as a weak to medium strong band in FT-IR spectrum at 1490, 1335, 1325, 1276, 1262, 1216, 1205, 1177, 1150 and 1073 cm-1 and 1500, 1346, 1327, 1270, 1199, 1179, 1151, 1116, 1125, 1089,and 1040 cm-1 as a medium to weak band in FT-Raman spectrum shows good agreement with computed wave number by B3LYP/6-311++G(d,p (mode nos 58-40). The PED confirms this vibration are mixed mode as it is evident from Table 2. The C-H out –of plane bending vibrations are strongly coupled vibrations20 and occur in the region 1000-750 cm-1. The aromatic C-H out-of plane bending vibrations of 2HPNPN are assigned to the bands observed at 1022, 1001, 975, 951, 937, 872, and 844 cm-1 in FTIR and 1002, 977 and 864 cm-1 in FT-Raman spectra are well correlated with B3LYP/6-311++G(d,p) methods at 1019-823 cm-1 (mode nos 39-29) with maximum PED contribution of 62%. In our present study all these C-H in-plane and out-of plane bending modes of the title compound are assigned within the said region and are presented in Table 2.
Ring vibrations
The ring carbon-carbon stretching vibrations in benzene ring occur in the region 1430-1625 cm-1. In general, the bands are of variable intensity and are observed at 1625-1590,1575-1590,1470-1540,1430-1465 and 1280-1380 cm-1 from the frequency ranges given by 18 for the five bands in the region. In the present work, the frequencies computed by B3LYP/6-311++G(d,p) method for our title molecule at 1640, 1635, 1610, 1563, 1521, 1521, 1510, 1488, 1478, 1456, 1359, 1351, 1339, 1323, 1273 and 895 cm-1 (mode nos 63-50) have been designated to C-C stretching vibrations9 and are confirmed by PED calculation. The recorded spectrum show very strong to medium intense band in FT-IR as well as in FT-Raman spectra 1723, 1588, 1571, 1490, 1465, 1421, 1363, 1335, 1325, 1276 and 872 cm-1 and 1622, 1598, 1584, 1568, 1500, 1486, 1459, 1430, 1364, 1346, 1327, 1270 and 864 cm-1 are respectively assigned to C-C stretching vibration. The in-plane deformation vibration is at higher wave number than the out of plane vibrations9 gave the frequency data for these vibrations for different benzene derivatives as a result of normal co-ordinate analysis. The bands occurring at 1002, 977, 853, 760, 702, 582 and 380 cm-1 in Raman and in infrared 1001, 975, 857, 844, 726, 731, 669, 657, 593 and 378 cm-1 are assigned to CCC in-plane bending modes of the title molecule. The CCC in–plane bending vibrations of 2HPNPN have been determined from the B3LYP/6-311++G(d,p) method is 1011-659, 594 and 388/ 1015-664, 615 AND 392 cm-1 (mode nos. 37-22, 19 & 11). The CCC out of plane bending modes of 2HPNPN is attributed to the Raman wave numbers are 1089, 1040, 1036, 864, 760, 754 and 702 cm-1. All these assignments are agreed well with the reported literature. These assignments are confirmed by the theoretical observation by B3LYP/6-311++G(d,p) method and PED calculation. The PED contribution for this mode is a mixed mode it is evident from Table 2.
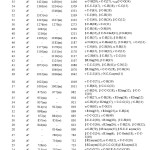 |
Table2: Experimental and B3LYP levels computed Vibrational (cm-1) obtained for 2HPNPN Click here to View table |
Conclusion
A complete vibrational analysis of 2HPNPN has been performed by DFT method with B3LYP/6-311++G(d,p) basis sets. Detailed interpretation of the normal modes has been made on the basis of PED calculations. The optimized geometry is tabulated in comparison with the experimental XRD data and well discussed. Thus the present investigation provides complete vibrational assignments, chemical shifts and electronic properties of the compound.
Reference
- Iwamura M., Inamoto N., Bull. Chem. Soc. Jpn, 1967,40, 703.
- Janzen E.G., Blackburn B.J., J. Am. Chem. Soc,1969, 91,4481–4490,.
- Harbour J.R., Bolton J.R., Bio chem. Biophys. Res. Commun, 1975, 64,803–807,.
- Becke A. D., Phys. Rev,1988, 38(A) ,3098,.
- Frisch M.J., Trucks G.W., Schlegel H.B., et al.,Gaussian 03, Revision E.01 (Gaussian, Inc.,Walling ford CT), 2004.
- Fogarasi G., Pulay P., Durig J. R., (Elsevier,Amsterdam,), 1985,14 ,125.
- Sundius T., J. Mol. Struct, 1990, 218,321,.
- Pulay P., Fogarasi G., Boggs J.E., Vargha A., J.Am. Chem.Soc,1983,105, 7037-7047,.
- Varsanyi G., Adam Hilger,1974, 1-2.
- Socrates G.,” John Wiley, New York”,1987.
- Shimanouchi T., Kakiuti Y., Gamo I., J.Chem.Phys,1956, 25,1245-1251


ISSN Online: 2231-5039

![]()


