Branched Polymers and their Application in Corrosion Inhibition for mild steel in 1M H2SO4 medium
Sounthari. P, Kiruthika. A, Saranya. J, Parameswari. K, Chitra. S*
Department of Chemistry, P. S. G. R. Krishnammal College for Women, Peelamedu, Coimbatore – 641004, Tamil Nadu, India
DOI : http://dx.doi.org/10.13005/ojc/300460
Article Received on :
Article Accepted on :
Article Published : 25 Dec 2014
The adsorption and corrosion inhibiting effect of branched polymers (BATP, BAAZ, BETP & BEAZ) on mild steel in 1M H2SO4 at 30±1˚C was investigated using gravimetric, electrochemical impedance spectroscopy (EIS), and potentiodynamic polarization techniques. The experimental findings revealed that BATP inhibited the corrosion reaction in the acid environment to greater extend compared to BAAZ, BETP and BEAZ. Impedance results indicate that the polymers were adsorbed on the metal/solution interface, while polarization data showed that the polymers behaved mostly as mixed-type inhibitors. Kinetic parameters (activation energy, pre-exponential factor, enthalpy of activation and entropy of activation) as well as thermodynamic parameters (enthalpy of adsorption, entropy of adsorption and Gibbs free energy) were calculated and discussed. Scanning electron microscopy technique was used to confirm the effectiveness of inhibition of mild steel in sulphuric acid medium.
KEYWORDS:Branched polymers; thermal studies; electrochemical techniques; SEM; AAS
Download this article as:| Copy the following to cite this article: Sounthari. P, Kiruthika. A, Saranya. J, Parameswari. K, Chitra. S. Branched Polymers and their Application in Corrosion Inhibition for mild steel in 1M H2SO4 medium. Orient J Chem 2014;30(4). |
| Copy the following to cite this URL: Sounthari. P, Kiruthika. A, Saranya. J, Parameswari. K, Chitra. S. Branched Polymers and their Application in Corrosion Inhibition for mild steel in 1M H2SO4 medium. Available from: http://www.orientjchem.org/?p=6209 |
Introduction
Iron and its alloys find utility in a wide spread spectrum of many industrial units because of its low-cost and excellent mechanical properties. For this reason, the corrosion behavior of these materials has attracted the attention of several investigations. Steel is the most corrosion vulnerable metal. Thus, much attention is given for its protection from the hostile environments. Acid solutions are widely used in industry. The most important areas of application are acid pickling, industrial acid cleaning, acid descaling, and oil-well acidizing [1-3]. Organic compounds containing polar functional groups such as nitrogen, sulphur, and/or oxygen in a conjugated system have been reported to be effective corrosion inhibitors for steel [4-6]. Some of the organic compounds are polymeric in nature and therefore possess multiple active centres. The study of corrosion inhibition by polymers has been on the increase in recent times. Polymers are employed as corrosion inhibitors because the presences of many adsorption centres help them form complexes with metal ions. The formed complexes are adsorbed on the metal surface to form a barrier film which separated the metal surface from the corrosive agents present in the aggressive solution. The improved performances of polymeric materials are attributed to their multiple adsorption sites for bonding with metal surface. The main advantages of polymeric inhibitors are (i) a single polymeric chain displaces many water molecules from the metal surface thus making the process entropically favorable (ii) the presence of multiple bonding sites makes the desorption of polymers a slower process. Furthermore it has been noticed that both the molecular area and molecular weight of the inhibitor are of key importance [7-12]. Some authors have reported on the effectiveness of polymeric corrosion inhibitors [13–17]. According to them, the inhibitive power of the polymers is related structurally to the cyclic rings and heteroatoms which are the major active centres of adsorption.
From the review of literature, it is evident, that practically no work has so far been reported with regard to the inhibition of acid corrosion of mild steel by branched polymers.
This paper is focused on the synthesis, characterization, and potential use of a new class of branched polymers used as corrosion inhibitors for mild steel in 1M H2SO4 medium.
Experimental Work
Synthesis of Branched Polymers
Synthesis of Branched Polyamides
Monomers
Synthesis of Oxadiazole Monomer[18]
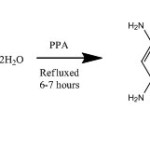
Polyphosphoric acid (0.5mole) was taken in a round bottom flask .To this (0.1mole) of hydrazine hydrate was added in drops, for 15 minutes with stirring, while maintaining the flask on ice water bath. To this mixture 0.1 mole of 3,5-diamino benzoic acid was added and refluxed for 6-7 hours at 1300C and then cooled at 700C. The mixture was poured with stirring into ice. The precipitate obtained was filtered and washed with sodium carbonate in order to remove excess polyphosphoric acid. The 2,5-bis(3,5-diaminophenyl)-1,3,4-oxadiazole (TAPO) was recrystallized from ethanol. The product was characterized by IR spectra.
 |
Scheme Click here to View scheme |
Synthesis of Aromatic Diacid Chloride:[19]
15 g of terephthalic acid was refluxed for about 4 hours with 70 ml of thionyl chloride in the presence of 2 drops of pyridine as a catalyst until a clear solution was obtained. The colourless solid thus obtained was recrystallized from dry benzene. The solid obtained was used as such for polymerization process.
Synthesis of Aliphatic Diacid Chloride:[19]
Crystallized azeloic acid 14.6g and 27ml distilled thionyl chloride was refluxed in an oil bath for 4 hours. After refluxing, the solid acid chloride obtained on cooling was filtered, dried and the acid chloride was used as such.
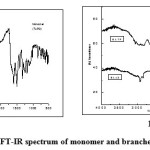 |
Fig1a & b: FT-IR spectrum of monomer and branched polyamides Click here to View figure |
Synthesis of branched polyamides [20]
The poly condensation reaction of 2,5-bis(3,5-diaminophenyl)-1,3,4-oxadiazole (0.1M) with diacid chloride (0.4M) was carried out in N-methyl pyrrolidinone (NMP) using pyridine as an acid acceptor. Poly condensation was run by adding powdered diacid chloride (0.1M) to a solution of the (TAPO) tetraamine with stirring, under nitrogen, at -5˚C. After addition of the diacid chloride, the reaction mixture was kept at -5˚C for 30 minutes, then the temperature was allowed to increase to room temperature by removing the cooling bath, and the solution was further stirred for 4 hours. The polymer solution was diluted to about 5% by addition of more NMP and the polymer was precipitated by pouring into water. It was filtered, washed twice with water and once with ethanol, and dried. The reaction sequence is shown in scheme 1.
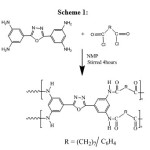 |
Scheme 1 Click here to View scheme |
Synthesis of Branched Polyesters Synthesis of Monomers
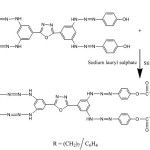
The oxadiazole monomer was synthesized by the reaction of 3,5-diamino benzoic acid with hydrazine hydrate in polyphosphoric acid (PPA) [18]. In the second step, 0.01M of 2,5-bis(3,5-diaminophenyl)-1,3,4-oxadiazole was dissolved in NaOH (10%) and to this solution, the diazonium salt solution(4-amino phenol and NaNO2) was added over a period of 25minutes and the mixture was stirred for three hours. The resulting red-orange suspension was acidified with dilute HCl and the product obtained was filtered, followed by washing with hot water and dilute HCl. Then the product (monomer I) was taken as monomer for polymerization [19].
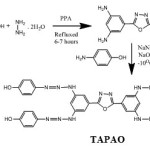 |
Scheme 1B Click here to View scheme |
Synthesis of Aliphatic Diacid Chloride:[19]
The above mentioned procedure was followed for the synthesis of aromatic/aliphatic acid chlorides.
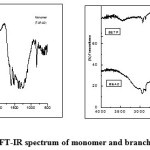 |
Fig.2(a & b): FT-IR spectrum of monomer and branched polyamides Click here to View figure |
Synthesis of Branched Polyesters
Small amount of monomer I was dissolved in 10% NaOH solution. To this small amount of sodium lauryl sulphate was added and stirred for half an hour. Then approximately 5ml of acid chloride was added followed by the addition of chloroform and acetone [19]. The reaction sequence is shown in scheme 2. schem2
 |
Scheme 2 Click here to View scheme |
The structures of the synthesized polymers were confirmed by IR spectra using Shimadzu IR Affinity 1 [Figs.1&2]. NMR spectrum of branched polymers was recorded in DMSO-d6 using a 400 MHz NMR spectrometer (Bruker, DPX-400) [Figs. 3&4]. In order to determine the thermal stability of the polymers, thermograms of the polymers was recorded in dynamic nitrogen atmosphere with a heating rate of 10oC using a Perkin Elmer (TGS-2 model) thermal analyzer [Figs. 5&6].In order to determine the glass transition temperature DSC of the polymers was recorded using PerkinElmer precisely, Diamond differential scanning calorimeter [Figs. 7&8]. The percentage crystallinity of the synthesized polymers was determined by wide angle XRD using Brucker XRD at STIC, CUSAT, Cochin [Fig.9]. fig3
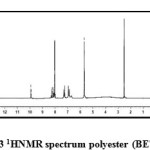 |
Fig3: 1HNMR spectrum polyester (BETP) Click here to View figure |
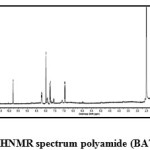 |
Fig4: 1HNMR spectrum polyamide (BATP) Click here to View figure |
 |
Fig5: Thermogravimetric curves of the polyamides Click here to View figure |
Evaluation of Inhibition Efficiency of the Branched Polymers
Non-Electrochemical Techniques
Weight Loss Method
Gravimetric corrosion measurements were carried out according to the ASTM standard procedure. The initial weight of the polished mild steel plates were taken.1M H2SO4 was taken in an 100 ml beakers and the specimens were suspended in triplicates into the solution using glass hooks. Care was taken to ensure the complete immersion of the plates. After a period of 3 hours the plates were removed, washed with distilled water, dried and weighed. From the initial and final masses of the plates (i.e., before and after immersion in the solution) the loss in weight was calculated. The experiment was repeated for various inhibitor concentrations in 1M H2SO4. To study the effect of temperature, the above procedure was carried out at different temperature range i.e., (303-333K) using thermostat with the inhibitor concentration of 1000 ppm.
Atomic Absorption Spectroscopy (AAS)
Atomic Absorption Spectrophotometer (Model GBC 908, Australia) was used for estimating the amount of dissolved iron in the corrodent solution containing various concentrations of polymers in 1M H2SO4 after exposing the mild steel specimen for 3 hours. From the amount of dissolved iron, the inhibitor efficiency was calculated.
Surface Morphology
Surface examinations of mild steel specimens were carried out to understand the surface morphology of mild steel in 1M H2SO4 in the presence and absence of the inhibitors using Medzer biomedical research microscope (Mumbai, India).
Electro Chemical Techniques Impedance Spectroscopy
The electrochemical measurements were performed in a classical three-electrode cell assembly with mild steel rod (exposed area 0.78 cm2) as working electrode, a platinum electrode and saturated calomel electrode as counter and reference electrodes. The measurements were carried out with IVIUM Compactstat Potentiostat/Galvanostat. EIS measurements were carried out at a frequency range of 10 KHz to 0.01Hz with a superimposed sine wave of amplitude 10mV. From the plot of Z1 Vs Z11 the charge transfer resistance (Rct) and double layer capacitance (Cdl) were calculated.
Potentiodynamic polarization
Polarization studies were carried out for the mild steel specimens in 1M H2SO4 in the absence and presence of the inhibitors to evaluate the corrosion kinetic parameters Icorr, Ecorr and Tafel slopes ba and bc. The electrochemical unit and cell used for impedance measurements were also used for polarization measurements. The measurements were carried out from a potential range -200mV to +200mV with respect to the open circuit potential, at a scan rate of 1mV/sec.
Results and Discussion
Characterization of Branched Polymers
The synthesized polymers are presented in Table 1.
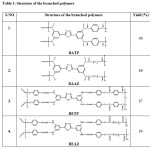 |
Table1: Structure of the branched polymers Click here to View table |
Infra-Red Spectra
The structures of the polymers were confirmed by FT-IR spectra. The FT-IR spectrum of the monomer TAPO shows (Fig. 1a), the presence of bands at 3360 cm-1(-NH2), 1605 cm-1 (-C=N-) and 1019 cm-1(-C-O-C-) respectively confirming the presence of these groups in 1,3,4-oxadiazole ring [21]. Whereas in the IR spectrum of the polyamides (Fig.1b) by disappearance of absorption band at 3360cm-1(-NH2) and appearance of sharp band at 1687-1704 cm-1 for carbonyl group confirmed the formation of the polyamides. Presence of absorption bands at 1473-1578 cm-1 (-C=N-), 3063-2931 cm-1 (-NH stretching) and 1019-1012 cm-1 (-C-O-C-) further confirmed the structure of the polyamides BATP and BAAZ. In the IR spectrum of monomer TAPAO a broad band was observed at 3254 cm-1 which is due to the presence –OH group (Fig.2a). In the polyester (Fig.2b) the broad peak due to –OH disappeared and sharp peak around 1690 cm-1 confirmed the presence of –COO- group. The presence of (-C=N-) and (-N=N-) was observed at frequency 1512-1468 and 1413cm-1 respectively. (-C-O-C-) stretching of 1,3,4-oxadiazole ring appeared at 1020-1090cm-1 which confirmed the structure of the polyesters(BETP and BEAZ).
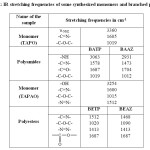 |
Table2: IR stretching frequencies of some synthesized monomers and branched polymers
|
1HNMR Studies
1H-NMR δH (d6 – DMSO), 400 MHz of the polyester BETP (Fig.3) showed peaks at about 9.932 (s, 2H, NH), 8.267-8.246(d, 4H, phenyl), 8.159-8.138 (d, 4H, phenyl), 7.217 – 7.286 (d, 4H, phenyl), 6.872 – 6.936(d, 4H, phenyl), 5.684(s, -CH2-). Branched polyamide BATP (Fig.4) showed peaks at about 9.77 (s, 2H, NH), 8.132-8.146(d, 4H, phenyl), 7.77-7.75 (d, 4H, phenyl), 6.96-6.94 (d, 4H, phenyl) 8.09 (s, -CH2-).
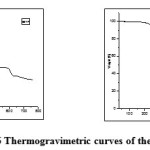 |
Fig6: Thermogravimetric curves of the polyesters Click here to View figure |
Thermal Analysis
Thermal stability of the polymers was studied by therrmogravimetric analysis. Their decomposition, in nitrogen, begins at about 250 ˚C except BATP as indicated by the temperature of 10% weight loss in TGA thermograms (Table 3). Typical therrmogravimetric curves of these polymers are shown in Fig.5 and 6. Thermal stability of polymers was in the order of BETP> BATP>BEAZ>BAAZ. The results obtained from thermal studies showed that the fully aromatic one is more stable than the semi aromatic polymers. The char yields of polymers at 700°C were about 1.1-47.2%. The results are given in Table 3. The results reveal that, synthesized polyesters have high thermal stability than polyamides. The fully aromatic polymers showed better stability than semi-aromatic ones. The higher thermal stability of polymer BETP could be attributed to the incorporation of azomethine, oxadiazole ring and fully aromatic nature of the polymer backbone. The higher thermal stability is due to the intense chain stiffness and intermolecular hydrogen bonding of azomethine groups between the neighboring chains. Introduction of performed oxadiazole ring, phenylation of polymer backbone and symmetry of the structures are the most important structural modifications for increase in thermal stability (char % yield 47.2 at 800˚) [22].The glass transition temperature of the polymers is in the range of 88-151˚C (Table 3).
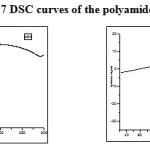 |
Fig7: DSC curves of the polyamides Click here to View figure |
Table 3: Thermal properties of the polymers:
|
Name of Polymers |
Tg (˚C) |
T10 (˚C) |
T20 (˚C) |
Tmax(˚C) |
Char yield (%) |
|
BATP |
148 |
139 |
170 |
380 |
3.2 |
|
BAAZ |
150 |
249 |
320 |
355 |
9.9 |
|
BETP |
151 |
319 |
364 |
634 |
47.2 |
|
BEAZ |
88 |
269 |
284 |
358 |
1.1 |
X-ray studies
Wide-angle X-ray diffraction of the polymers is shown in Fig.9. On the basis of X-ray diffraction studies, it has been found that all the newly synthesized polymers of 1,3,4-oxadiazole are crystalline nature except the polyamide BAAZ which is amorphous.
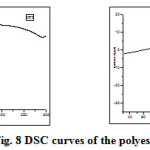 |
Fig8: DSC curves of the polyesters Click here to View figure |
Inhibition Efficiency of the Polymers Weight loss Method
The weight loss experiment is a base line method to observe optimum concentration after which there is no remarkable change in the inhibition efficiency. This may be due to the adsorption of polymers leading to the formation of a smooth layer on metal surface which prevents the contact of metal with the surrounding acidic environment and higher bonding ability of inhibitor on the mild steel surface. Data obtained for mild steel in 1M H2SO4 at 30±1˚C in presence and absence of different concentrations of inhibitors is summarized in Table 4 (Fig. 10).The corrosion rate values of mild steel in 1M H2SO4 decreases as the concentration of polymers increases[23-24]. Adsorption process of an inhibitor depends upon its nature such as planarity of compound, lone pairs present in hetero atoms, multiple bonds etc. The addition of polymers results in rapid formation of a protective layer on metal surface through metal/solution interface [25, 26]. From Table 4, it is also evident that the order of increase in inhibition efficiency is BATP> BAAZ>BETP>BEAZ. This implies that aromatic branched polyamide has the highest inhibition efficiency while aliphatic branched polyester has the least. table4
Table: 4 Inhibition efficiencies of various concentrations of the inhibitors for corrosion of mild steel in 1M H2SO4 obtained by weight loss measurement at 30±10C
|
Name of the inhibitors |
Concentration (ppm) |
Weight loss (g) |
Inhibition Efficiency (%) |
Degree of surface coverage(Ө) |
Corrosion rate (gcm-2h-1) |
|
Blank |
– |
0.2209 |
– |
– |
14.31 |
|
BATP |
10 50 100 500 1000 |
0.1235 0.0722 0.0482 0.0252 0.0116 |
44.1 67.3 78.2 88.6 94.7 |
0.4409 0.6732 0.7818 0.8859 0.9475 |
8.00 4.68 3.12 1.63 0.75 |
|
BAAZ |
10 50 100 500 1000 |
0.1595 0.0964 0.0721 0.0487 0.0362 |
27.8 56.4 67.4 80.0 83.6 |
0.2780 0.5636 0.6736 0.7795 0.8361 |
10.33 6.25 4.67 3.16 2.35 |
|
BETP |
10 50 100 500 1000 |
0.1638 0.1045 0.0836 0.0558 0.0446 |
25.8 52.7 62.2 74.7 79.8 |
0.2585 0.5269 0.6215 0.7474 0.7981 |
10.61 6.77 5.42 3.62 2.89 |
|
BEAZ |
10 50 100 500 1000 |
0.1786 0.1136 0.0887 0.0656 0.0538 |
19.1 48.6 59.8 70.3 75.6 |
0.1915 0.4857 0.5985 0.7030 0.7565 |
11.57 7.35 5.74 4.25 3.48 |
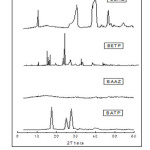 |
Fig9: Powder XRD of polymers Click here to View figure |
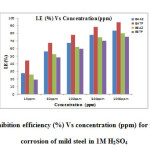 |
Fig10: Plot of inhibition efficiency (%) Vs concentration (ppm) for the inhibition of corrosion of mild steel in 1M H2SO4 Click here to View figure |
Temperature Studies
The effect of temperature on the inhibited acid–metal reaction is very complex, because many changes occur on the metal surface such as rapid etching and desorption of inhibitor and the inhibitor itself may undergo decomposition [27]. The change of the corrosion rate with the temperature was studied in 1M H2SO4, both in absence and presence of branched polyamides and polyesters and is presented in Table 5. The effect of temperature on the corrosion parameter of mild steel in 1M H2SO4 was studied at 303, 313, 323 and 333K. The results indicate that as the temperature increases the corrosion rate increases and inhibition efficiency decreases. The mechanism of inhibition can be deduced by comparing the activation energy in the presence and absence of the inhibitor. The Arrhenius plot and transition state plot were used to determine the activation energy (Ea), activation enthalpy (ΔH°), and activation entropy (ΔS°) for the corrosion of mild steel in 1M H2SO4with and without polymers. The activation energy can be obtained by the Arrhenius equation and Arrhenius plot: formula
![]()
Table: 5 Inhibition efficiencies of 1000 ppm concentrations of the inhibitors for corrosion of mild steel in 1M H2SO4 obtained by weight loss measurement at higher temperature
|
Name of the inhibitor |
Temperature (K) |
Weight loss(g) |
Inhibition efficiency (%) |
Corrosion rate (mpy) |
|
Blank |
303 313 323 333 |
0.0736 0.1350 0.1979 0.2846 |
– – – – |
1.75 0.13 0.19 0.28 |
|
BATP |
303 313 323 333 |
0.0239 0.0564 0.1114 0.1988 |
67.5 58.2 43.7 30.1 |
0.56 1.34 2.65 4.73 |
|
BAAZ |
303 313 323 333 |
0.0262 0.0596 0.1154 0.1976 |
64.4 55.8 41.6 30.6 |
0.62 1.41 2.74 4.70 |
|
BETP |
303 313 323 333 |
0.0286 0.0648 0.1244 0.2178 |
61.1 52.0 37.1 23.5 |
0.68 1.54 2.96 5.18 |
|
BEAZ |
303 313 323 333 |
0.0306 0.0662 0.1292 0.2266 |
58.4 50.9 34.7 20.3 |
0.72 1.57 3.08 5.39 |
where Ea is the activation energy, R is the universal gas constant, K is the pre-exponential constant and T is the absolute temperature.
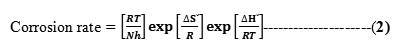
In an attempt to elucidate the enthalpy of activation ΔH0, and entropy of activation ΔS0 the following transition state equation was used:
where h is the Planck constant, N is the Avogadro number, R is the universal gas constant, ΔH0 is the enthalpy of activation, and ΔS0 is the entropy of activation respectively. For this purpose, relationship of log corrosion rate and 1/T is illustrated in Fig.11. The slope and intercept of the straight line are (−ΔH0/2.303R) and (log(R/Nh) + (ΔS0/2.303R)), respectively. These are used to compute the values of ΔH0 and ΔS0, respectively, and the data are compiled in Table 6.
Table: 6 Kinetics/Thermodynamic Parameters of mild steel corrosion in 1M H2SO4
|
Name of the inhibitor |
Ea (kJ) |
-ΔG0ads(kJ) |
-∆H0 kJ/mole |
-∆S0 kJ/mole |
|||
|
303 K |
313 K |
323K |
333 K |
||||
|
Blank |
37.36 |
– |
– |
– |
– |
– |
– |
|
BATP |
59.15 |
31.12 |
31.10 |
30.52 |
29.84 |
84.09 |
0.75 |
|
BAAZ |
56.52 |
33.81 |
32.82 |
31.24 |
29.90 |
256.75 |
1.27 |
|
BETP |
56.68 |
33.42 |
32.39 |
30.71 |
28.90 |
293.72 |
1.39 |
|
BEAZ |
56.08 |
33.11 |
32.28 |
30.42 |
28.40 |
307.51 |
1.44 |
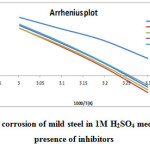 |
Fig11: Arrhenius plot of corrosion of mild steel in 1M H2SO4 medium in the absence and presence of inhibitors Click here to View figure |
From Table 6, it is clear that the activation energy Ea increases in the presence of the inhibitors. Increase in Ea (for blank 37.36 kJ and in the presence of inhibitors is 56.08-59.15kJ) with the addition of polymers indicate that physical (electrostatic) adsorption occurred in the first step which is found during adsorption processes and partially due to desorption of adsorbed inhibitor molecules from mild steel surface. The branched polymers are organic nitrogen compounds that easily get protonated to a cationic form in acid medium. The Ea value was greater than 20 kJ mol-1 in the presence of the inhibitor, which reveals that the entire process is controlled by the surface reaction [28]. Calculated free energies (ΔG°ads) are given in Table 6. The negative values of ΔG°ads indicate spontaneous adsorption of polymers onto the mild steel surface [29] and strong interactions between inhibitor molecules and the metal surface [30]. Generally, values of ΔG°ads up to -20 kJ mol-1 are consistent with the strong electrostatic interaction between charged molecules and charged metal (physisorption), while those around -40 kJ mol-1 or higher are associated with chemisorption as a result of the sharing or transfer of electrons from organic molecules to the metal surface to form a coordinate bond [31]. In the present study, the estimated ΔG°ads values is around -28-33 kJmol-1 indicating that the adsorption mechanism of the polymers tested may be of mixed type involving physisorption and chemisorption, wherein physisorption predominates. The calculated values of heat of adsorption (ΔH°) and entropy of adsorption (ΔS°) are listed in the Table 6. The heat of adsorption (ΔH°) can be considered as the standard adsorption heat (ΔH°) under the experimental conditions [32, 33]. The negative values of heat of adsorption (ΔH°) indicate that the adsorption of both inhibitors is an exothermic process. It is reported that an exothermic adsorption process resembles either physisorption or chemisorption, while the endothermic adsorption process is applicable to chemisorptions [34].The negative values of (ΔH°) also suggest that inhibition efficiency (I.E.) decreased with an increase in temperature. This is due to desorption of adsorbed inhibitor molecules from the mild steel surface at higher temperatures. The value of entropy of adsorption (ΔS°) is negative for polymer adsorption. Since adsorption is an exothermic process, it is always supported by the decrease in entropy, which can be clearly depicted for polymers from the calculated values. Negative values of entropies ΔSo imply that the activated complex in the rate determining step represents an association rather than a dissociation step, meaning that a decrease in disordering takes place on going from reactants to the activated complex.
Adsorption Isotherm
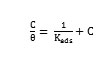
The adsorption characteristics of the inhibitors were also investigated by fitting data obtained for degrees of surface coverage into different adsorption isotherms including Langmuir, Frumkin, Temkin, El awardy et al., Bockris-Swinkel, Flory-Huggins and Fruendlich adsorption isotherms. The test revealed that the adsorption characteristic of the inhibitors is best described by Langmuir adsorption isotherm. The Langmuir adsorption model relates the degree of surface coverage (θ) to the concentration of an inhibitor as follows [35],
where, Kads is the adsorption coefficient, C is the molar concentration of the inhibitor. Fig. 12 represents the Langmuir isotherm plots for all the inhibitors. A straight line was obtained for the plot of C/Q versus C with slope close to one. The regression coefficient (R2 > 0.9999) suggests that the adsorption of inhibitor on the mild steel surface obeyed Langmuir isotherm. This isotherm assumes that the adsorbed molecules occupy only one site and there are no interactions with other adsorbed species [36, 37].
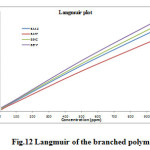 |
Fig12: Langmuir of the branched polymers Click here to View figure |
Electrochemical Measurements Polarization Studies
The inhibitive effect of branched polyamides and polyesters were studied by using potentiodynamic polarization measurements. Cathodic and anodic polarization curves of mild steel in 1M H2SO4 solution, in the absence and presence of various concentrations of polyamide (BATP) is shown in Fig.13. Whereas, their corresponding electrochemical parameters such as corrosion current density (Icorr), anodic (ba) and cathodic (bc) Tafel constants, corrosion potential (Ecorr) and inhibition efficiency (IE) are listed in Table 7. From Fig.13, it is evident that both the cathodic and anodic curves showed lower current density values in the presence of both polymers than those recorded in their absence (BATP, BAAZ, BETP and BEAZ). This confirmed the adsorption of polymers on the mild steel/acid solution interface and consequently inhibits the corrosion process [38, 39]. Moreover, Fig. 13 also suggest that the studied polymers influence both anodic as well cathodic corrosion processes; this statement is further supported from the values of anodic (ba) and cathodic (bc) Tafel constants and corrosion potential (Ecorr). From Table 7, it is evident that the addition of both polymers changes the values of Ecorr towards anodic direction both ba and bc are affected but ba to a greater extent, hence polymers can be considered as mixed type but slightly anodic in nature. However, on the addition of polymers the maximum displacement in Ecorr values was 69 mV which suggests that inhibitors act as mixed type inhibitors with predominant anodic effectiveness as it is well known that if the displacement in Ecorr is >85 mV, the inhibitor is recognized as a cathodic or anodic type inhibitor and if the displacement of Ecorr is <85 mV, the inhibitor is of mixed type [40, 41].
Table: 7 Corrosion parameters for corrosion of mild steel with selected concentrations of the inhibitors in 1M H2SO4 by potentiodynamic polarization method
|
Name of the inhibitor |
Concentration (ppm) |
Tafel slopes(mV/dec) |
Ecorr (mV) |
Icorr (mAmp/cm2) |
Inhibition efficiency (%) |
|
|
ba |
bc |
|||||
|
Blank |
– |
52 |
112 |
-467.4 |
1569 |
– |
|
BATP |
100 500 1000 |
77 59 63 |
119 144 155 |
-530.8 -490.1 -483.4 |
792.1 445.1 46.0 |
49.5 71.6 97.1 |
|
BAAZ |
100 500 1000 |
68 63 44 |
149 151 133 |
-501.7 -489.5 -461.5 |
581.7 427.7 90.3 |
62.9 72.7 94.2 |
|
BETP |
100 500 1000 |
67 65 50 |
148 167 135 |
-495.1 -485.6 -469.7 |
522.9 448.9 172.4 |
66.7 71.4 89.0 |
|
BEAZ |
100 500 1000 |
69 72 76 |
148 127 117 |
-509.1 -514.2 -524.8 |
621.0 693.6 729.8 |
60.4 55.8 53.5 |
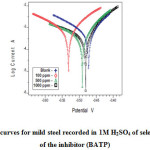 |
Fig13: Polarization curves for mild steel recorded in 1M H2SO4 of selected concentrations of the inhibitor (BATP) Click here to View figure |
Electrochemical Impedance Spectroscopy
Electrochemical impedance spectroscopy is a well-established and powerful tool in the study of corrosion [42]. It provides information on the metal surface properties, kinetics of the electrochemical processes at the metal/solution interface and gives evidence of inhibitor adsorption (i.e. mechanistic information) from the impedance spectra. The corrosion inhibition results of mild steel in 1M H2SO4 solution in the presence and absence of polymers was studied by EIS measurements at room temperature after an exposure period of 30 minutes. Figs.14 and Table 8 shows the Nyquist plot obtained from impedance data. The impedance spectra depicted depressed semicircles. These semicircles are referred to as capacitive loops. The diameter found by the intercept of each of these loops and the horizontal Zreal axis defines the charge transfer resistance (Rct). The value of charge transfer resistance obtained is a measure of electron transfer across the metal surface and is inversely proportional to corrosion rate. Hence, a large Rct value indicates a strong resistance against corrosion. In the present study Rct values increased with increase in inhibitors concentration. This result indicates a decrease in the reactive surface area caused by the adsorption of the inhibitor on the mild steel surface, thus preventing the corrosion process.
Table: 8 AC-impedance parameters for corrosion of mild steel for selected concentrations of the inhibitors in 1M H2SO4
|
Name of the inhibitor |
Concentration (ppm) |
Rt (ohm cm2) |
Cdl(µF/cm2) |
Inhibition efficiency (%) |
|
Blank |
– |
11.06 |
27.8 |
– |
|
BATP |
100 500 1000 |
34.72 51.05 79.63 |
28.6 32.2 25.4 |
68.2 78.3 86.1 |
|
BAAZ |
100 500 1000 |
29.83 42.93 50.82 |
31.0 27.5 21.3 |
62.9 74.2 78.2 |
|
BETP |
100 500 1000 |
22.16 31.09 43.78 |
31.2 30.8 32.6 |
37.2 64.4 74.7 |
|
BEAZ |
100 500 1000 |
17.12 22.97 27.41 |
27.0 29.5 31.7 |
35.4 51.9 59.7 |
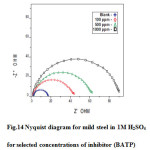 |
Fig14: Nyquist diagram for mild steel in 1M H2SO4 for selected concentrations of inhibitor (BATP) Click here to View figure |
Atomic Absorption Spectrophotometric Studies (AAS)
The inhibitor efficiency (%) of the polyesters (BETP & BEAZ) and polyamides (BATP & BAAZ) were calculated from the percentage of Fe dissolved obtained from AAS and the data are presented in (Table 9). The inhibitor efficiency (%) obtained by this technique was found to be in good agreement with that obtained from the conventional weight loss method.
Table 9: Amount of dissolved iron present in the corrosive solution with and without inhibitors in 1M H2SO4 measured using atomic absorption spectrophotometer
|
Name of the inhibitor |
Concentration (ppm) |
Amount of iron content (mg/l) |
Inhibition efficiency (%) |
|
|
Blank |
1304.96 |
– |
|
BATP
|
100 1000 |
564.84 69.04 |
56.7 94.7 |
|
BAAZ |
100 1000 |
688.72 203.86 |
47.2 84.4 |
|
BETP |
100 1000 |
736.88 294.60 |
43.5 77.4 |
|
BEAZ |
100 1000 |
853.64 303.82 |
34.6 76.7 |
Surface Morphology
Scanning electron microscope (SEM) has become an important tool to study surface morphology of corroded and uncorroded metals [43]. To establish the interactions of inhibitors with mild steel samples, the SEM images were recorded for mild steel in the absence and presence of optimum inhibitor concentration and results are shown in Fig. 15. Fig. 15a represents the SEM image of mild steel in the absence of polymers which is characterized by very rough surface with pits and cracks. This suggests that mild steel surface is strongly damaged by acidic solutions in the absence of the polymers. On the other hand, Fig. 15b represents the SEM micrographs of mild steel in the presence of optimum concentration (1000 ppm) of inhibitor (BATP) in 1M H2SO4 for a period of 3 hrs. The image suggested that mild steel surface is fully covered with the BATP molecules and a protective BATP film is formed. This finding supports the weight loss, impedance and polarization studies.
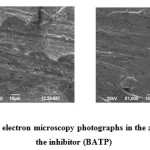 |
Fig15(a&b): Scanning electron microscopy photographs in the absence and presence of the inhibitor (BATP) Click here to View figure |
Mechanism of Inhibition
Adsorption of polymers on metal surface depends on parameters such as mode of adsorption, active sites on metal surface, planarity of molecules, free lone pairs present on heteroatoms, concentration of inhibitor etc. Normally the adsorption of inhibitor on metal surface and formation of protective layer to prevent corrosion can be understood by three ways. The first is the electrostatic interaction of protonated inhibitor molecules with already adsorbed sulphate ions (physisorption). At lower concentration, protonated molecules get adsorbed on the surface of mild steel through electrostatic interaction. With increasing concentration protonated inhibitor molecules turn to neutral molecules due to slower rate of hydrogen evolution having free lone pair electrons and promote chemical adsorption. Second way deals with the free lone pairs of heteroatoms and vacant d orbitals of Fe of mild steel (chemisorption). Third method is the interaction of d-electrons from Fe of mild steel with the vacant orbital of inhibitor molecule (reterodonation) [44, 45]. The inhibitor molecules having d orbital electrons have both the tendency to donate and to accept free electrons and form stable chelates and behave as effective inhibitors. The presence of N-atom in the polymers form pπ–dπ bonds resulting in transfer of 3d-electrons from Fe atom to the vacant 2p orbital of N-atom, which enhances adsorption process on metal surface due to strong back bonding. The studied polymers have hetero atoms, aromatic rings, long chain, which get adsorbed on metal surface and form a layer to prevent direct contact of metal with aggressive media and slow down corrosion rate of metal [46].
Conclusion
Branched polymers have been synthesized and used as corrosion inhibitors for mild steel in 1M sulfuric acid medium. The results from FTIR, TGA, DSC and powder XRD studies confirmed the formation of branched polymers. The results of weight loss and electrochemical measurements show that branched polyamides have an excellent inhibiting property for acidic corrosion of mild steel. Inhibition efficiency increases in the order BATP, BAAZ, BETP, and BEAZ. BATP is the best inhibitor with inhibition efficiency ≈ 95%. This is generally attributed to the increase in the number of adsorption sites which allow higher inhibition. The synthesized branched polymers obey Langmuir adsorption isotherm. Potentiodynamic polarization measurements showed that all the polymers function as mixed-type inhibitors, retarding both anodic and cathodic reactions at the same time. The results obtained from different techniques were in good agreement with each other. The relative surface coverage of polyamide (BATP) has been verified by SEM measurements.
References
- E. Bayol, E.; A. A. Gurten, A. A.; Dursun, M.; K. Kayakirilmaz, K, Acta Phys. Chim. Sin. 2008, 24, 2236
- Alsabagh, A. M.; Migahed, M. A.; Awad, H. S, Corros. Sci. 2006, 48, 813
- Srikanth, A. P.; Lavanya, A.; Nanjundan, S.; Rajendran, N, Appl. Surf. Sci. 2006, 253, 1810
- Hojatollah Jafari, Iman Danaee, Hadi Eskandari, Mehdi Rashvand Avei, Ind. Eng. Chem. Res. 2013, 52, 6617
- Sitashree Banerjee, Abhinay Mishra, Madan M. Singh, Biswajit Maiti, Biswajit Ray, Pralay Maiti, RSC Advances. 2011, 1, 199
- Arukalam, I.O.; Alaohuru, C.O.; Ugbo, C.O., Jideofor, K.N.; Ehirim, P.N.; Madufor, I.C, Int. J. Applied Sci. Eng. Res. 2014, 3, 241.
- Manivel, P.; Venkatachari, G, J. Appl. Polym. Sci. 2007, 104, 2595
- Amin, M. A.; Abd El-Rehim, S. S.; El-Sherbini, E. E. F.; Hazzazi, O. A, Corros. Sci. 2009, 51, 658
- Chetouani, A.; Medjahed, K.; Sif-Lakhdar, K. E.; Hammouti, B.; Benkaddour, M.; Mansari, A, Corros. Sci. 2004, 46, 2421
- Jeyaprabha, C.; Sathiyanarayanan, S.; Phani, K. L. N.; Venkatachari, G, Appl. Surf. Sci. 2005, 252, 966
- Jeyaprabha, C.; Sathiyanarayanan, S.; Phani, K. L. N.; Venkatachari, G, J.Electroanal. Chem. 2005, 585, 250
- Srivastava, S.; Banerjee, M.; Singh, M, J. Appl. Polym. Sci. 2010, 116, 810
- Amin, M.A.; Abd EI-Rehim, S.S.; El-Sherbini, E.E.F.; Hazzazi, O.A.; Abbas, M.N, Corros. Sci. 2009, 51, 658
- Jeyaprabha, C.; Sathiyanarayanan, S.; Phani, K.L.N.; Venkatachari, G, Appl. Surf. Sci. 2005, 252, 966
- Umoren, S.A, Open Corros. J. 2009, 2,175
- Shukla, S.K.; Quraishi, M.A.; Prakash, R, Corros. Sci. 2008, 50, 2867
- Yurt, A.; Buetuen, V.; Duran, B, Mater. Chem. Phys. 2007, 105, 114
- Bahrami, M. J.; Hosseini, S. M. A.; Pilvar, P, Corros. Sci. 2010, 52, 2795
- Ahmad, I.; Prasad, R.; Quraishi, M. A, Corros. Sci. 2010, 52, 1474
- Satapathy, A. K.; Gunasekaran, G.; Sahoo, S. C.; Amit, K.; Rodrigues, P. V, Corros. Sci. 2009, 51, 2848
- Kalaiselvi, P.; Chellammal, S.; Palanichamy, S.; Subramanian, G, Mater. Chem. Phys. 2010, 120, 643
- Ion Sava, Mariana Dana Iosip, Maria Bruma, CorneliuHamciuc, Jenifer Robison, Lidia Okrasa and TadeuszPakula, European polymer journal. 2003, 39, 725
- Mylsamy Sivadhayanithy, Lingam Ravikumar, T.Ramachandran, Int. J. Appl. Chem. 2007, 3, 245
- Elena Hamciuc, CorneliuHamciuc, Ion sava, Maria Bruma, European Polymer Journal. 2001, 37, 287
- Mariana Dana Iosip, Maria Bruma, Inga Ronova, Marta Szesztay, Peter Muller, European Polymer Journal. 2003, 39, 2011.
- Mylsamy Sivadhayanithy, Lingam Ravikumar, T. Ramachandran, J. Chil. Chem. Soc. 2007, 52, 1230
- Oguzie, E.E.; Enenebeaku, C.K.; Akalezi, C.O.; Okoro, S.C.; Ayuk, A.A.; Ejike, E.N, J. Colloid Interface Sci. 2010, 349, 283
- Achary, G.; Sachin, H.P.; Naik, Y.A.; Venkatesha, T.V, Mater. Chem. Phys. 2008, 107, 44
- Banerjee, S.; Srivastava, V.; Singh, M.M, Corros. Sci. 2012, 59, 35
- Singh, A.K.; Shukla, S.K.; Quraishi, M.A.; Ebenso, E.E, J. Taiwan Inst. Chem. Eng. 2012, 43, 463
- Pavithra M, krishnegowda,; Venkatarangaiah T. Venkatesha,; Punith Kumar M. Krishnegowda,; Shylesha B. Shivayogiraju, Ind. Eng. Chem,Res. 2013, 52, 722
- Herrag, L.; Hammouti, B.; Elkadiri, S.; Aouniti, A.; Jama, C.; Vezin, H.; Bentiss, F, Corros. Sci. 2010, 52, 3042
- Tang, L.; Li, X.; Lin, L.; Mu, G.; Liu, G, Mater. Chem. Phys. 2006, 97, 301
- ZOR. Sibel.; Pinar Dogan.; Birgul Yazici, Corros. Rev. 2005, 23 , 217
- Moretti, G.; Guidi, F.; Grion, G, Corros. Sci. 2004, 46, 387
- Li, X. H.; Deng, S. D.; Fu, H.; Mu, G. N, Corros. Sci. 2008, 50, 2635
- Zhao, T. P.; Mu, G. N.; Corros. Sci. 1999, 4, 1937
- Durnie, W.; De Marco, R.; Kinsella, B.; Jefferson, A, J. Electrochem. Soc. 1999, 146, 1751
- Ehteram A. Noor.; Aisha H. Al-Moubaraki.; Mater. Chem. Phys. 2008, 110, 145
- Gulsen Avci, Colloids and Surfaces A: Physicochemical and Engineering Aspects 2008, 317, 730
- Esmaeel Naderi.; Jafari, A.H.; Ehteshamzadeh, M.; Hosseini, M.G, Mater. Chem. Phys. 2009, 115, 852
- De Sousa, F.S.; Spinelli, A, Corros. Sci. 2009, 51, 642
- Gopiraman, M.; Sakunthala, P.; Kesavan, D.; Alexramani, V.; Kim, I.S.; Sulochana, N, J. Coat. Technol. Res. 2012, 9, 15
- Sanatkumar, B.S.; Nayak, J.; Shetty, A. N, Int. J. Hydrogen Energy. 2012, 37, 9431
- Ahamad, I.; Gupta, C.; Prasad, R.; Quraishi, M.A, J Appl. Electrochem. 2010, 40, 2171
- Ahamad, I.; Prasad, R.; Quraishi, M.A, Corros. Sci. 2010, 52, 1472.

This work is licensed under a Creative Commons Attribution 4.0 International License.
![]()
A New Edition of Web of Science
Journal Impact Factor
2022: 0.5
Five Year: 0.8
Journal is Indexed in

Cabells Whitelist
![]()


