Study of quality of water pond sebkha Oran in period of low-water mark using physic-chemical parameters with Chadha’s diagram and Larson Index
Boualla Nabila
Department Civil Engineering, Laboratory Materials, Soil and Thermal, University of Science and Technology, USTOMB, Oran 31000, Algeria
DOI : http://dx.doi.org/10.13005/ojc/300324
Article Received on :
Article Accepted on :
Article Published : 02 Sep 2014
The present study deals with the physical and chemical characteristics of the water of sebkha of Oran ponds. In an attempt to study the environmental impact on water quality, fifty samples were collected and analyzed. The values obtained were compared with values recommended in water quality standards by WHO. The findings of the study show that the water resources in the study area are evolved from Mg-HCO3 water types to Mg-Cl- water types through Mg-HCO3-Cl- water types. The salinization is the main source of the pollution in this basin. It is related to aquifer conditions.
KEYWORDS:Salinity; Ground water quality; Physic-chemical parameters; Piezometry; Chadha’s diagram; Larson Index.
Download this article as:| Copy the following to cite this article: Nabila B. Study of quality of water pond sebkha Oran in period of low-water mark using physic-chemical parameters with Chadha’s diagram and Larson Index. Orient J Chem 2014;30(3). |
| Copy the following to cite this URL: Nabila B. Study of quality of water pond sebkha Oran in period of low-water mark using physic-chemical parameters with Chadha’s diagram and Larson Index. Orient J Chem 2014;30(3). Available from: http://www.orientjchem.org/?p=4518 |
Introduction
The past or present human activities, especially industrial, agricultural and domestic as well as, release into the environment of products and potentially dangerous substances, pollutants or contaminants known. These are released into natural environments (water and soil). Their presence, particularly in groundwater, a problem at the interface of disciplinary ecosystems and water resources. In fact, attention has turned increasingly to underground aquatic environments, including groundwater and runoff in streams with the development of appropriate methods, which have been developed (Cvetkova, 1968; Boutin and Boulanouar, 1983).
The study area has experienced in recent years some economic growth, particularly agricultural, after application of the National Development of Agriculture (PNDA) in July 2000. This, on the one hand, increased demand for water and other water resources exposed to different pollution resulting from agricultural activity. In addition, the lack of connection to sewerage systems in several cities, including, spills are made to various natural depressions (Morsly daya) and to large brackish water retention (sebkha). These direct discharges of wastewater into the natural environment generate multiple nuisances. Its effluents that have probably reached the groundwater.
During our field trips, we were able to identify the specific sources of pollution, which can be summarized as follows: -The animal husbandry (sheep, cattle and poultry).
-The urban waste, that discharge of domestic wastewater in the watershed without any treatment. -The wild-waste landfills
For the study area, there are to date very little data. The long-standing and ad hoc investigations were conducted by various researchers, which are mounted salinity of groundwater in the middle deteriorating water quality aquifer whose million-Plio-Quaternary watershed is located in formations of limestone algae and alluvial formations. It is mainly fed by precipitation and by faults conditioning and promoting the flow of groundwater. Moreover, in countries with temperate climates, arid or semi-desert, water sources are an important part of the hydraulic heritage of the country. They play as a basis for the development of agriculture. Indeed, these sources, with natural water quality, are very vulnerable to any kind of pollution due to human actions and the influence of climate variability on the quantity and quality of surface runoff feeding areas of water supply from these sources.
The aim of this paper is to establish correlations between the physicochemical properties of the aquifer system, their representation in the correlation matrix and reporting features have helped to define the main features characterizing salinity (content, origin and evolution). Thus, the study and monitoring of physic-chemical quality of water from these sources prove to be of paramount importance particularly in terms of decision support for their exploitation for drinking water supply or irrigation water.
The waters of the aquifer in the study area have a moderate to relatively high salinity. The latter has even found a bad drinking water. We saw the need to perform this type of evaluation, assuming that the flow reduction from these sources, noted in the last decade, could be a major cause of the change in its physic-chemical properties. The results of this work can be used as a reference for further work.
Materials and methods
Presentation of the study area (Figure 1)
The Great Watershed sebkha Oran covers an area of 1878 km² including 298 km² (including sebkha). Sebkha for itself (the lake) with an area of 298 km ², stretches over 40 km long and 6 to 13Km wide. Located in the Central Coastal Oran watershed is bounded by two highlights: North of the Djebel Murdjadjo (530 m). The south by Mount Tessala (1061 m). To the east the plain Tlelat Oued. To the west by oued Mellah.
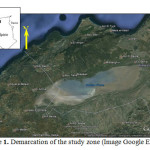 |
Fig1: Demarcation of the study zone (Image Google Earth 2013)Click here to View Figure |
Geology
Geological studies Watershed sebkha Oran revealed a structure consisting of two major groups: a substrate sheet antes up the north by the massive cleavage indigenous (Murdjadjo Mountains) and south by a complex of allochthonous units (or webs) of Tessala Mountains (Figure 2). The entire series is referenced in the sebkha and extends around the Quaternary primary. The formations are lateral variations in thickness and facies of mineralization of water from different aquifers. Thus, geophysical electrical connections can be highly variable in space.
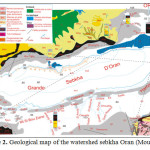 |
Fig2: Geological map of the watershed sebkha Oran (Moussa, 2006)Click here to View Figure |
Hydrogeology (Figure 3)
The main aquifer is located within the Miocene limestone. This web is best known on the north side where it often forms a single aquifer with the overlying alluvium. Currently, the exploitation of the water is very important and mineralization increases, leading to a proposed desalination Brédéah. This sheet is partly fueled by the karst that develops in the Limestone Mountains of Murdjadjo. There are no known extensions in the sebkha. Southeast of the complex sebkha confined aquifer Mio-Pliocene is the second reservoir area. These are mainly marl and calcareous sandstone. The mineralization is still relatively low (2 g/l on average). Its thickness varies greatly (0 to 150 m). Quaternary alluvium host small mineralized layers (4 to 15 g/l). Thus, the contrasts will be weak to nonexistent power within the enclosing conductive clay. The structural geological studies have led to split into two sebkha hydrogeological units separated by a structural anticline: hydrogeological unit north (south Murdjadjo – northern part of the sebkha) with a deep groundwater contained in a limestone aquifer may be in hydraulic continuity with sandstone aquifers of the plateau of Oran (Pliocene or early Pleistocene), and; south hydrogeological unit (M’léta) with a deep groundwater contained in the Pliocene marine sandstones locally in hydraulic continuity with Miocene limestone facies type Murdjadjo (hypothesis verified on several holes). The tanks are made of limestone and sandstone aquifers over a hundred meters thick resting on a substratum of marl of low permeability.
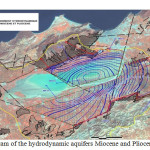 |
Fig3: Diagram of the hydrodynamic aquifers Miocene and Pliocene (Sogreah, 2004)Click here to View Figure |
The deep aquifers of Pliocene sandstone of the plain of Tlélat and the eastern edge of the M’léta contain considerable reserves (750 Hm3). The renewal of this resource is low (5 Hm3/ year) because of the endorheic watershed. The waters of the deep aquifers are acceptable mineralization (1 to 2.5 g/l), and a resource of much better quality than that currently used by the station Brédéah.
In the plain of Tlélat, there are a large number of deep wells, the oldest dating from 1942, and gave interesting operating speeds: 20 to 50 l/s. The operation of this sheet from boreholes rehabilitated and new structures could provide additional resources to the city of Oran. These pumps will increase the flow gradients and seek new resources, particularly those that contribute at this time to recharge quaternary edge of the watershed (Tlélat, Tessala and edge). The watershed has a capacity of sebkha resource estimated at: 22 Hm3/year groundwater.
Piezometry
A piezometry latest was conducted by the Laboratory of Geology, during the high water mark of 27/04/2003 to 04/05/2003 (not weather) (Figure 4), 80 water points were recorded with an interval of 500 m between two successive points in the region of Ain El Beida to El Amria, with a higher concentration at the zone-Misserghin Boutlelis. The majority of points of water wells was specific enough recent, shallow and conventional for: human consumption or livestock or irrigation of crops mainly vegetables and fruit trees.
The route the groundwater was relatively complex, since the surface is uneven. The flow direction is generally from north to south, or limestone outcrops to the sebkha. The water level varies from 130 m to 75 m north to south. We note that the hydraulic gradient is not constant. It varies depending on the direction of flow. North of douar Salah, the hydraulic gradient is 0024. Beyond the RN 2, we see a significant decrease in the value of the gradient does not reach 0001, near the sebkha. We are dealing with a non-uniform flow, hyperbolic profile. Given the piezometric profile and the type of flow, we can say that it is a radial ply divergent.
In the region of Brédéah, we note the presence of a closed curve; it is a depression of the piezometric level reaching 77 m despite the contribution of limestone formations. This depression is the result of intense pumping station pumping Brédéah, which supplies part of the city of Oran. The presence of this depression can cause a reverse flow, is from south to north (towards the pumping station).
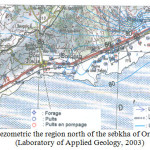 |
Fig4: Map piezometric the region north of the sebkha of Oran during low water (Laboratory of Applied Geology, 2003 Click here to View Figure |
In the southern region, several groundwater piezometric maps of Quaternary alluvium have been established for the plain of M’léta. The first map was produced in 1968 and a second in 1986 by Hassani. Studies show that piezometric groundwater surface runoff quaternary headed north towards the sebkha. The flows are fast upstream, they are becoming progressively slower as it will pin the sebkha.
The recharge of M’léta is mainly from rain water seeping across the catchment. The oueds are involved mainly in charge. This is facilitated by good permeability formations formed of coarse alluvial (alluvial fans oueds).
A side feed from limestone outcrops appear to exist and this is particularly visible in the area where Tafaraoui hydraulic-head isopleths are parallel to the limestone outcrops.
Feeding areas are upstream of the M’léta preferential recharge areas. Between the “high water” and “low water”, the beats of wells in the area reached 2 to 4 meters. Farther downstream in the plains, these fluctuations are more than one meter (Figure 5).
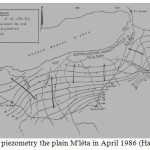 |
Fig5:The piezometry the plain M’léta in April 1986 (Hassani, 1987) Click here to View Figure |
To better characterize the groundwater quality in the dry season, a sampling network was chosen to allow the acquisition of representative data on the spatial and temporal variability. This network covers the entire watershed upstream to downstream. It consists of a set of points of water wells, boreholes and springs. The parameters that have been in situ measurement are: pH and conductivity in the laboratory: Cl–, SO4-2, HCO3–, Ca+2, Mg+2, Na+ and K+ (Table 1, Figure 6).
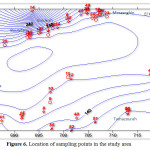 |
Fig6: Location of sampling points in the study area Click here to View Figure |
results and discussion
The physic-chemical parameters are considered as the most important principles in the identification of the nature, quality and type of the water (fresh, brackish, saline) for any aquatic ecosystem. The results of the analysis were summarised in the Table 1 and compared with WHO levels.
The chemical compositions of the groundwater samples are summarized in Table 1. The pH values varied from 5.1 to 7.6 indicating that the water was slightly alkaline, EC values of the groundwater samples of the studied area ranged from 720 to 15820 μS/cm. According to Table 1 it is clearly observed that the order of abundance of the major cations is Mg+2< Na+< Ca+2 and all samples exceeded the desirable limit of Mg+2 for drinking water (150 mg/l), 93% of them exceeded that of Na+ (250 mg/l) and 53% of them exceeded that of Ca+2 (250 mg/l) (WHO, 2011). The abundance of the major anions is HCO3– 2 < Cl– < SO4-2 and all of the samples exceeded the desirable limit of Cl– and SO4-2 (250 mg/l), and bicarbonate values just three samples were less than the prescribed one (WHO, 2011).
Hydrochemical concepts can help to elucidate mechanisms of flow and transport in groundwater systems, and unlock an archive of paleoenvironmental information (Hem, 1991; Pierre et al., 2005). The hydrochemical evolution of groundwater can be understood by plotting the major cations and anions in the Chadha’s diagram (Chadha, 1999). This diagram is a somewhat modified version of the Piper diagram (Piper, 1944) and the expanded Durov diagram (Durov, 1948). In Chadha’s diagram (Figure 7), the difference in milliequivalent percentage between alkaline earths (Ca+2+ Mg+2) and alkali metals (Na+ + K+), expressed as percentage reacting values, is plotted on the X axis and the difference in milliequivalent percentage between weak acidic anions (CO32- + HCO3– 2) and strong acidic anions (Cl– + SO42-) is plotted on the Y axis.
| Physical and chemical parameters |
Unit |
Average |
Min. |
Max. |
WHO Standard |
Equipment and methods |
| pH |
6.9 |
5.1 |
7.6 |
6.5 to 8.5 |
pH-portable meter, HANNA instrument HI9811 | |
| CE |
(µS/m) |
5944.8 |
720 |
15820 |
N/A |
pH-portable meter, HANNA instrument HI9811 |
| Cl– |
(mg/l)
|
2473 |
994 |
7810 |
250 |
Ionogramme Easy lyte Na/K/Cl, 800 ml, MEDICA 001384-001 R2 Analyser, 12160/12014-05 |
| SO4-2 |
314 |
294.1 |
400.4 |
250 |
Spectrometry (Spectrometre Optizen 2120 UV) | |
| Na+ |
864 |
124.20 |
4687.40 |
250 |
Ionogramme Easy lyte Na/K/Cl, 800 ml, MEDICA 001384-001 R2 Analyser, 12160/12014-05 | |
| K+ |
9 |
0.9 |
42.51 |
N/A |
Ionogramme Easy lyte Na/K/Cl, 800 ml, MEDICA 001384-001 R2 Analyser, 12160/12014-05 | |
| Ca+2 |
304 |
80 |
680 |
250
|
Volumetric | |
| Mg+2 |
1259 |
212.4 |
4525 |
150
|
Volumetric | |
| HCO3– 2 |
4765 |
421 |
19962 |
500 |
Volumetric |
Table 1. Chemical Composition Averages Waters in the Watershed of Sebkha of Oran.
From this diagram, 60 % of the groundwater samples fall in the field of 6. It belongs to the Ca+2– Mg+2-Cl– type hydrochemical facies. Such water has permanent hardness and does not deposit residual sodium carbonate in irrigation use. Another 12 % of the groundwater samples fall in the field of 7 which belongs to Na+-Cl–– SO4-2 hydro-chemical facies and represents Na+ – dominant Cl– – type, or Cl– – dominant Na+ -type waters. Such water generally creates salinity problems both in irrigation and drinking uses. Few samples (35 %) fall in the field of 5 which belongs to the Ca2+-Mg2+-HCO3– type and such water has temporary hardness. 4% fall in the field of 8, such waters deposit residual sodium carbonate in irrigation use and cause foaming problems. The positions of data points in the proposed diagram represent Na+–HCO3– type, Na+ dominant HCO3– type or HCO3– dominant Na+-type waters.
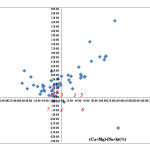 |
Fig7: Groundwater quality plotted on Chadha diagram.Click here to View Figure |
Alkaline earth exceeds alkali metals. 2. Alkali metals exceed alkaline earth. 3. Weak acidic anions exceed strong acidic anions. 4. Strong acidic anions exceed weak acidic anions. 5. Represent Ca2+ -Mg2+-HCO3– type. 6. Represents Ca2+ -Mg2+-Cl -type.7. Represent Na+-Cl–– type, Na2SO4– type. 8. Represent Na+- HCO3 – -type.
The Larson Index is used to determine the corrosiveness and aggressive character of water resources. The ratio of chloride and sulphate to bicarbonate (Larson, 1975; Larson & Skold, 1958; McNeill & Edwards, 2001).
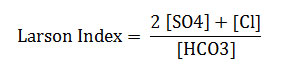
Corrosion is destruction of metals by inter related influence of chloride, sulphate, calcium, alkalinity and pH, and results in complicated and costly problems in drinking and groundwater utilities (Larson, 1975; Larson & Skold, 1957; McNeill & Edwards, 2001). Based on the observations the Larson Index is above 0.24 to 12.8. The alkaline earths (Ca+2+ Mg+2) exceeded alkali metals (Na+ + K+) and weak acidic anions (CO3– + HCO3–) exceeded acidic anions (Cl– + SO4-2). 29.09% of the groundwater samples fall in LI<0.8, which chloride and sulfate probably will not interface with natural film formation. 1.82% is between 0.8 et 1.2, which indicate that chloride and sulfates may interfere with natural film formation higher than desired corrosion rates might be anticipate, and, 58.18 % >1.2, the tendency towards high corrosion rates of a local type should be expected as the index increases.
Conclusion
The demand of water for domestic and irrigation purpose is growing very fast and is causing over pumping of the water resources in the study area. The aquifer belongs to two major hydro chemical facies namely Mg-HCO3 and Mg-Cl- water types groundwater facies have been shown by modified version of Hill-Piper and Durov diagram, that is, Chadha’s diagram. Majority of the groundwater samples irrespective of seasons fall in field of the 6, which indicates that the groundwater samples have permanent hardness and does not deposit residual sodium carbonate in irrigation use.
References
- Boutin, C. ; Boulanouar, M. Bull. Fac. Sc. Marrakech, 1983, 2: 5-21.
- Chadha, D.K. Hydrgeol J. 1999, 7:431–439.
- Cvetkov, L. Bull. Inst. Zool. Mus. (sofia), XXVII : 215-219.
- Durov, S.A. Akademiya Nauk SSSR Doklady. 1948, 59, 87-90.
- Hassani, M.I. Thèse de doctorat de 3ème cycle. Grenoble, (1987).
- Hem, J.D. Book 2254, 3rd edn. Scientific Publishers, Jodhpur, (1991).
- Larson, T.E. Illinois State Water Survey Urban Bull. 1975, Vol. 59.
- Larson, T.E. & Skold R.V. Laboratory studies relating mineral quality of water to corrosion of steel and cast irorr. State of Illinois, Department of Registration and Education, (1958).
- McNeill, L.S & Edwards, M. J. AWWA, 2001, 93 (7):88-100.
- Moussa, K. Thèse de doctorat. Université d’Oran, (2006).
- Pierre, D.; Glynn, L. ; Plummer, N. Hydrogeol J, 2005, 13:263–287.
- Piper, A.M. Union Transactions, 1944, 25:914-923.
- Sogreah. Étude d’aménagement intègre de la grande sebkha d’Oran. Mission 1. Rapport de la direction des études et des aménagements hydrauliques. Ministère des Ressources en Eau. Algérie, (2004).
- WHO. Guidelines for drinking-water quality, fourth edition, (2011).

This work is licensed under a Creative Commons Attribution 4.0 International License.
![]()
A New Edition of Web of Science
Journal Impact Factor
2022: 0.5
Five Year: 0.8
Journal is Indexed in

Cabells Whitelist
![]()


