Photocatalytic degradation of Vat Green 03 textile dye, using the Ferrihydrite-Modified Diatomite with TiO2 /UV process.
DOI : http://dx.doi.org/10.13005/ojc/300310
Download this article as:
![]()
This work is a study of the photodegradation( photocatalytic degradation ) of a dye of the textile industry . The Vat Green 03 textile dye of a chemical structure is C31H15NO3 as a function of pH, Titanium dioxide concentration and dye concentration in the study with dyestuff were led by lamp UV of trans-illuminator using the titanium dioxide TiO2 ( Degussa P25) like catalyst with a co-adsorbent , which is a rock formed primarily by the accumulation of frustules of diatoms called « diatomite or Kieselguhrs» in the layer of Sig having the advantage of being locally available and less expensive . The diatomite, which will be modified by iron « the deposit of ferrihydrite on raw diatomite by FeCl2.4 H2 O » and NaOH to increase the specific surface area of this material. Comparison of the results from x-ray diffraction ( XRD) show that the raw diatomite has an irregular structure at the modification by ferrihydrite to obtain the principal phases of ferric oxide in kind are,in rule of crystallinity, ferrihydrite,maghemite, akaganeite, magnetite,hematite, goethite ,and Schwertmannite increasing . The prepared material of diatomite and ferrihydrite applied for the photodegradation of Vat Green 03 textile dye used a concentration 20 mg/L with different of pH, and different concentrations from materials, added with 0,02 g titanium dioxide ( TiO2 ) under lamp UV with an agitation.The results of the photocatalytics tests applied from material DMF1 which there was a better colour remove about 97% at pH=4.The objective of this work it is the elimination of the organic pollutants of industrial waste water.
KEYWORDS:photodegradation; textile; dye; TiO2; diatomite; ferrihydrite; lamp UV
INTRODUCTION
The objectives of the research were to extract and compare the two methods for extraction of cinnamon’s essential oil, to analyze and identify the active compound in the essential oil and to identify the antimicrobial properties in cinnamon.water is the most important of raw material on our planet, for human beings, animals, plants and micro-organisms. Practically all the vital phenomena of the biosphere are related to the availability of water.water pollution which affects the rivers, the seas, the groundwater and the lakes, is the result of the wastewater without treatment or with a level of insufficient treatment: that causes a degradation of the ecosystem. The problem is even more serious in the case of the industrial effluents which present much more marked a toxic character.Dyes and additives used by textile industries can constitute a serious threat for the environment because their presence in water, even with very small quantities, is very visible and undesirable; consequently, their presence in the watery systems reduced the penetration of light and thus delays the photosynthetic activity.
They also have a tendency to complex the metal ions by producing a toxicity for fauna and other organizations. Consequently, the depollution of contaminated water by these chemical compounds proves to be necessary as well for environmental protection as for a possible re-use of this not-conventional water and by minimizing the water losses because of this recycling.Current research is then directed towards processes of treatment low costs by using materials like clays and bentonites and other materials diatoms which can be a good alternative for the desorption of the dyes and the organic additives. These materials were already used in the developed countries where they proved reliable since they present good properties of retention.The current problem of wastewater treatment of any nature is mainly the management of the effluent generated in the purification plants. Indeed, the processes used, whether they are chemical, biological or electrochemical produce all of the considerable quantities of muds which do not find outlets and whose management is problematic.
Indeed, an uncontrolled on arable lands is regarded as very harmful for agriculture. It is thoughtthat while using the processes by Co-precipitation with materials diatoms, one can manage to regulate the problem of organic pollution in the textile industrial wastes, since the materials used are natural and do not introduce pollution.The control of water pollution is presented in the form of one of major fields of the scientific activity. The engaged activities are done by a total management of the effluents by privileging the actions of reduction of pollution, in particular by the installation of techniques such as discoloration for example. And, although the colored organic compounds constitute only one minor fraction of the organic load of wastewater, their color makes them aesthetically unacceptable. In addition, this strong coloring of water is harmful since it causes an eutrophication of water and thus an asphyxiation of the micro-organisms.
The Objective of our work is to simplify the mode of water treatment of effluents with a view:
- To improve the results found by coagulation-flocculation used by the Algerian textiles companies;
- To apply a new method which proceeds by advanced oxidation;
- And finally to preserve the environment of the harmful effects of the dyes remaining in the effluents like in untreated muds.
Currently, the photocatalysis is always based by titanium dioxide (TiO2 ) for the experimental application.
Titanium dioxide has a big space of band : 3.0 eV for rutile and 3.2 eV for anatase and thus only the small fraction ( 5 %) of a solar light can be used for its photoexcitation .Consequently, of the efforts to consider were devoted the modified of TiO2 in order to prolong the band-edge of absorption the TiO2 in the obvious light irradiation [12].Among them ,Fe doped with TiO2 was intensively studied the ions of Fe could be built in dioxide of titanium by the substitution of Ti4+ ,presenting a new force in the space of band of TiO2 which is responsible for the photoactivity of visible light [ 1,3,4].
The principal phases of ferric oxide in kind are, in rule of crystallinity, ferrihydrite, maghemite, lepidocrocite, hematite, and goethite increasing [5]. The least of crystalline ferrihydrite is a brown ferric oxide with a big surface [6]. The ferrihydrite is also known like momentary ferric oxide phase [7] .The pure ferrihydrite transforms into more crystalline ferric oxides with time [7]. The ferrihydrite modified diatomite ( DMF) was produced the partial dissolution of diatomite by the solution of 6M NaOH followed by the hydrolysis and oxidized of the 1M solution of FeCl2.4H2O [8].
The inferior content of Si could have as the consequence more crystalline ferric oxides because of the ferrihydrite transformed.
EXPERIMENTAL
Materials and methods
Before studying the photo degradation of the dyes by the diatomite, we considered to be useful to modify our material in order to improve its properties. The details of ferrihydrite modified diatomite DMF prepared were previously reported and are recapitulated here [9].The diatomite used in this study comes from the area of Sig (50 Km of the town of Oran) in Algeria. It is presented in the form of a powder of white color. After crushing and sifting the size of the particles of the fraction lies between 0.4-0.6 mm. This material is of great interest and has several uses such us : purification of drinking water , absorbent of the pesticides, manufacture of antibiotics, some pharmaceutical syrups and it is qualified like friendly material with to respect the environment [10].The choice of this material was indicated to us by the fact that: It is very abundant; it has a adsorptive affinity towards the organic heavy metals [11,12] and molecules [13,14].
chemical composition of raw diatomite DB studied was determined by x-ray fluorescence X ( XRF) ( Philips PW 1404 ) and by electronic Micro sounder based on chemical analysis by x-ray fluorescence x ( XRF) ( Philips PW 1404 ). Raw diatomite DB is composed of 68.017 % SiO2 , 19.25 % CaCO3 , 7.575 % Al2O3 ; 2.022 % Fe2O3 ;1.241 % MgO ; 1.491 % K2O; 0.2 % Na2O ; 0.14 % TiO2 ; 0.038 % MnO.
DB samples (45 g) were immersed in 300 ml 6M NaOH solution at 90 °C for 2 h to partially dissolve Si [7] .The mixture was immediately added to 300 ml of FeCl2.4H2O solutions of differing concentrations ( 1,2,3 and 4 M) and stirred and oxidized in air at room temperature ( 25 °C) for 24 h.
The mixture was centrifuged for 30 min with the speed of 12000 rotations/min for assorted the separation. The solid obtained through centrifugation was washed with distilled water and oxidized in air at room temperature overnight. The mixture was centrifuged for 30 min with the speed of 15000 rotations /min for assorted the separation to remove excess NaOH. The solid obtained through centrifugation was washed with distilled water and oxidized in air to continue the oxidation Fe(OH)2 and remove the excess of NaOH for 24h. The mixture was dried at 105 °C for 24h . The products of this procedure were named DMF1, DMF2, DMF3 and DMF4 respectively as shown in Fig.3.
Fig.1 represents the geographical location of layer off diatomite ( Kieselguhr) the area of Sig in the west of Algeria ( from the geological point of view the area of Sig was the subject of several studies by several authors : (Perrodon,1952;Perrodon,1957; Thomas,1985;Mansour,1991; and Mansour et Al,1994 etc.). A simplified synthetic cut was raised to facilitate the study of the layers of the diatomite and the sediments associated in the diatomite formation.
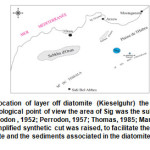 |
Fig1: Geographical location of layer off diatomite (Kieselguhr) the area of Sig « the west of Algeria » (From the geological point of view the area of Sig was the subject of several studies by several authors (Perrodon , 1952; Perrodon, 1957; Thomas, 1985; Mansour, 1991 and Mansour and Al 1994 etc). A simplified synthetic cut was raised, to facilitate the study of the layers of the diatomite and the sediments associated in the diatomite formation. Click here to View Figure |
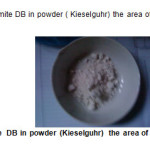 |
Fig2: shows the raw diatomite DB in powder ( Kieselguhr) the area of Sig in the West of Algeria. Click here to View Figure |
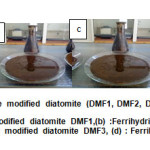 |
Fig3: is shown the products of modification the natural diatomite by ferrihydrite with different concentrations of FeCl2.4H2O (1M,2M,3M,and 4M) respectively. Click here to View Figure |
(a) Ferrihydrite modified diatomite DMF1,(b) :Ferrihydrite modified diatomite DMF2, (c) : Ferrihydrite modified diatomite DMF3, (d) : Ferrihydrite modified diatomite DMF4.
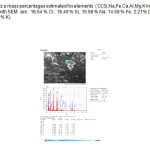 |
Fig4: represents a mass percentages estimated for elements ( Cl,Si,Na,Fe,Ca,Al,Mg,K in DMF1 by EDAX coupled with SEM are : 16.54 % Cl , 16.49 % Si, 15.98 % Na, 14.58 % Fe, 2.21% Ca, 0.91% Al, 0.39 % Mg,0.29 % K). Click here to View Figure |
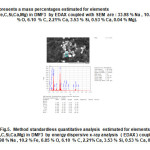 |
Fig5: represents a mass percentages estimated for elements (Na,,Fe,O,Fe,C,Si,Ca,Mg) in DMF3 by EDAX coupled with SEM are : 33.98 % Na , 10.2 % Fe, 6.85 % O, 6.10 % C, 2.21% Ca, 3.53 % Si, 0.53 % Ca, 0.04 % Mg). Click here to View Figure |
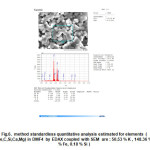 |
Fig6: represents a mass percentages estimated for elements ( Na,Fe,O,Fe,C,Si,Ca,Mg) in DMF4 by EDAX coupled with SEM are 50.53 % K , 148.36 % Cl, 0.93 % Fe, 0.18 % Si ) Click here to View Figure |
Preparation of Vat Green 03 textile dye
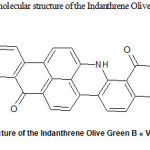 |
Fig7: represents the molecular structure of the Indanthrene Olive Green B « Vat Green 03 » dye of textile. Click here to View Figure |
Indanthrene Olive Green B ( C.I.Vat Green 03 ; C.I.69500) VG3 dye of textile was obtained from an industrial textile treatment Essenia « SOTEXHAM » in Oran in the West of Algeria.
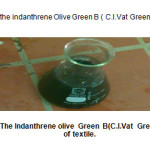 |
Fig8: shows the solution of the indanthrene Olive Green B ( C.I.Vat Green 03; C.I.69500) VG3 dye of textile. Click here to View Figure |
The pH of the Vat Green 03 solution was adjusted using sodium hydroxide ( NaOH) or by hydrochloric acid ( HCl). The objective of this work is to optimize the operating conditions of the photodegradation using the titanium dioxide ( Degussa P25), with different samples ( raw diatomite DB or ferrihydrite-modified diatomite ( DMF1,and DMF4).The pH of the solution is an important parameter in photocatalytic processes, which not only plays an important role to characterize the dyes,but also determines the surface charge of the properties TiO2 .
The photodecolorization of Vat Green 03 dye textile using TiO2 –DB , TiO2 – DMF1, and TiO2 – DMF4 were studied in pH range of 4-10 and fixed the concentration of titanium dioxide TiO2 is 0.1gL-1 and 2.5 gL-1 for different diatomites ( DB,DMF1, and DMF4) and thus release the dye textile ( Vat Green 03),which is used as indicator of contamination at concentration of 2 gL-1 .The photocatalytic activity was determined the pH and the absorbance of samples every 15 min.
Pollutants studied
The Vat Green 03 is a soluble in alkaline media to synthetic design dyeing cellulose fibers and proteins, as well as for printing cottons ,as shown in Fig.8.It was provided to us by the industry textile SOTEXHAM Essenia in Oran “ West of Algeria”.
Photodegradation test
The aqueous solution of Vat Green 03 was prepared from a stock solution of 1 g/L and the discharge is diluted at 2 mg/L , since it is very concentrated and contains other additives (caustic soda NaOH, sodium hydrosulfite Na2S2O4 ) .All manipulations of the photodegradation of Vat Green 3 was
conducted in a beaker of 250 mL with stirring at room temperature [20-25 °C]. The using materials used are prepared from titanium dioxide concentration fixed at 0.1 gL-1 , and 2.5 gL-1 for (raw diatomite DB) , and ferrihydrite -modified diatomite ( DMF1 , and DMF4 ), with different pH ( 4,7, and 10 ).They were introduced into the beaker , 200 mL of dye ( Vat Green 03 ) concentration and 0.02 g of titanium dioxide TiO2 [ Degussa P25 its crystalline structure : 80 % anatase + 20 % rutile ] with a specific surface area is 50 m2g-1 ; photophysics characteristic ; band gap ( Eg = 3.2 eV for anatase and Eg = 3.0 eV for rutile, with wavelength of 390 nm ] and 0.5 g of raw diatomite DB, and 0.5g of ferrihydrite- modified diatomite ( DMF1 , DMF4 ) to study pH range to 4,7, and 10, then the solutions were put in the dark under UV irradiation ultraviolet to take 10 mL of the sample every 15 min to measure the pH.the sample is centrifuged with a speed ( 15000 rotations /min ) for 30 min , and finally they measure the absorbance on a spectrophotometer model Optizen Micrometrics . As shown in Fig.9.
The manipulation of Vat Green 03 used for each of different diatomites ( DB,DMF1, and DMF4 ) is changed under the photocatalytic reactor transilluminator with a wavelength of 365 nm, with type Biometra, width of the lamp 15 cm ,and length of 30 cm , with a power is 45 Watt .In photodecolorization analysis by UV-Visible spectrophotometer model Optizen Micrometrics .As shown in Fig.10.
Decolorization( %) = (C0 – C ) /C0
Here Cis the absorption of Vat Green 03 solution at irradiation time of “t” min, and C0 is the initialabsorption at t= 0 min.
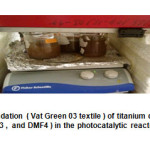 |
Fig10: Test of photodegradation ( Vat Green 03 textile ) of titanium dioxide + P25 Degussa (DB, DMF1, DMF2, DMF3, and DMF4 ) in the photocatalytic reactor ( transilluminator ). Click here to View Figure |
RESULTS AND DISCUSSION
Characterizations of (DB,DMF1,DMF2,DMF3, and DMF4)
x-ray diffraction (XRD) studies
The mineralogy of (DMF1, DMF2, DMF3, and DMF4) was characterized by powder x-ray diffraction (XRD) analysis using a model PW 1729 x-ray diffraction unit (Philips, Eindhoven, Netherlands) Cu Kα radiation (λ = 0.1540598 nm, 50 kV, 100 mA). As shown in Fig.7.The powder sample was coated on a plate out of glass of methanol and was dried with the room temperature, then swept 1° with 80° (2ϴ) with the size of stage of 0.020°.
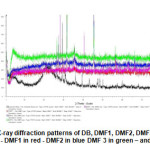 |
Fig11: X-ray diffraction patterns of DB, DMF1, DMF2, DMF3 and DMF4. DB in black – DMF1 in red – DMF2 in blue DMF 3 in green – and DMF 4 in pink. Click here to View Figure |
For the raw diatomite DB. Fig.11 represents The x-ray diffraction powder diffraction results of raw diatomite DB and Ferrihydrite modified diatomite ( DMF1, DMF2, DMF3,and DMF4). The diffraction spectrogram indicates that the diatomite consists mainly of silica ( SiO2) and CaCO3 with smaller amonts of Al2O3 ,Fe2O3,K2O,MgO,Na2O,TiO2 ,and MnO. amorphous band, represented the spectrum of raw diatomite DB ( black color ) shown in Fig.11 is probably due to the glass formation of SiO2 as the inorganic base accompanied quartz, calcite[15]. For Quartz ( the peaks at 2 theta= 14.5°-17.5°-19.5°-21°-23°-26.5°-36°-39.5°) and calcite ( peaks of 2 theta = 29.5° to 47°-47.5°-48.5°-57.5°-60°-64.5°-68.5°-77.5° ) are the characteristic peaks of the raw diatomite [16,17]. Similar spectra were found in the characterization of a Moroccan diatomite [18]. In conclusion, the diatomite has a disorganized structure (amorphous) that reported by K.Seogluand Others[19].
For DMF1. For the Quartz ( SiO2) : the peaks at 2 theta = 26.5°-45.5°-56.5°-66°-75° with the interreticulars distances ( d = 3.34-1.99-1.62-1.41-1.26 ) [20] ( Data of ASTM 5-490).
For the calcite ( CaCO3 ) : the peaks at 2 theta = 31.5°-45.5°-56.5°-66.75° with the interreticulars ( d= 2.82-1.99-1.69-1.62-1.41-1.26 ) [20].(Data of ASTM 5-490).For the rutile ( TiO2 ): the peaks at 54° with the interreticular distance d=1.69 and the peak at 2 theta= 27.5° with the interreticular distance d= 3.25 [20] (Data of ASTM 5-551).For the illite: the peak at 2 theta= 45.5° with d= 1.99 [21] (Data of ASTM 9-343).For the Kaolinite: the peak at 2 theta =45.5° with d= 1.99 [21] (Data of ASTM 14-164).For the hematite: the peak at 2theta with d= 1.69 [20] (Data of ASTM 8-98).
For DMF2.For the quartz ( SiO2 ) : the peaks at 2 theta = 26.5°-45.5°-56.5°-66°-75° with the interreticulars distances ( d= 3.34-1.99-1.62-1.40-1.26 ) [20] ( Data of ASTM 5-490).
For the calcite ( CaCO3 ) : the peaks at 2 theta =31.5°-45.5°-56.5°-75° with the interreticulars distances ( d=2.81-1.99-1.62-1.26) [20] ( Data of ASTM 5-490).For the magnetite: the peak at 2 theta =35.5° with d=2.52 [20] (Data of ASTM 8-98).For the illite: the peak at 2 theta =45.5° with the interreticular distance d=1.99 [21] (Data of ASTM 9-343).For the hematite: the peak at 2 theta=35.5° with d=2.52 [20] (Data of ASTM 8-98).For the kaolinite: the peak at 2 theta =45.5° with d= 1.99 [21] (Data of ASTM 14-164).For Fe-TiO2 : the peak at 2 theta = 53.5° with d= 1.70 [20] (Data of ASTM 3-781).
For DMF3.For the Quartz : the peaks at 2 theta =20.8°-26.5°-45.5°-56°-66°-75° with the interreticulars distances ( d=4.24-3.34-1.99-1.62-1.41-1.26) [20] ( Data of ASTM 17-536).For the rutile ( TiO2 ): the peaks at 2 theta =27° with the interreticular distance d=3.25 [20] (Data of ASTM 4-551).For the calcite ( CaCO3 ): the peaks at 2 theta =31.5°-45.5°-75° with the interreticulars distances (d=2.82-1.99-1.26) [20] (Data of ASTM 5-490).For the magnetite: the peak at 2 theta =35.5° with d=2.53 [21].For the illite: the peak
at 2 theta =45.5° with the interreticular distance d= 1.99 [21].For the kaolinite: the peak at 2 theta = 45.5° with d=1.99 [21] (Data of ASTM 14-164).
For DMF4. For the quartz ( SiO2 ) : the peaks at 2 theta = 36.8°-50.3°-66.3°-73.5° with interreticulars distances( d= 2.22-1.81-1.40) [21].For the hematite: the peak at 2 theta =35.5° with d=2.52[21].For the goethite: the peak at 2 theta =21° with d= 4.19 [21] (Data of ASTM 17-536).For the magnetite: the peaks at 2 theta = 43°-57°-62.5° with (d= 2.08-1.60-1.47 [20].From the maghemite: the peaks at 2 theta = 43° with d= 2.08 [20].For the kaolinite: the peak at 2 theta = 50.3° with d=1.81 [21].For the illite: the peak at 2 theta = 36.8° with the interreticular distance d= 2.45 [21].
Fourier Transform Infrared spectroscopy (FT-IR)
FT-IR spectra of raw diatomite DB,DMF1,DMF2,DMF3, and DMF4 are realized with help of spectrophotometer using a model JASCO FT /IR-4200 ( Fourier Transform Infrared Spectrometer ) between 4000 cm-1 and 400 cm-1 with the resolution of 4 cm-1. The samples are conditioned with the dispersion form in the pastille of KBr (1/200 in mass) and the summarized results are shown in Fig.12.
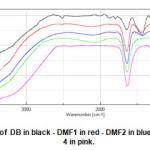 |
Fig13: FT-IR spectra of DB in black – DMF1 in red – DMF2 in blue DMF 3 in green – and DMF 4 in pink. Click here to View Figure |
For raw diatomite DB. The large adsorption band situated at 3399 cm-1 and 1431.89 cm-1 are linked with the vibrations of ( O-H ) surface and adsorbed water by the analysis of samples are proved the affinity of diatomite toward the water [22]. The adsorption band at 1101.15 cm-1 and 803.206 cm-1 are represented the vibration of siloxane group (Si-O-Si ) [23].The adsorption band at 1645.95 cm-1 and 1101.15 cm-1 are corresponded the vibrations of Si-O-Si [22]. The adsorption band at 877.452 cm-1 are corresponded the stained vibration of silanol group [24].The adsorption band at 803.206 cm-1 are corresponded the vibration of ( Al-O-Si ) [25]. Presence the characteristics bands of carbonates ions at ( 1431.89 cm-1 ;740.531 cm-1 ; 691.355 cm-1 ;877.452 cm-1 ; 577.576 cm-1 ) [26].The three adsorption bands at (431.012 cm-1 ; 470.546 cm-1 ; and 1101.15 cm-1 ) are attributed the vibrations of Si-O-Si [24].
For DMF1. There is a new adsorption band at 3437.49 cm-1 corresponds the vibration of the silanol group Si-O-H [27]. The infrared spectrum of raw diatomite DB. There is the disappearances of adsorption bands at (2517.61 cm-1 ; 1874.47 cm-1 ; 1794.44 cm-1 ; 877.452 cm-1 ; 803.206 cm-1 ; 740.531 cm-1 ; and 577.576 cm-1 ).There is a new adsorption band 2116.49 cm-1 corresponds the vibration of Si-H [28].The adsorption band at 1639.2 cm-1 corresponds the vibration of Fe( OH)3[29].The adsorption band at 1429.36 cm-1 corresponds the vibrations of CaCO3 and CaFe( CO3 )2 [30].The adsorption band at 783.922 cm-1 corresponds the vibration of FeOOH[31].The adsorption band at 678.82 cm-1 corresponds the vibration of α-FeOOH (goethite) [30] and FeOOH [32] and γ-Fe2O3 (maghemite) [31].The adsorption band at 591.075 cm-1 corresponds the vibration of maghemite (γ-Fe2O3 ) and magnetite (Fe3O4) [32].The adsorption band at 491.759 cm-1 corresponds the vibration of Schwertmannite[32].The adsorption band at 430.048 cm-1 corresponds the vibration of Si-O-Si [24].
For DMF2. There is a new adsorption band at 3434.6 cm-1 corresponds the vibration of the silanol group Si-O-H [27].If you compare with the infrared spectrum of raw diatomite DB . There is the disappearances of adsorption bands at ( 2517.61 cm-1 ; 1874.47 cm-1 ; 1794.44 cm-1 ; 877.452 cm-1 ; 803.206 cm-1 ; 740.531 cm-1 ; and 577.576 cm-1 ).There is a new adsorption band at 2101.06 cm-1 corresponds the vibration of Si-H [28].The adsorption band at 1637.27 cm-1 corresponds the vibration of Fe(OH)3[29].The adsorption band at 1428.99 cm-1 corresponds the vibration of CaCO3 and CaFe(CO3 )2 [30].The adsorption band at 1025.94 cm-1 corresponds the vibrations of Fe(OH)3 and FeOOH [31].The adsorption band at 679.785 cm-1 corresponds the vibration of goethite (γ-Fe2O3 ) and magnetite Fe3O4 [32].The adsorption band at 475.787 cm-1 corresponds the vibration of hematite ( α-Fe2O3 ) [32].The adsorption band at 415.585 cm-1 corresponds the vibration of akaganeite ( β-FeOOH ) [32].
For DMF3. There is a new adsorption band at 3444.24 cm-1 corresponds the vibration of silanol group Si-O-H [27].If you compare with the infrared spectrum of raw diatomite DB. There is the disappearances of adsorption bands at (2517.61 cm-1 ; 1874.47 cm-1 ; 1794.44 cm-1 ; 877.452 cm-1 ; 803.206 cm-1 ;740.531 cm-1 ; 1645.95 cm-1 ;1431.89 cm-1 ; 1101.15 cm-1 ; 691.355 cm-1 ).There is a new adsorption band at 1633.41 cm-1 corresponds the vibration of Fe(OH)3 and FeOOH[31].The adsorption band at 683.642 cm-1 corresponds the vibration of goethite ( α-FeOOH) [29].The adsorption band at 572.755 cm-1 corresponds the vibration of maghemite[32].The adsorption band at 479.224 cm-1 corresponds the vibration of hematite ( α-Fe2O3 ) [32].The adsorption band at 434.869 cm-1 corresponds the vibration of Si-O-Si [24 ].
For DMF4. There is a new adsorption band at 3415.31 cm-1 corresponds the vibration of silanol group Si-O-H [29].The adsorption band at 1629.55 cm-1 corresponds the vibration of Fe(OH)3 group [29].If you compare with infrared spectrum of raw diatomite DB . There is the disappearances of adsorption bands at (2517.61 cm-1 ; 1874.47 cm-1 ; 1794.44 cm-1 ; 877.452 cm-1 ; 803.206 cm-1 ; 803.206 cm-1 ;740.531 cm-1 ; 1645.95 cm-1 ; 1431.89 cm-1 ; 1101.15 cm-1 ; 691.355 cm-1 ; 577.576 cm-1 ; 470.546 cm-1 ;431.012 cm-1 ).The adsorption band at 1093.44 cm-1 corresponds the vibrations of Fe(OH)3 and FeOOH[31].The adsorption band at 895.773 cm-1 corresponds the vibration of FeOOH[31].The adsorption band at 797.421 cm-1 corresponds the vibration of goethite ( α-FeOOH ) [31].The adsorption band at 486.938 cm-1 corresponds the vibration of Schwertmannite[32].The adsorption band at 434.869 cm-1 corresponds the vibration of Si-O-Si [24].The adsorption band at 406.907 cm-1 corresponds the vibration of magnetite ( Fe3O4 ) [32].
Scanning Electron Microscopy ( SEM)
The diatomite was a modified surface by the NaOH treatment and the deposit of ferrihydrite. The SEM was used to determine the surface structure difference between raw diatomite DB and the modified diatomite by ferrihydrite (DMF1, DMF2, DMF3, and DMF4). The raw diatomite DB and ferrihydrite- modified diatomite (DMF1, DMF2, DMF3, and DMF4) were swept with the scanning electron microscope of analysis the model (JEOL JSM 6610 La, Japan). Fig.14 were exposure the raw diatomite DB by an electronic micrograph, there are two principal types of shoes in the diatoms:(1) Central, with veins radiating of a ring; (2) pennate, with veins being prolonged outside on the two sides of a longitudinal element (Round et Al., 1990). It can be seen that the raw diatomite obtained starting from layer of Sig in the west of Algeria includes understands mainly the central particles of diatom, and contains little pennate particles of diatom [33].The central particles of diatom have a diameter of approximately 5-20 micrometers and the thickness of several microns. The pennate particles of diatom have a length of approximately 12 micrometers.The micrograph proves that the diatomite has a porous structure and a great empty volume.It can imply the micrograph of SEM in Fig. 14 can imply that the high porosity is mainly caused by many skeletal pores in particles of diatom and the pores interparticles between the particles of diatoms [34].The micrograph of SEM of raw diatomite DB and ferrihydrite modified diatomite (DMF1, DMF2, DMF3, and DMF4) indicates that the raw diatomite DB has a frustules modified surface and the original geometry of the pores is destroyed by the treatment of NaOH and the deposit of ferrihydrite (Fig.14). At the beginning, the colloidal of ferrihydrite of size is 2-5 nanometers and the micropore is deposited ( > 50 nanometers) and the larger of mesopores is ( > 7 nanometers) of diatomite [35]. After being entirely deposited in the pores of diatomite, the additional aggregates of ferrihydrite on the surface of the diatomite particles en large surface because the formation of salt KCl in DMF1 and DMF4 as a crystals formed (Fig.14).
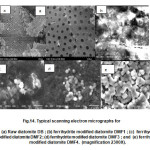 |
Fig14: Typical scanning electron micro graphs for Click here to View Figure |
(a) Raw diatomite DB ; (b) ferrihydrite modified diatomite DMF1 ; (c) ferrihydrite modified diatomite DMF2 ; (d) ferrihydrite modified diatomite DMF3 ; and (e) ferrihydrite modified diatomite DMF4. (magnification 2300X).
Effect of operational parameters on photocatalytic activity of (DB,DMF1,DMF2,DMF3,and DMF4)
Measurement of pH
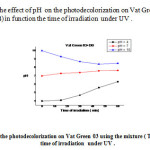 |
Fig15: represents the effect of pH on the photodecolorization on Vat Green 03 using the mixture (TiO2 –DB) in function the time of irradiation under UV. Click here to View Figure |
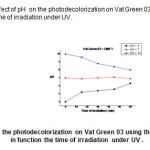 |
Fig16: represents the effect of pH on the photodecolorization on Vat Green 03 using the mixture (TiO2 –DMF1) in function the time of irradiation under UV. Click here to View Figure |
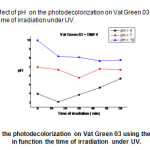 |
Fig17: represents the effect of pH on the photodecolorization on Vat Green 03 using the mixture ( TiO2 –DMF4) in function the time of irradiation under UV. Click here to View Figure |
The potential of hydrogen (pH) of Vat Green 3 with different samples (DB, DMF1, and DMF4) tend toward neutral because they have the precipitate after 60 min : white colour for DB, brown green colour for DMF1, and dark brown for DMF4 because they have the reactions between the vat green 03 dye textile and the different samples (DB, DMF1, andDMF4).
kinetics of photodegradation
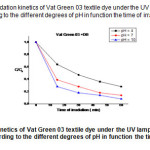 |
Fig18: shows the degradation kinetics of Vat Green 03 textile dye under the UV lamp, using the mixture of (TiO2+DB ) according to the different degrees of pH in function the time of irradiation . Click here to View Figure |
For (DB + TiO2 ). At 60 min of reaction, It was found that increase of solution pH from 4 to 10 increased the decolorizationeffieciency.
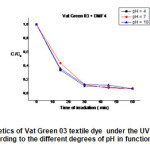 |
Fig19: shows the degradation kinetics of Vat Green 3 textile under the UV lamp, using the mixture of (TiO2 + DMF1) according to the different degrees of pH in function the time of irradiation . Click here to View Figure |
For (DMF1 + TiO2 ). At 60 min of reaction , It was found that increase of solution pH from 4 to 10 increased the decolorizationeffieciency. Fig.19 represents the degradation kinetics of Vat Green 3 textile under the UV lamp, using the mixture of ( TiO2 + DMF4) according to the different degrees of pH in function the time of irradiation. For (DMF4 + TiO2 ). At 60 min of reaction, It was found that increase of solution pH from 4 to 10 increased the decolorizationeffieciency.
Decolourisation rate of Vat Green 03 textile dye in different in different pH’s using the mixture (DB+ TiO2 ) are shown in Fig.16.At 60 min of reaction,it was verified that in pH= 10, there was a better colour remove about 92%. It was observed that the Vat Green 03 textile dye degradation has pH dependency, the better results are in pH’s 10,7,and 4.
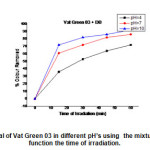 |
Fig20: Colour removal of Vat Green 03 in different pH’s using the mixture of (DMF4 +TiO2) in function the time of irradiation. Click here to View Figure |
Fig.21 shows the colourremoval of Vat Green 03 in different pH’s using the mixture (DMF1 + TiO2 ).Decolourisation rate of Vat Green 03 textile dye in different in different pH’s using the mixture (DMF1+ TiO2 ) are shown in Fig.21 . At 60 min of reaction,it was verified that in pH= 4, there was a better colour remove about 97%. It was observed that the Vat Green 03 textile dye degradation has pH dependency, the better results are in pH’s 4,10,and 7.
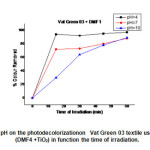 |
Fig21: Effect of pH on the photodecolorizationon Vat Green 03 textile using the mixture of (DMF4 +TiO2) in function the time of irradiation. Click here to View Figure |
Fig.22 shows the colourremoval of Vat Green 03 in different pH’s using the mixture (DMF4 + TiO2 ).Decolourisation rate of Vat Green 03 textile dye in different in different pH’s using the mixture (DMF4+ TiO2 ) are shown in Fig.18. At 60 min of reaction, It was verified that in pH= 10, there was a better colour remove about 93%. It was observed that the Vat Green 03 textile dye degradation has pH dependency, the better results are in pH’s 4,10,and 7.
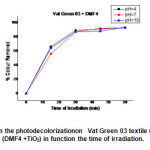 |
Fig22: Effect of pH on the photodecolorizationon Vat Green 03 textile using the mixture of (DMF4 +TiO2) in function the time of irradiation. Click here to View Figure |
Discussion for the photocatalytic activity phenomena between Vat Green 03 textile dye ,(DB,DMF1,DMF2,DMF3,and DMF4), and TiO2
Ferrihydrite-modified diatomite co-doped with titanium dioxide (TiO2) showed enhanced visible-light photocatalytic performance towards Vat Green 03 decolorization compared to that of Degussa P25 . It is suggested that the lattice defects induced by the ferrihydrite-modified diatomite dopant with TiO2 was responsible for the visible-light photocatalytic activities of photocatalysts .It is postulated that the visible –light photocatalytic activity of doped with TiO2 is dependent upon many other factors, such as crystalline structure,particlesize,textural properties ( ie.pore structure).
Derived photocatalysts were predominantly of anatase phase with mesoporous structure ,exhibited large specific surface areas, Si-O-Fe and Ti-O-Fe linkages were evidenced in the ferrihydrite modified diatomite doped with TiO2 photocatalysts .The presence of Fe in ferrihydrite modified diatomite ( DMF1, and DMF4) could favor the formation of surface hydroxyl groups. Then, the incorporation between ferrihydrite-modified diatomite (DMF1, and DMF4) [ Fe ions with Si] doped with TiO2 facilitated formation of surface hydroxyls groups which is another crucial factor governing the photocatalyticactivity.As concluded about the ferrihydrite-modified diatomite ( DMF1,and DMF4 ) were doped with TiO2 by the formation of new structure through bonding Si-O-Fe and Ti-O-Fe linkages which were responsible for its visible-light photocatalytic activity .As other method ,they proposed that the ferrihydrite modified diatomite ( Fe ions with Si) doped with titanium dioxide to substitute Ti4+ would introduce additional intragap state ( described by Zabek et Al.) [36].Under visible light irradiation ,excited photosensitizer ferrihydrite modified diatomite ( Fe ions with Si) doped with TiO2) injected an electron into the conduction band (CB ) of TiO2.
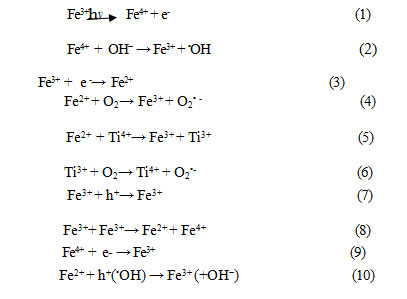
The electron was subsequently transferred to oxygen adsorbed on the TiO2 surface producing superoxide radical ( O2.- ), which is one of highly reactive oxygen species that can degrade many organic compounds [37] for example : dyes of textile .Two kinds of Fe impurity states located within the electronic structure of ferrihydrite modified diatomite doped with titanium dioxide have been reported : one is above the valence band (VB) due to the fact that t2g level of 3d orbital of Fe3+ ions lies above the VB of TiO2 .the other is below CB because the energy level of Fe 3d electrons is lower that then of Ti 3d at the bottom of CB v–[40]. Under visible light irradiation, as an electron was photoexcited from Fe3+ dopant level to the CB or from VB to this dopant level. Fe3+ was hence converted to Fe4+ according toeq (1) [39]. The photogenerated CB electron further reacted with adsorbed O2 to form O2.- ,while Fe4+ could react with surface hydroxyl group to produce hydroxyl radical (.OH) (eq2).Meanwhile, since the energy level of Fe3+ / Fe2+ is below the CB edge of TiO2[38,39] , Fe could act as a lectron sink to trap photogenerated electron and produce O2.( eq.s. (3)-(6) ) [39,43]. The photoexcitedferrihydrite modified diatomite ( Fe ions with Si). Doping with TiO2 generated a hole in the VB of TiO2 an electron in Fe dopant level, the hole could migrate to the surface leading to the formation of .OH , While Fe3+ accepted an electron to form Fe2+( eq. (3). in this case ,Fe3+ would act as hole trap due to that the energy level of Fe4+ / Fe3+ is above the valence band edge of TiO2(eq.7). Additionally it is possible that Visible light response could be due to change transfer transition between Fe ions ( Eq.8)[44].The photocatalytic reaction could involve the mechanistic steps of Eq.s (2) and (4)-(6),however, Fe3+ dopant with high concentration could serve as recombination centers for the photogenerated electron –hole (eqs.(9) and (10) ) [39,45], leading to decrease the photocatalyst activity.
CONCLUSION
This work aims to test the capacity and efficiency of the raw diatomite DB and ferrihydrite modified diatomite (DMF1, DMF2, DMF3,and DMF4) prepared in the laboratory to industrial degradation of dyes in effluents from textile industry .In order to better understand these materials and clearly identify their morphology, the first part of the experimental work has been devoted to the characterization of these materials. The characterization of diatomite by various analytical techniques showed that diatomite is composed mainly of amorphous silica (68.017 %) and carbonates which contaminate the surface of the mask material and part of the porosity. Porous diatomite particles are more or less heterogeneous from one fragment to another. Ferrihydrite -modified diatomite leads to a significant improvement in average pore diatomite. This was probably attributed to total elimination of carbonates and impurities. The displacement of impurities decreases the specific surface area increases and the average pore diameter of the raw diatomite DB , while its possibilities as improves adsorption .The experimental results showed that The SiO2 is the manufacturer of the blank body diatomite with CaCO3 and Al2O3 as the main impurities of the order of 19 % at 7 % sequentially from x-ray fluorescence (XRF).
The Comparison of the results from x-ray diffraction XRD show that the raw diatomite has an irregular structure at the modification of ferrihydrite.Thephotocataytic degradation kinetic depends on the pH of the solution of Vat Green 03, it is more important at low pH (pH = 4). All these results show that The use of raw diatomite DB and ferrihydrite modified diatomite (DMF1, DMF2, DMF3, and DMF4),especially ( DMF1, and DMF4) offer great potential for the removal of dyes.The derived photocatalysts were predominantly of anatase phase with mesoporousstructure,exhibited large specific surface areas,Si-O-Fe and Ti-O-Fe linkages were evidenced in the ferrihydrite-modified diatomite doped with TiO2 photocatalysts.The presence of Fe in ferrihydrite-modified diatomite ( DMF1, and DMF4) could favor the formation of surface hydroxyl groups.The natural abundance of these materials low investment costs could provide a good alternative to more costly adsorbents such as activated carbon, Zeolite, alginate …Finally, this study was designed as a major source of information processed by ferrihydrite modified diatomite.
ACKNOWLEDGEMENTS
We would also like to express our gratitude to the laboratory team LSTGP for their help and encouragement throughout completion of the article.Our sincere thanks also go to all our teachers and colleagues at Faculty of Chemistry ( USTO -MB) . Our wish also reflect our deepest recognition to those who encouraged us to finish this work by signs of friendship which we are grateful.
REFERENCES
- Yamashita,H. ;Harada,M. ;Misaka,J. ;Takeusi,M. ; Ikeuchi,K. ;Anpo,M. J. Photochem. Photobio. A : Chem.2002,148, 257-261.
- Zaleska,A. Rec. Paten. Engin.2008 ,2,157-164.
- Yalçin, Y.; Kiliç, M; Çinar, Z. Appl. Catal. B: Environ. 2010,99,469–477.
- Choi,W.; Termin,A.;Hoffmann,M.R. J. Phys. Chem. Photobio. A :Chem. 2009,203, 64-71.
- Hoffmann,M.R.; Martin,S.T.; Choi,W.Y. J. Photochem. Photobiol. A :Chem.2009,203, 64-71 .
- Schwertmann,U.; Cornell,R.M. Wiley-VCH,2000,2,5.
- Rhoton, F.E.;Bigham,J.M. J. Environ. Qual. 2005,34,890.
- Mayer,T.D.; Jarrell,W.M. Water Res.2000,34,3949.
- Xiong,W;Peng,J. Water Res. 2008 ,42,4869.
- Nakkad,R.;Ezbakhe,H.;Benmoussa,A.;Ajzoul,T.; El- Bakkouri,A. Journ. Internat. Therm.2005,12,307-309.
- Osmanlioglu,A.E. Appl. Radiat. Isot.2007,65,17-20.
- Al-Degs,Y;Khraisheh,M.A.M.;Tutundji,M.F. Water Res.2001,15,3724-3728.
- Khraisheh,M.A.M.;Al-Ghouti,M.A.; Allen,S.J.;Ahmad, M.N. Water Res.2005,39,922-932.
- Yang,Y.X.;Zhang,J.B.;Yang,W.M.;Wu,J.D.;Chen,R.S. Appl .Surf . Sci.2003,206,20-28.
- Al-Degs,Y.S.;Khraisheh,M.A.M.;Tutunji,M.F. Water Res.2001,35,3724.
- Breese,R.O.Y. Edit. Industr. Miner. Roc.1994,397-412.
- Frolov,Y.G.;Shabanova,N.A.;Savochkina,T.V. Kolloidn. Zh.1983,45,509.
- Yilmaz,B; Ediz,N. Cem.Concr.Compos.2008,30,202-211.
- Sahraoui,H.;Abouarnadasse,S.;Elkamel,K;Nadiri,A; Yacoubi,A. Ann. Chim. Sci. Mat.2003,29.
- Köseoglu,R.;Köksal,F.;Ciftçi,E.; Akkurt,M. J. Mol. Struct. 2005,733,151-154.
- Tchadjié,N.L. Mémoir. Maste. Chim. Univ. Yaound.1.2012, 25.
- Lemogna,N.P. Mémoir. D.E.A. Univ. Yaound.1.2008,75.
- Allen,S.J.;Whitten,L.J.;Mckay,G.,Dew. Chem. Eng. Mineral. Process.1988 ,615,231-261.
- AlGhouti,M.A.,Khraisheh,M.A.M.;Allen,S.J.;Ahmad,M.N. J. Environ. Manage.2003,69,229-238.
- Huang,J.; Liu,Y.;Jin,Q.;Wang,X.;Yang,J. J. Hazard. Mater.2007,143,541–548.
- Wilkinson,J.P. U.S. Patent.1990,36, 2412.
- Doyle,W.D. Proc. INTERMAG Conf.1987,221-226.
- Bahramiam.B.;Ardejani,F.D.;Mirkhani,V. Appl. Catalys. A:Gener.2008,345,97-103.
- Shen.W.;et Al. Ceram. Inter.2013,39,5013-5024.
- Kongola. Propert. Oxid. Oxyhydroxid. Iro.1991.
- Van Der Marel; and Beutespacher. Propert. Oxid. Oxyhydroxid. Iro.1976.
- Cases; et al. Propert. Oxid. Oxyhydroxid. Iro.(1989, 1990, and 1993).
- Schwertmann ;et Cornell. Iro. Oxid. Laborat. Preparat. Character.2000.
- Stamatakis,M.G.;Fragoulis,D,Csirik,G.;Bedelean.I.;Pedersen,S. Cem. Concr. Compos.2003,25,177-184.
- Janney,D.E,;Cowley,J.M.;Buseck,P.R. Clay and Clay Miner.1990,48,111-119.
- Round,F.E.;Crawford,R.M.;Mann,D.G. Cambr. Univ. Pres.1990.
- Zabek,P.Z.;Kisch,H.;J. Coord. Chem.2010,63,2715–2726.
- Lettmann.C.;Hildenbrand,K.;Kisch,H.;Macyk,W.; Maier,.W.F. Appl. Catal. B.2001,32,215–227.
- Choi,W.;Termin,A.;Hoffmann,M.R. J. Phys. Chem. 1994,98,13669–13679.
- Asiltürk,M.;Sayilkan,F.;Arpac,E. J.Photochem. Photobiol. A: Chem.2009, 203, 64–71.
- Wu.Y.;Zhang,J.;Xiao,L.;Chen.F. Appl. Surf. Sci.2010,256, 4260–4268.
- Cong,Y.;Zhang,J.L.;Chen,F.;Anpo,M.;He,D.N. J. Phys. Chem. C.2007,111,10618–10623.
- Yu,J.;Xiang,Q.;Zhou,M.Appl. Catal. B.2009, 90, 595–602.
- Zhu,J.;Zheng,W.;He,B.;Zhang,J.;Anpo,M. J. Mol. Catal. A : Chem.2004, 216, 35–43.
- Zhu,J.;Chen,F.; Zhang,J.;Chen,H;Anpo,M. J. Photochem. Photobiol.A : Chem.2006,180,196–204.


![]()


