Pharmacophore Modeling, Atom based 3D-QSAR and Docking Studies of Chalcone derivatives as Tubulin inhibitors
DOI : http://dx.doi.org/10.13005/ojc/300320
Download this article as:
![]()
Tubulin is attractive target for anticancer drug design and their inhibitors are useful in treatment of various cancers. Pharmacophore and Atom based QSAR studies were carried out for series of Chalcone derivatives. Pharmacophore model was developed using 38 compounds, having pIC50 ranging 4.003 to 6.552. The best Pharmacophoric hypothesis AHHRR.10 (one H-acceptor, two hydrophobic groups, two aromatic rings) had survival score of 4.824. Atom based 3D QSAR was built for the best hypothesis with training set of 31 and test set of 7 compounds using PLS factor. The obtained QSAR model has excellent regression coefficient of R2 = 0.954, cross validated correlation coefficient q2 = 0.681, Pearson-R = 0.886 and Fisher ratio F = 136.9. The QSAR results explain electron withdrawing, positive, negative ionic and hydrophobic groups are crucial for tubulin inhibition. The docking studies of these inhibitors on the active site of the beta-tubulin shows crucial hydrogen bond interactions with the Gln11, Asn101, Thr145 amino acids. These findings provide designing of novel compounds with better tubulin inhibitory potential.
KEYWORDS:Cancer; Chalcones; Docking; Pharmacophore; QSAR; Tubulin
Introduction
Microtubule is a globular protein and made of up closely related sub units called alpha-tubulin and beta-tubulin that are combined together to form heterodimers. Microtubule is important in various cellular processes like cell proliferation, maintenance of cell shape and structure, motility regulation, cell signaling, secretion, and intracellular transport. Microtubules are attractive target for development of anticancer drugs because of their role in mitotic process1-2. Inhibitors of microtubules engage the cell cycle surveillance mechanisms to arrest cell division in mitosis3. A number of natural products bind to the tubulin, which includes vinca alkaloids, combretastatins, taxanes and the epothilones4. Four different types of binding sites are available for tubulin to interact with inhibitors, which are laulimalide, taxane/epothilone, vinca alkaloid, and colchicine sites1. Tubulin binding agents can be classified into two types based on their mechanism of action as microtubule destabilizing (such as such as Vincristine, Vinblastine, Combretastatin-A4) and microtubule-stabilizing drugs (such as Taxanes and epothilones). The destabilizing drugs bind to one of two tubulin binding sites (vinca, colchicines site), the stabilizing drugs binds to taxane binding site2, 5-6. Out of four binding domains colchicine binds with high affinity to tubulin, colchicine binds to beta-tubulin and forms entangled tubulin dimer and it prevents to adopt straight structure, which inhibits the microtubule assembly7. Several natural products and modified natural products interact with tubulin, which are in clinical trials4. Taxanes and vinca alkaloids are effective antimitotic agents, but when administrated as combination chemotherapy it shows enhanced myeloid and neurologic toxicity. Presently the combination was excluded from clinical trials8. Colchicine was not clinically used as cancer drug, but it has been studied as tubulin domain binder4. Because of this there is an urgent need to develop antitubulin inhibitors with effective biological properties. Chalcones belong to colchicine domain binding groups, and is naturally occurring compound belong to flavonoid structure. The chalcones are yellow pigments in flowers, and are found in various plant parts ((roots, rhizomes, heartwood, buds, leaves, flowers, and seeds) of species of genera Angelica, Sophora, Glycyrrhiza, Humulus, Scutellaria, Parartocarpus, Ficus, Dorstenia, Morus, Artocarpus)9-10. The chalcone compounds possess various biological activities such as anti-cancer, antioxidant, antimicrobial, anti-inflammatory, analgesic, anti-ulcerative, immune modulatory, antimalarial, antiviral, anti-leishmanial, anti-tubercular, anti-hyperglycemic etc.11-22. In the present study pharmacophore model, 3D QSAR and molecular docking studies on tubulin inhibitors were developed. These studies are useful in designing new tubulin inhibitors.
Materials and Methods
Data set
A set of 38 Chalcone compounds with tubulin inhibitory activity were collected from various previous results and the inhibitory activity of the compounds against tubulin were converted in to pIC50 are shown in Table 1 and 223-24.
 |
Table1: The chemical structures of training and test set 1-16 Click here to View table |
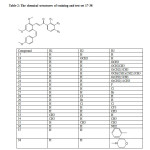 |
Table2: The chemical structures of training and test set 17-38 Click here to View table |
Molecular modeling
All 38 compounds were drawn using ISIS draw, further Ligprep module used in minimization of compounds using semi-empirical OPLS_2005 force field. It converts the 2D structures in to 3D structures, generates tautomers and neutralizes charged structures.
Pharmacophore studies
A common pharmacophore hypothesis is a spatial arrangement of chemical features common to two or more active ligands, which is proposed to explain the key interactions involved in ligand binding. To generate common pharmacophore hypothesis, the ligands were divided into actives and inactive by activity threshold value. The activity threshold value was 6 for active and 5 for inactive ligand. The dataset pIC50 activity distribution ranges from 4.003-6.552. The ligands were used for generating pharmacophore and QSAR modeling.
PHASE module of Schrodinger software was used to generate pharmacophore model. Phase utilizes fine-grained conformational sampling and scoring techniques to identify common pharmacophore hypotheses25. To identify common pharmacophore hypothesis six pharmacophore features: H-bond acceptor (A), H-bond donor (D), hydrophobic group (H), negatively charged group (N), positively charged group (P) and aromatic ring (R) were selected. The hypothesis identified by Phase is scored according to how the active ligands superimpose on features associated with that hypothesis. The high scoring hypothesis used to create 3D QSAR model.
QSAR model
QSAR model is carried out using high score hypothesis by dividing the dataset as training set (80%) and test set (20%). PHASE has two types of molecular alignment, one is pharmacophore based alignment and other one is atom based alignment25-26. Atom based QSAR model is more useful in explaining the structure activity relationship. Phase QSAR models are based on partial least-squares (PLS) regression. Atom based QSAR were generated for selected hypothesis using 31 training set and 7 test set using grid spacing of 1.0 Å and four components of PLS factor, the model is validated by predicted activities of test set compounds.
Docking studies
Molecular Docking studies carried out using LigandFit module in Discovery studio. The LigandFit docking procedure consists of specifying the region of the receptor to use as the binding site for docking and the Docking of the ligands in the specified binding site27. The crystal structure of the beta-tubulin (PDB ID: 1SA1) is downloaded from protein data bank (http://www.rcsb.org/pdb). Protein preparation was carried out by deleting water molecules, adding hydrogens to receptor and CHARMm force field applied to the receptor. After protein preparation the active sites were searched using flood filling algorithm and partition site was adjusted for the better fits of molecule in the partition site of receptor. All 38 compounds were docked in to the active site of the 1SA1. During the docking process top 10 conformations of ligands were generated based on the dock score value.
Results and Discussion
In the present study ligand based pharmacophore, atom based QSAR studies on chalcone derivatives were carried out to elucidate structural features to inhibit tubulin receptor. The molecular docking studies to find binding interactions of ligand with tubulin receptor.
For the generation of common pharmacophore model, the data set was divided into actives (> 6) and in actives (<5). 10 chalcone compounds show greater than 6 activities against tubulin protein and they contain important structural features. The pharmacophoric features selected for creating sites were H-bond acceptor (A), hydrophobic group (H) and aromatic ring (R). Five featured common pharmacophore hypothesis was generated using different combinations of variants. Default values were selected for scoring function. Five pharmacophore hypothesis were generated, the best hypothesis AHHRR.10 having survival score of 4.824 were shown in Figure 1 the features represented in this hypothesis were one H-bond acceptor, two Hydrophobic and two Aromatic rings. The compound 13 show best fitness score of 3, the highest activity compound 3 show fitness score of 2.91 as shown in Figure 2a and 2b. The alignment of all active compounds and active/inactive compounds with their pharmacophoric features are shown in Figure 3a and 3b. The score of the hypothesis, distance and angle between different sites of AHHRR.10 hypothesis were presented in Table 3, 4 and 5 respectively.
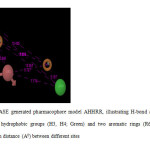 |
Fig1: Figure 1. PHASE generated pharmacophore model AHHRR, illustrating H-bond acceptors (A1; Pink), two hydrophobic groups (H3, H4; Green) and two aromatic rings (R6, R7; orange) features with distance (A0) between different sites Click here to View Figure |
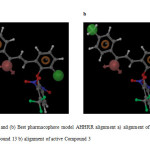 |
Fig2: (a) and (b) Best pharmacophore model AHHRR alignment a) alignment of best fitness score Compound 13 b) alignment of active Compound 3 Click here to View Figure |
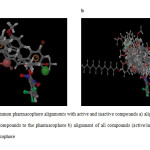 |
Fig3: Common pharmacophore alignments with active and inactive compounds a) alignment of all active compounds to the pharmacophore b) alignment of all compounds (active/inactive) to the pharmacophore Click here to View Figure |
Table 3: Scores of different parameters of the AHHRR.10 Hypothesis
|
ID |
Survival-Active |
Survival -Inactive |
Site |
Vector |
Volume |
Activity |
Inactive |
|
AHHRR.10 |
4.824 |
3.633 |
0.75 |
0.929 |
0.79 |
6.096 |
1.191 |
|
AHHRR.9 |
4.815 |
3.61 |
0.74 |
0.929 |
0.784 |
6.552 |
1.205 |
|
AHHRR.40 |
3.76 |
1.592 |
0.31 |
0.746 |
0.346 |
6.221 |
2.168 |
|
AHHRR.39 |
3.679 |
1.549 |
0.28 |
0.688 |
0.348 |
6.022 |
2.13 |
|
AHHRR.36 |
3.387 |
1.527 |
0.12 |
0.591 |
0.319 |
6.221 |
1.859 |
Table 4: The distance between the different sites of AHHRR.10 hypothesis
| Entry | Site1 | Site2 | Distance |
| AHHRR.10 | A1 | H4 | 7.776 |
| AHHRR.10 | A1 | H3 | 6.753 |
| AHHRR.10 | A1 | R6 | 3.695 |
| AHHRR.10 | A1 | R7 | 5.727 |
| AHHRR.10 | H4 | H3 | 13.358 |
| AHHRR.10 | H4 | R6 | 10.367 |
| AHHRR.10 | H4 | R7 | 3.137 |
| AHHRR.10 | H3 | R6 | 3.138 |
| AHHRR.10 | H3 | R7 | 10.425 |
| AHHRR.10 | R6 | R7 | 7.576 |
Table 5: The angles between the different sites of AHHRR.10 hypothesis
| Entry | Site1 | Site2 | Site3 | Angle |
| AHHRR.10 | H4 | A1 | H3 | 133.6 |
| AHHRR.10 | H4 | A1 | R6 | 125.5 |
| AHHRR.10 | H4 | A1 | R7 | 20.5 |
| AHHRR.10 | H3 | A1 | R6 | 8.1 |
| AHHRR.10 | H3 | A1 | R7 | 113 |
| AHHRR.10 | R6 | A1 | R7 | 105 |
| AHHRR.10 | A1 | H4 | H3 | 21.5 |
| AHHRR.10 | A1 | H4 | R6 | 16.9 |
| AHHRR.10 | A1 | H4 | R7 | 39.8 |
| AHHRR.10 | H3 | H4 | R6 | 4.6 |
| AHHRR.10 | H3 | H4 | R7 | 18.3 |
| AHHRR.10 | R6 | H4 | R7 | 22.9 |
| AHHRR.10 | A1 | H3 | H4 | 25 |
| AHHRR.10 | A1 | H3 | R6 | 9.5 |
| AHHRR.10 | A1 | H3 | R7 | 30.4 |
| AHHRR.10 | H4 | H3 | R6 | 15.5 |
| AHHRR.10 | H4 | H3 | R7 | 5.4 |
| AHHRR.10 | R6 | H3 | R7 | 20.9 |
| AHHRR.10 | A1 | R6 | H4 | 37.6 |
| AHHRR.10 | A1 | R6 | H3 | 162.4 |
| AHHRR.10 | A1 | R6 | R7 | 46.9 |
| AHHRR.10 | H4 | R6 | H3 | 159.9 |
| AHHRR.10 | H4 | R6 | R7 | 9.3 |
| AHHRR.10 | H3 | R6 | R7 | 150.7 |
| AHHRR.10 | A1 | R7 | H4 | 119.7 |
| AHHRR.10 | A1 | R7 | H3 | 36.6 |
| AHHRR.10 | A1 | R7 | R6 | 28.1 |
| AHHRR.10 | H4 | R7 | H3 | 156.3 |
| AHHRR.10 | H4 | R7 | R6 | 147.8 |
| AHHRR.10 | H3 | R7 | R6 | 8.5 |
The best AHHRR.10 hypothesis were selected for atom based QSAR. The 3D QSAR model were generated in PHASE using 31 compounds as training and model was validated using 7 compounds as test set compounds with PLS factor. A four PLS factor model with good statistics and predicated ability was generated for the dataset. The statistical values were listed in Table 6.
Table 6: Atom based 3D QSAR statistical parameters
| ID | PLS factors | SD | R2 | F | P | Stability | RMSE | Q2 | Pearson-R |
| AHHRR.10 | 1 | 0.3862 | 0.5887 | 41.5 | 4.76E-07 | 0.9877 | 0.5454 | 0.5375 | 0.8397 |
| 2 | 0.3223 | 0.7235 | 36.6 | 1.53E-08 | 0.9242 | 0.4264 | 0.7173 | 0.9008 | |
| 3 | 0.2255 | 0.8695 | 60 | 4.59E-12 | 0.7279 | 0.4484 | 0.6875 | 0.8854 | |
| 4 | 0.1354 | 0.9547 | 136.9 | 4.56E-17 | 0.5801 | 0.4528 | 0.6813 | 0.8861 |
The QSAR result shows the best regression coefficient of R2 (0.954), large value of F (136.9) and P value (4.563E-17), small value of standard deviation (0.135), RMSE (0.452) and high Pearson-P (0.886) values indicates statistically significant regression model. The model was validated by cross validated correlation coefficient q2 = 0.681.
The QSAR model shows 95% variance explained by the observed and PHASE predicted activity graph shown in Figure 4, which shows the fitting points were near to the regression line. The observed and predicted activities are summarized in Table 7.
Table 7: Fitness and predicted activity of the training set and test set of compounds
| Compound No. | uM | Exp. pIC50 | Pre. pIC50 | Fitness | Pharmset | Trianing/Test |
| 1 | 0.9 | 6.045 | 5.82 | 2.85 | Active | Training |
| 2 | 0.89 | 6.05 | 5.92 | 2.87 | Active | Training |
| 3 | 0.28 | 6.552 | 6.04 | 2.91 | Active | Test |
| 4 | 0.93 | 6.031 | 5.96 | 2.73 | Active | Training |
| 5 | 1.1 | 5.958 | 5.95 | 2.75 | Test | |
| 6 | 0.71 | 6.148 | 6.17 | 2.78 | Active | Training |
| 7 | 0.92 | 6.036 | 6.11 | 2.8 | Active | Test |
| 8 | 2.4 | 5.619 | 5.74 | 2.79 | Training | |
| 9 | 1.7 | 5.769 | 5.86 | 2.79 | Training | |
| 10 | 2.2 | 5.657 | 5.9 | 2.83 | Test | |
| 11 | 1.9 | 5.721 | 5.81 | 2.87 | Training | |
| 12 | 1.2 | 5.92 | 5.98 | 2.91 | Training | |
| 13 | 0.8 | 6.096 | 6.04 | 3 | Active | Training |
| 14 | 1.44 | 5.841 | 5.83 | 2.84 | Training | |
| 15 | 1.56 | 5.806 | 5.91 | 2.89 | Training | |
| 16 | 1 | 6 | 6.01 | 2.87 | Active | Training |
| 17 | 8.49 | 5.071 | 5.09 | 1.56 | Training | |
| 18 | 13.7 | 4.863 | 4.88 | 1.05 | Inactive | Test |
| 19 | 9.9 | 5.004 | 4.94 | 1.36 | Training | |
| 20 | 58.4 | 4.233 | 3.99 | 1.13 | Inactive | Training |
| 21 | 19.8 | 4.703 | 4.64 | 0.75 | Inactive | Training |
| 22 | 11.3 | 4.946 | 4.93 | 1.36 | Inactive | Training |
| 23 | 26.1 | 4.583 | 4.72 | 1.31 | Inactive | Training |
| 24 | 99.1 | 4.003 | 5.05 | 1.42 | Inactive | Test |
| 25 | 15.3 | 4.815 | 5.03 | 1.29 | Inactive | Training |
| 26 | 18.3 | 4.737 | 4.77 | 1.26 | Inactive | Training |
| 27 | 15 | 4.823 | 4.69 | 1.25 | Inactive | Training |
| 28 | 9.4 | 5.026 | 4.91 | 0.95 | Training | |
| 29 | 15.8 | 4.801 | 4.83 | 0.93 | Inactive | Training |
| 30 | 10 | 5 | 5.2 | 1.22 | Inactive | Training |
| 31 | 32 | 4.494 | 4.66 | 1.24 | Inactive | Training |
| 32 | 6.99 | 5.155 | 5.15 | 1.27 | Training | |
| 33 | 10.1 | 4.995 | 5.13 | 1.28 | Inactive | Test |
| 34 | 0.95 | 6.022 | 5.86 | 1.14 | Active | Training |
| 35 | 0.6 | 6.221 | 6.04 | 1.24 | Active | Training |
| 36 | 8.66 | 5.062 | 5.23 | 1.36 | Training | |
| 37 | 9.23 | 5.034 | 4.92 | 1.42 | Training | |
| 38 | 7.82 | 5.106 | 5.25 | 1.48 | Training |
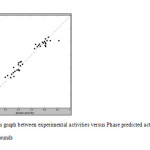 |
Fig4: Fitness graph between experimental activities versus Phase predicted activity for training and test compounds Click here to View Figure |
The 3D QSAR analysis of chalcone derivatives shows the following result, which contribute positively or negatively to activity. The QSAR model in PHASE represents as atom cubes, the blue color cube is positive coefficient and red color cube is negative coefficient. The positive coefficients indicate an increase in activity and negative coefficients indicate decrease in activity. The coefficients give a clue to find favorable and unfavorable functional groups.
Active compound 3 taken as reference compound and the blue and red color cubes are represented. Figure 5a demonstrates the red color cubes at H3 demonstrate negative potential of H-bond donors at the position of the compound. Figure 5b and 5c and demonstrates the blue color cubes on phenyl ring attached to chalcone moiety shows positive contribution of positive and negative ionic groups enhancing the activity. Figure 5d. illustrates electron withdrawing groups at A1, H3 and nitro group attached to phenyl shows positive potential of electron withdrawing groups. Figure 5e demonstrates positive contribution at H3 and H4 shows hydrophobic groups are favorable at this region and negative contribution on chalcone moiety and phenyl group shows the hydrophobic groups are unfavorable at this regions. Figure 5f demonstrates combined effect of QSAR model. The QSAR model explains the attachment of electron withdrawing groups to chalcone moiety; hydrophobic groups at H3 and H4; negative and positive ionic groups attached to the chalcone moiety enhances the activity of the chalcone derivatives towards tubulin receptor. Figure 6 clearly explains the favorable and unfavorable regions. Attachment of electron withdrawing groups, hydrophobic, positive and negative groups to chalcone moiety enhances the activity.
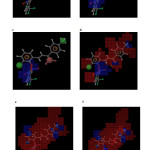 |
Fig5: Atom based 3D QSAR visualization of various substituent effects: (a) H-donors (b) positive ionic (c) negative ionic (d) electron withdrawing (e) hydrophobic (f) combined effect (blue color tube indicates favorable region while red color cube indicates unfavorable region Click here to View Figure |
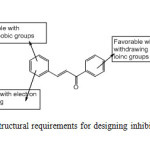 |
Fig6: Structural requirements for designing inhibitors Click here to View Figure |
The molecular docking studies carried out using Discovery studio for 38 chalcone compounds into active site of the beta-tubulin (ISA1) receptor to find the interactions of the ligands with the receptor to obtain further information on structural development. The compounds were ranked based on the docking score and the docking scores are compared with the reference ligand MDL-2704828. Docking score and H-bond interactions of all compounds are listed in Table 8.
Table 8: Docking Score and H-bond interaction of all 38 compounds
| Chain A: Site 1 | Docking Score (kcal/mol) | LigScore1 | LigScore2 | H-Interactions | H-Bond Monitor | H-bond Distance Ao |
| MDL-27048 | 42.844 | 3.63 | 4.97 | Gly144, Thr145 | A:GLY144:HN – Compound1:O14 A:THR145:HN – Compound1:O20 |
1.88, 2.02 |
| 1 | 31.383 | 5.57 | 5.31 | Gln11 (2), Gly144 | A:GLN11:HE21 – Compound1:O9 A:GLN11:HE22 – Compound1:O17 A:GLY144:HN – Compound1:F32 |
1.86, 2.2, 2.28 |
| 2 | 22.344 | 3.87 | 5.62 | Ala12, Thr179 | A:ALA12:HN – Compound2:Cl36 A:THR179:HN – Compound2:O25 |
2.47, 2.49 |
| 3 | 48.891 | 6.4 | 6.37 | Gln11, Thr145 (2) | A:GLN11:HE22 – Compound4:O25 A:THR145:HN – Compound4:O29 A:THR145:HG1 – Compound4:O29 |
2.37, 2.08, 1.99 |
| 4 | 39.393 | 6.56 | 6.04 | Gln11, Asn101, Gly144, Thr145 (2) | A:GLN11:HN – Compound5:F31 A:ASN101:HD22 – Compound5:O17 A:GLY144:HN – Compound5:O25 A:THR145:HN – Compound5:F32 A:THR145:HG1 – Compound5:F31 |
2.38, 2.27, 2.09, 2.06, 1.97 |
| 5 | 49.205 | 6.47 | 6.53 | Gln11, Gly144, Thr145 (2) | A:GLN11:HN – Compound6:F31 A:GLY144:HN – Compound6:O25 A:THR145:HN – Compound6:F32 A:THR145:HG1 – Compound6:F31 |
2.14, 2.36, 2.01, 2.12 |
| 6 | 46.622 | 6.39 | 4.49 | Gln11 (2), Thr145 (2) | A:GLN11:HN – Compound7:F31 A:GLN11:HN – Compound7:F31 A:THR145:HN – Compound7:F32 A:THR145:HG1 – Compound7:F31 |
2.16, 2.33, 1.99, 2.25 |
| 7 | 50.116 | 6.45 | 6.47 | Gln11, Gly144, Thr145 (2) | A:GLN11:HN – Compound8:F31 A:GLY144:HN – Compound8:O25 A:THR145:HN – Compound8:F32 A:THR145:HG1 – Compound8:F31 |
2.14, 2.36, 2.01, 2.13 |
| 8 | 21.019 | 4.94 | 55.32 | Thr179, Asn228 | A:THR179:HG1 – Compound9:O9 A:ASN228:HD22 – Compound9:F32 |
1.95, 2.31 |
| 9 | 26.405 | 3.84 | 5.33 | Gln11 | A:GLN11:HE21 – Compound10:O29 | 2.46 |
| 10 | 49.236 | 6.27 | 6.15 | Gln11, Thr145 (2) | A:GLN11:HE22 – Compound11:O26 A:THR145:HN – Compound11:O29 A:THR145:HG1 – Compound11:O29 |
2.35, 2.08, 1.99 |
| 11 | 27.909 | 4.94 | 5.54 | Gln11, Asn228 | A:GLN11:HE22 – Compound13:O9 A:ASN228:HD22 – Compound13:F33 |
1.93, 2.25 |
| 12 | 53.831 | 6.42 | 6.21 | Gln11, Thr145 (2) | A:GLN11:HE22 – Compound15:O26 A:THR145:HN – Compound15:O29 A:THR145:HG1 – Compound15:O29 |
2.35, 2.07, 1.98 |
| 13 | 46.529 | 6.43 | 6.23 | Gln11, Thr145 (2) | A:GLN11:HE22 – Compound16:O26 A:THR145:HN – Compound16:O29 A:THR145:HG1 – Compound16:O29 |
2.37, 2.08, 1.98 |
| 14 | 27.722 | 4.96 | 5.54 | Gln11, Asn228 | A:GLN11:HE22 – Compound17:O9 A:ASN228:HD22 – Compound17:F32 |
1.92, 2.26 |
| 15 | 23.307 | 4.34 | 5.85 | Gln11 (2), Ala12, Thr179, Assn228 | A:GLN11:HE21 – Compound18:O29 A:GLN11:HE22 – Compound18:O9 A:ALA12:HN – Compound18:Cl35 A:THR179:HG1 – Compound18:O9 A:ASN228:HD22 – Compound18:F33 |
2.43, 1.92, 2.44, 1.88, 2.27 |
| 16 | 53.343 | 6.53 | 6.27 | Gln11, Thr145 (2) | A:GLN11:HE22 – Compound19:O26 A:THR145:HN – Compound19:O29 A:THR145:HG1 – Compound19:O29 |
2.37, 2.07, 1.97 |
| 17 | 32.672 | 2.43 | 3.85 | Asn101 | A:ASN101:HD22 – Compound21:O11 | 1.97 |
| 18 | 20.892 | 3.28 | 4.26 | Gln11, Asn101 | A:GLN11:HE22 – Compound22:O17 A:ASN101:HD22 – Compound22:O11 |
2.21, 1.8 |
| 19 | 25.625 | 3.84 | 4.93 | Asn101 | A:ASN101:HD22 – Compound23:O11 | 1.96 |
| 20 | 13.35 | 3.12 | 4.34 | Gln11, Asn101 | A:GLN11:HE22 – Compound24:O17 A:ASN101:HD22 – Compound24:O11 |
2.42, 2.15 |
| 21 | 26.439 | 2.7 | 4.31 | Gln11 | A:GLN11:HE22 – Compound25:O17 | 2.31 |
| 22 | 6.16 | 2.34 | 3.93 | Asn101 | A:ASN101:HD22 – Compound27:O17 | 1.99 |
| 23 | 29.12 | 3.21 | 5.13 | Asn101 | A:ASN101:HD22 – Compound28:O17 | 1.94 |
| 24 | 5.867 | -999.9 | -999.9 | – | – | – |
| 25 | 21.719 | 3.01 | 4.41 | Asn101 | A:ASN101:HD22 – Compound30:O11 | 1.82 |
| 26 | 29.209 | 2.77 | 4.46 | Asn101 | A:ASN101:HD22 – Compound31:O11 | 2.14 |
| 27 | 29.325 | 2.25 | 3.77 | Gly144 | A:GLY144:HN – Compound32:O11 | 2.04 |
| 28 | 34.071 | 3.46 | 4.43 | Asn101 | A:ASN101:HD22 – Compound33:O11 | 1.81 |
| 29 | 32.588 | 4.17 | 5.05 | Thr179 | A:THR179:HG1 – Compound34:O11 | 1.81 |
| 30 | 24.369 | 3.16 | 4.5 | Asn101 | A:ASN101:HD22 – Compound35:O11 | 2.39 |
| 31 | 25.165 | 2.86 | 4.62 | Ala12 | A:ALA12:HN – Compound36:O11 | 2.02 |
| 32 | 35.849 | 2.94 | 4.28 | Asn101 | A:ALA12:HN – Compound36:O11 | 1.86 |
| 33 | 36.615 | 2.93 | 4 | Gln11, Asn101 | A:GLN11:HE22 – Compound38:O17 A:ASN101:HD22 – Compound38:O11 |
2.33, 1.83 |
| 34 | 33.576 | 3.34 | 4.36 | Asn101, Thr179 | A:ASN101:HD22 – Compound39:O11 A:THR179:HG1 – Compound39:O17 |
1.82, 2.15 |
| 35 | 23.285 | 2.6 | 4.11 | Tyr224 | A:TYR224:HH – Compound40:O17 | 2.18 |
| 36 | 38.668 | 3.79 | 4.52 | Thr145 | A:THR145:HG1 – Compound41:O19 | 2.46 |
| 37 | 40.175 | 2.77 | 4.59 | Thr179 | A:THR179:HG1 – Compound44:O17 | 1.84 |
| 38 | 20.048 | 3.09 | 4.21 | Asn101, Thr179 | A:ASN101:HD22 – Compound45:O11 A:THR179:HG1 – Compound44:O17 |
2.14, 1.81 |
The reference ligand MDL-27048 has the docking score of 42.8 kcal/mol has the H-bond interactions with Gly144, Thr145. Compound 12 ((E)-3-(3-bromo-2-(2,6-dinitro-3-(trifluoromethyl)phenoxy)phenyl)-1-(4-chlorophenyl)prop-2-en-1-one) show highest docking score of 53.8 kcal/mol with H-bond interactions at Gln11, Thr145 amino acids as shown in Figure 7a, which explains the nitro groups attached on phenyl ring responsible for H-bonding with Gln11, Thr145 amino acids. Highest fitness score compound 13 ((E)-3-(3-chloro-2-(2,6-dinitro-3-(trifluoromethyl)phenoxy)phenyl)-1-(4-chlorophenyl)prop-2-en-1-one) show docking score of 46.5 kcal/mol with H-bond interaction at Gln11, Thr145 amino acids shown in Figure 7b explains the nitro groups attached to phenyl ring responsible for H-bonding with Gln11, Thr145 amino acids. High active compound 3 ((E)-3-(3-chloro-2-(2,6-dinitro-3-(trifluoromethyl)phenoxy)phenyl)-1-(p-tolyl)prop-2-en-1-one) show docking score of 48.8 kcal/mol with H-bond interactions at Gln11, Thr145 amino acids as shown in Figure 7c, which explain the nitro groups attached to phenyl ring shows interactions. The result shows the presence of electron withdrawing groups on chalcone moiety showing good interaction in the active site of the receptor. So the result explains presence of the electron withdrawing groups enhances the activity of the chalcone derivatives towards tubulin receptor.
Based on the results the molecules modified to improve the inhibitory activity toward tubulin. Compound 3 were chosen as reference structure to design new set of compounds. The newly designed compounds and their predicted pIC 50 along with their structure were shown in Table 9. The result shows all compounds with good predicted activity in the range of 5.16-5.59. The designed compounds were docked into the active site of the tubulin receptor. The docking results shown in Table 10, the compounds showed better docking score than reference compound, which indicates that the model has good predictability and can be used to design novel compounds with better inhibitory activity.
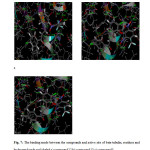 |
Fig7: The binding mode between the compounds and active site of beta-tubulin, residues and hydrogen bonds are labeled a) compound 12 b) compound 13 c) compound 3 Click here to View Figure |
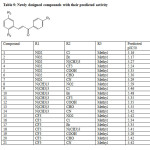 |
Table9: Newly designed compounds with their predicted activity Click here to View table |
Table 10: Docking score and H-bond interactions of newly designed compounds
| Compound | Docking score (kcal/mol) | LigScore1 | LigScore2 | H-Interactions | H-Bond Monitor | H-bond Distance Ao |
| 1 | 48.482 | 4.03 | 5.51 | Thr145 (2) | A:THR145:HN – Compound1:O18 A:THR145:HN – Compound1:O19 |
2.09, 2.08 |
| 2 | 49.244 | 3.88 | 5.67 | Thr145 (2) | A:THR145:HG1 – Compound2:O18 A:THR145:HN – Compound2:O18 |
2.04, 1.97 |
| 3 | 58.531 | 4.19 | 5.36 | Thr145 | A:THR145:HN – Compound3:O19 | 2.06 |
| 4 | 48.803 | 4.35 | 5.72 | Ala12, Asn228 | A:ALA12:HN – Compound4:F22 A:ASN228:HD22 – Compound4:O18 |
2.04, 2.03 |
| 5 | 37.247 | 4.9 | 5.74 | Gln11, Thr145 | A:GLN11:HE21 – Compound5:O23 A:THR145:HN – Compound5:O18 |
2.33, 2.05 |
| 6 | 49.944 | 4.35 | 5.74 | Thr145 (2) | A:THR145:HN – Compound6:O19 A:THR145:HG1 – Compound6:O19 |
2.04, 2.06 |
| 7 | 50.994 | 4.4 | 5.45 | Gln11, Thr145 | A:GLN11:HE21 – Compound7:N22 A:THR145:HN – Compound7:O18 |
2.36, 2.04 |
| 8 | 79.307 | 1.96 | 4.44 | – | – | – |
| 9 | 81.706 | 1.84 | 4.28 | – | – | – |
| 10 | 80.738 | 1.93 | 4.65 | – | – | – |
| 11 | 74.498 | 2.15 | 4.58 | – | – | – |
| 12 | 70.881 | 1.84 | 4.59 | – | – | – |
| 13 | 81.317 | 1.91 | 4.56 | – | – | – |
| 14 | 83.426 | 1.94 | 4.62 | – | – | – |
| 15 | 47.782 | 4.8 | 5.76 | Thr145 (2), Asn228 | A:THR145:HN – Compound15:O24 A:THR145:HG1 – Compound15:O24 A:ASN228:HD22 – Compound15:F20 |
2.05, 1.98, 2.13 |
| 16 | 47.696 | 3.86 | 5.68 | Thr145 (2) | A:THR145:HN – Compound16:F21 A:THR145:HG1 – Compound16:F21 |
2.18, 1.99 |
| 17 | 48.021 | 3.66 | 5.49 | Gly144, Thr145 | A:GLY144:HN – Compound17:F20 A:THR145:HN – Compound17:F21 |
2.27, 2.16 |
| 18 | 47.615 | 4.34 | 5.4 | Asn101, Gly144 | A:ASN101:HD21 – Compound18:F21 A:GLY144:HN – Compound18:F19 |
2.44, 2.17 |
| 19 | 36.987 | 3.69 | 5.29 | Gly144, Thr145 | A:GLY144:HN – Compound19:F19 A:THR145:HN – Compound19:F20 |
2.33, 2.17 |
| 20 | 48.481 | 3.87 | 5.46 | Gly144, Thr145 | A:GLY144:HN – Compound20:F21 A:THR145:HN – Compound20:F19 |
2.26, 2.16 |
| 21 | 47.332 | 3.85 | 5.53 | Gly144, Thr145 | A:GLY144:HN – Compound21:F20 A:THR145:HN – Compound21:F21 |
2.25, 2.16 |
Conclusion
Ligand based pharmacophore model generated for the series of chalcone derivatives with tubulin inhibitory action to understand the various structural features. PHASE was used to generate the pharmacophore model after successful pharmacophore generation the highest survival score model was used for further QSAR studies. The pharmacophore model reveals that one H-bond acceptor, two hydrophobic groups and two aromatic rings are essential features for ligand binding. QSAR model shows good statistical significance and explains presence of the electron withdrawing, negative and positive ionic groups on chalcone moiety enhances the activity of the compounds towards the tubulin protein. The QSAR model also supported by molecular docking studies the compounds having electron withdrawing group shows good interaction with the beta-tubulin receptor. The Docking study shows Gln11, Asn101, Thr145 are important amino acids in the active site to interact with the ligands. The designed molecules based on the model showed better activity and docking score for the compound 2 (E)-3-(2-bromo-5-methylphenyl)-1-(4-nitrophenyl)prop-2-en-1-one) and 6 ((E)-4-methyl-2-(3-(4-nitrophenyl)-3-oxoprop-1-en-1-yl)benzaldehyde), which indicates the model has good predictability and fruitful experimental work in progress.
References
- Yan, L.; Jianjun, C.; Min, X.; Wei, L.; Duane, D. M. Pharm. Res. 2012, 29, 2943–2971.
- Dumontet, C.; Jordan, M. A. Drug. Discov. 2010, 9, 790-803.
- Paula, M. C.; James, H. N.; Jun, Z.; James, P. S.; Harish, C. J. Trends Pharmacol Sci. 2003, 24, 361-365.
- Kingston, D. G. J. Nat. Prod. 2009, 72, 507–515.
- Stanton, R. A.; Gernert, K. M.; Nettles, J. H.; Aneja, R. Med. Res. Rev. 2011, 31, 443-81.
- Kavallaris, M. Nat. Rev. Cancer. 2010, 10, 194-204.
- Ravelli, R. B.; Gigant, B.; Curmi, P. A.; Jourdain, I.; Lachkar, S.; Sobel, A. Nature. 2004, 428, 198–202.
- Dumontet, C.; Sikic, B. I. J. Clin. Oncol. 1999, 17, 1061-70.
- Nowakowska, Z. Eur. J. Med. Chem. 2007, 42, 125-37.
- En-Hui, Z.; Ru-Feng, W.; Shu-Zhen, G.; Bin, L. Evid Based Complement Alternat Med. 2013, 1-22.
- Hsieh, H. K.; Tsao, L. T.; Wang, J. P. J. Pharm. Pharmacol. 2000, 52, 163-171.
- Viana, G. S.; Bandeira, M. A.; Matos, F. J. Phytomed. 2003, 10, 189-195.
- Zhao, L. M.; Jin, H. S.; Sun, L. P.; Piao, H. R.; Quan, Z. S. Bioorg. Med. Chem. Lett. 2005, 15, 5027-5029.
- Mukarami, S.; Muramatsu, M.; Aihara, H.; Otomo, S. Biochem. Pharmacol. 1991, 42, 1447-1451.
- Liu, M.; Wilairat, P.; Go, L. M.; J. Med. Chem. 2001, 44, 4443-4452.
- Francesco, E.; Salvatore, G.; Luigi, M. Phytochem. 2007, 68, 939-953.
- Joseph, C. O.; Bhupinder, M.; Maureen, E.; Christopher, J. F.; Neil Towers, G. H. Canad. J. Plant. Patho. 1997, 19, 133-137.
- Simon, F. N.; Ming, C.; Thor, G. T.; Arsalan, K.; Brøgger, S. C. Bioorg. Med. Chem. Lett. 1995, 3, 449–452.
- Miranda, C. L.; Stevens, J. F.; Ivanov, V.; McCall, M.; Frei, B.; Deinzer, M. L.; Buhler, D. R. J. Agric. Food. Chem. 2000, 48, 3876-84.
- Siva Kumar, P. M.; Geetha Babu, S. K.; Mukesh, D. Chem. Pharmaceut. Bullet. 2007, 55, 44-49.
- Satyanarayana, M.; Tiwari, P.; Tripathi, K.; Srivastava, A. K.; Pratap, R. Bioorg. Med. Chem. Lett. 2004, 12, 883-889.
- Barford, L.; Kemp, K.; Hansen, M.; Kharazmi, A. Int. Immunopharmacol. 2002, 2, 545-55.
- Hui, Z.; Jia-Jia, L.; Jian, S.; Xian-Hui, Y.; Ting-Ting, Z.; Xiang, L.; Hai-Bin, G.; Hai-Liang, Z. Bioorg. Med. Chem. 2012, 20, 3212–3218.
- Ban-Feng, R.; Xiang, L.; Jian-Feng, T.; Yao, W.; Xiao-Liang, W.; Yan-Bin, Z.; Li-Sheng, W.; Hai-Liang, Z. Bioorg. Med. Chem. Lett. 2011, 19, 2688–2695.
- Dixon, S. L.; Smondyrev, A. M.; Rao, S. Chem. Biol. Drug. Des. 2006, 67, 370–372.
- Teli, M. K.; Rajanikant, G. K. J. Enzyme. Inhib. Med. Chem. 2011, 26, 1–13.
- Venkatachalam, C. M.; Jiang, X.; Oldfield, T.; Waldman, M. J. Mol. Graph. Model. 2003, 21, 289-307.
- Peyrot, V.; Leynadier, D.; Sarrazin, M.; Briand, C.; Rodriquez, A.; Nieto, J. M.; Andreu, J. M. J. Biol. Chem. 1989, 264, 21296-301.


ISSN Online: 2231-5039

![]()


