Influence of complexing agent on the growth of chemically deposited Ni3Pb2S2 thin films
Ho Soonmin
INTI International University, Putra Nilai, 71800, Negeri Sembilan, MALAYSIA
DOI : http://dx.doi.org/10.13005/ojc/300311
Article Received on :
Article Accepted on :
Article Published : 24 Sep 2014
Ni3Pb2S2 thin films were prepared by chemical bath deposition method. Here, the objective of this research was to investigate the influence of complexing agent on the properties of films.These films were characterized using atomic force microscopy, UV-Visible spectro photometer and X-ray diffraction. It was found that, as the concentration of tartaric acid increased, film thickness increased, but, the band gap reduced. For the films prepared using 0.1M of tartaric acid, the films were uniform and completely covered the substrates.
KEYWORDS:thin films; chemical bath deposition; thickness; band gap
Download this article as:| Copy the following to cite this article: Soonmin H. Influence of complexing agent on the growth of chemically deposited Ni3Pb2S2 thin films. Orient J Chem 2014;30(3). |
| Copy the following to cite this URL: Soonmin H. Influence of complexing agent on the growth of chemically deposited Ni3Pb2S2 thin films. Orient J Chem 2014;30(3). Available from: http://www.orientjchem.org/?p=4984 |
Introduction
Chemical bath deposition is one of the well-known deposition methods to produce thin films on a variety of substrates such as indium tin oxide, fluorine-doped tin oxide and microscope glass slides. Uses of films obtained by chemical bath deposition in applications such as solar cells, laser devices, diode devices, electronic and opto-electronic devices fabrications. In recent years, ternary chalcogenide thin films have become the subject of considerable interest due to the possibility of using these films in photo voltaic cells. These films have been prepared using different deposition methods such as chemical bath deposition (1-4), electro deposition (5), photo electrochemical deposition (6), successive ionic layer adsorption and reaction(7) and spray pyrolysis technique (8).
In this experiment, we report the deposition of ternary chalcogenide thin films using chemical bath deposition method at various concentrations of complexing agent for the first time. In this paper, we present the results of UV-Visible spectro photometer and atomic force microscopy characterization of the absorption properties and surface morphology of the Ni3Pb2S2 thin films, respectively.
Materials and Methods
Reagents used for the deposition of Ni3Pb2S2 thin films include sodium thiosulfate, tartaric acid, nickel (II) sulfate and lead (II) nitrate. The microscope glass slide was used as substrate during the deposition process. The microscope glass slide was degreased with ethanol, then dipped into deionized water (a resistivity of 18.2 MWcm), and finally air dried. Before the deposition of thin films, 20 mL of 0.1M of nickel (II) sulfate and lead (II) nitrate were taken into separate beakers. Following that, 20 mL of various concentrations (0.1M, 0.125M and 0.15M) of tartaric acid solutions was added into each beaker. Finally, microscope glass slide was dipped vertically into a liquid contained in beaker. The beaker was maintained in the bath temperature of 70 °C and pH of 1.5. After 60 minutes, the obtained films were rinsed with distilled water and finally dried at 70 °C for 8 hours.
The surface morphology was examined by recording atomic force microscopy images with a Q-Scope 250 in contact mode with a commercial Si3N4 cantilever. The structural analysis of the obtained films was recorded on the X-ray diffractometer (Philips PW) with Cu-Ka radiation of 1.5418A wavelength. Optical absorption study was carried out using the Perkin-Elmer UV/Vis Lambda 20 spectro photometer. The film-coated glass slide was placed across the sample radiation pathway while the uncoated glass slide was put across the reference path.
Results and discussion
Nowadays, it is quite common that complexing agent is used to improve the quality of films. As can be seen from literature review, complexing agents such as hydrazine (9), tri-sodium citrate (10), ammonia (11), triethanolamine (12), polyethyleneimine (13), sodium borohydride (14), tartaric acid (15), oxalic acid (15), acetic acid (15), disodium ethylenediaminetetraacetic acid (16) and ammonium hydroxide (17) were popular choices in the deposition of films. In this experiment, influence of complexing agent (tartaric acid) on the chemical bath deposited films has been investigated. Figure 1 demonstrated that Ni3Pb2S2 thin films were prepared under various concentrations of complexing agent ranging from 0.1 M to 0.15M. Three dimensional atomic force microscopy images of films were recorded over scan area of 10 µm X 10 µm.
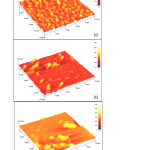 |
Figure1: Atomic force microscopy images of Ni3Pb2S2 thin films deposited at different concentrations of tartaric acid. (a) 0.1M (b) 0.125M (c) 0.15M Click here to View Figure |
The films prepared using 0.1M of tartaric acid exhibit a uniform distribution of grain sizes with average size in the range of 0.2-0.3µm.Meanwhile, it is seen that the grain size is likely to be irregular in shape as the concentration of tartaric acid is increased. The films grown using 0.125M and 0.15M of tartaric acid consist of average size of about 0.5-0.7µm, and 1-1.5µm, respectively. On the other hand, the film thickness increases with the increase of the concentration of complexing agent with values of 131.9, 539.7 and 633.4 nm using 0.1M, 0.125M and 0.15M, respectively.
The X-ray diffraction data of obtained films which deposited under various concentrations of tartaric acid are displayed in Table 1. According to Table 1, the observed d values are found to be in good match with the standard d values (JCPDS data: 00-006-0459). It means that the formation of Ni3Pb2S2 thin films under current experimental conditions. On the other hand, for the films deposited using 0.1M of tartaric acid, there are three peaks can be detected as Ni3Pb2S2 which attributed to the (012), (024) and (1010) planes. However, the number of Ni3Pb2S2 peaks is reduced to two, as the concentration of tartaric acid is increased to 0.125 M and 0.15 M, respectively.
Table 1 Comparison of observed d values with standard d values for thin films deposited under various concentrations of tartaric acid.
|
Concentration of tartaric acid |
Standard d values (Å) |
Observed d values (Å) |
(hkl) plane |
|
0.1 M |
3.97 |
3.88 |
012 |
|
1.97 |
1.98 |
024 |
|
|
1.31 |
1.31 |
1010 |
|
|
0.125 M |
3.97 |
3.88 |
012 |
|
1.97 |
1.98 |
024 |
|
|
0.15 M |
3.97 |
3.88 |
012 |
|
1.97 |
1.98 |
024 |
The values of optical absorption were obtained from UV-Visible spectro photometer in the range from 300 to 900 nm. All the films absorb light in the visible, near Infrared and UV ranges as indicated in Figure 2. By comparison, absorption spectra of the films prepared using 0.1M indicate higher absorption properties if compared with 0.125M and 0.15M of tartaric acid. This is because of dense Ni3Pb2S2 films were prepared using 0.1M tartaric acid as complexing agent. These films completely cover the substrates as shown in Figure 1a.
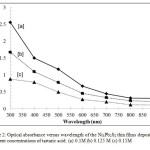 |
Figure2: Optical absorbance versus wavelength of the Ni3Pb2S2 thin films deposited at different concentrations of tartaric acid. (a) 0.1M (b) 0.125 M (c) 0.15M Click here to View Figure |
The band gap can be calculated using the absorption data as shown in Equation 1
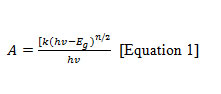
The relevant symbols can be defined as v is frequency, h is Planck’s constant and k is a constant value. Here, direct transition can be represented as n=1 while indirect transition can be indicated as n=4. The band gap is determined by extrapolations of the straight line portion of the plots of (Ahv)2 versus hv. The band gap for the films deposited using 0.1M tartaric acid is 1.9 eV. However, higher concentration of complexing agent results in decrease of band gap as shown in Figure 3. The band gap value for the films prepared using 0.125M and 0.15M is 1.8 and 1.6 eV, respectively. Analysis of data has shown that the direct transition band gap makes Ni3Pb2S2 films as potential materials for solar cell applications.
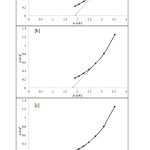 |
Figure3: Plots of (Ahv)2versus hvfor Ni3Pb2S2 thin films deposited at different concentrations of tartaric acid. (a) 0.1 M (b) 0.125 M (c) 0.15 M Click here to View Figure |
Acknowledgements
This research work was supported by INTI INTERNATIONAL UNIVRTSITY under Research Grant (Seed): INT-FHLS-03-01-2012.
Conclusion
Ni3Pb2S2 films have been successfully prepared in the presence of tartaric acid as complexing agent. The results presented and discussed in this research showed that the complexing agent significantly influenced properties of films. Atomic force microscopy, X-ray diffraction and UV-Visible spectro photometer results confirmed that the best concentration of complexing agent (0.1 M) which was important for the quality of films.
Reference
- Mohammed, M.A.; Mousa, A.M.; Ponpon, J.P. J. Semicond. Technol. Sci.2009, 9, 117-123 [CBD-r1]
CrossRef - Deo, S.R.; Singh, A.K.; Deshmukh, L.; Pandey, G. AIP Conf.Proc.2013, 1536, 251-252 . [cbd—r2]
CrossRef - Arbad, B.R.; Chonde, S.G.; Hankare, P.P.; Bhuse, V.M. Arch. Appl. Sci. Res.2011, 3, 422-430 [cbd—r3]
- Anuar, K.; Saravanan, N.; Tan, W.T.; Ho, S.M. Rev Soc Quim Peru,2010, 76, 54-60. [cbd-r4]
- Berg, D.M.; Djemour, R.; Gutay, L.; Zoppi, G.; Siebentritt, S.; Dale, P.J. Thin Solid Films, 2012, 520, 6291-6294 [ElectroD—r5 ]
CrossRef - Ham, S.Y.; Jeon, S.Y.; Lee, U.K.; Paeng, K.J.; Myung, N.S. Bull. Korean Chem. Soc. 2008, 29, 939-942. [photoelectrochemical-r6]
CrossRef - Su, Z.H.; Sun, K.W.; Han, Z.L.; Liu, F.Y.; Lai, Y.Q.; Li, J.; Liu, Y.X. J. Mater. Chem.2012, 22, 16346-16352 [silar—r7]
CrossRef - Latif, L.A. Basrah J. Sci.2012, 30, 123-129 [spray-r8]
- Ke, H.; Duo, S.; Liu, T.; Zhang, H.; Fei, X. Key Eng. Mater.2014, 591, 297-300 [N2H4-r9]
CrossRef - Liu, J.; Wei, A.; Zhan, Y. J. Alloys Compd.2014, 588, 228-234 [tri-sodium citrate-r10]
CrossRef - Shah, N.M. Int. J. Chemtech. Res. 2014, 6, 1959-1961 [ammonia-r11]
- Wilson, K.C.; Manikandan, E.; Basheer, A.M.; Mwakikunga, B.W. J. Alloys Compd.2014, 585, 555-560 [triethanolamine –r12]
CrossRef - De-Leon, A.; Rocha-Alonso, F.; Velazquez, E.F.; Castillo, S.J; Apolinar-Iribe, A. Chalcogenide Lett.2013, 10, 555-564. [polyethyleneimene-r13]
- Carrillo-Castillo, A.; Ambrosio-Lazaro, R.C.; Lira-Ojeda, E.M.; Martinez-Perez, C.A.; Quevedo-Lopez, M.A.; Aguirre-Tostado, F.S. Chalcogenide Lett.2013, 10, 421-425 [sodium borohydride-r14]
- Ubale, A.U.; Kantale, J.S.; Choudhari, D.M.; Mitkari, V.N.; Nikam, M.S.; Belkhedkar, M.R. Thin Solid Films,2013, 542, 160-166 [oxalic acid-r15]
- Ubale, A.U.; Sakhare, Y.S.; Bombatkar, S.M. Mater. Res. Bull.2013, 48, 3564-3571 [Na2edta-r16]
- Benghabrit, S.; Chaumont, D.; Adnane, M.; Hamzaoui, S. J. Optoelectron. Adv. Mater.2013, 15, 421-424 [ammonium hydroxide-r17]
CrossRef

This work is licensed under a Creative Commons Attribution 4.0 International License.
![]()
A New Edition of Web of Science
Journal Impact Factor
2022: 0.5
Five Year: 0.8
Journal is Indexed in

Cabells Whitelist
![]()


