Fatty Acid Composition of Some Potential Fish Oil from Production Centers in Indonesia
Sugeng Heri Suseno, Saraswati, Sri Hayati, Ayu Fitri Izaki
Technology of Aquatic Products Department Fisheries and Marine Sciences Faculty, Bogor Agricultural University Jl. Agatis, Kampus IPB Dramaga, Bogor 16680, West Java – Indonesia
DOI : http://dx.doi.org/10.13005/ojc/300308
Article Received on :
Article Accepted on :
Article Published : 30 Aug 2014
This study aimed to analyze the fatty acid composition of some potential fish oil originated from some production centers in Indonesia. Samples observed were softshell turtle oil, freshwater eel oil, shark liver oil, tuna oil, and lemuru oil. Fatty acid composition of the oil was analyzed and quantified using gas chromatography after being converted into FAME. SFA, MUFA, and PUFA detected was ranged from 1.67-37.99%, 3.17-38.34%, and 0.70-34.99%. Oleic acid became predominant fatty acid in sofshell turtle oil, freshwater eel oil, and shark liver oil. Tuna oil was rich in DHA (24.56%), while lemuru oil was rich in EPA (14.36%).
KEYWORDS:fatty acid composition; freshwater eel; lemuru; softshell turtle; shark liver; tuna
Download this article as:| Copy the following to cite this article: Suseno S. H, Saraswati, Hayati S, Izaki A. F. Fatty Acid Composition of Some Potential Fish Oil from Production Centers in Indonesia. Orient J Chem 2014;30(3). |
| Copy the following to cite this URL: Suseno S. H, Saraswati, Hayati S, Izaki A. F. Fatty Acid Composition of Some Potential Fish Oil from Production Centers in Indonesia. Orient J Chem 2014;30(3). Available from: http://www.orientjchem.org/?p=4472 |
Introduction
Fish oil is one of the product development from fishery commodities which potential to be developed. The global usage of fish oil in 2002 are edible (14%), industrial (5%) and aquatic (81%)21. The use of fish oil in the world in 2011 reached a number of 1 million tonnes18. Shepherd and Jackson27 stated that the use of fish oil in the world from 2005 to 2011 was dominated by its use in the field of aquaculture and human consumption. Fish oil demand increases time by time for various purposes. The development of aquaculture industry will lead to the increasing of fish oil demand, which fish oil is required for feed formulation. Public awareness of the importance of taking fish oil rich in omega – 3 fatty acids implicated with the increasing demand of fish oil for food industry and pharmaceutical use11.
According to the Ministry of Fisheries and Marine Affairs of Republic of Indonesia17, Indonesia’s capture fisheries production in 2012 reached 5.8 million tons, while total production from aquaculture reached 9.6 million tons. Indonesia’s fishery production is dominated by small pelagic and pelagic fish. The Indonesian aquaculture production is dominated by seaweed, tilapia, milkfish, and shrimp. Huge potential of Indonesian fisheries can give contribution for economic growth in Indonesia if it is optimally utilized. Moreover, Indonesia has a wide waters area where aquatic organisms grow and reproduce. Based on potency posessed, fish oil processing is very potential to be developed in Indonesia. There are some home industries producing fish oil from different raw materials in Indonesia. Examples of potential fish oil produced in some production centers in Indonesia are sardine oil and tuna oil from Java-Bali area, pangas fish oil from Kampar, Riau Islands, softshell turtle oil from Singkawang, West Sumatra, shark liver oil from West Nusa Tenggara and Pelabuhan Ratu, and etc. Information about fatty acid composition and chemical properties of Indonesian fish oil is needed, because it can give the view of fish oil quality and nutritional value which will be consideration for further processing and utilization. This study aimed to analyze the fatty acid composition of some potential fish oil originated from some fish oil production centers in Indonesia
Materials and Methods
Materials and Equipments
Fish oil samples were obtained from some fish oil production centers (home industry) in Indonesia. Softshell turtle (Amyda cartilaginea) oil was obtained from Singkawang, West Kalimantan. Freshwater eel (Monopterus sp.) oil was obtained from Sukabumi, West Java. Shark liver oil was obtained from production center in West Nusa Tenggara (shark liver oil 1) and Pelabuhan Ratu – West Java (shark liver oil 2). Tuna (Thunnus sp.) oil and lemuru (Sardinella lemuru) oil were obtained from Bali. All samples were kept in refrigerator (temperature ≤ 4°C) until analyzed. Some chemicals used in this study were chemicals for fatty acid composition analysis, such as isooctana, methanolic NaOH, BF3, saturated NaCl solution, anhydric Na2SO4, and fatty acid methyl ester (FAME) standard (Supelco 37 component FAME MIX). All chemicals were analytical grade. Some equipments used were some glasses, water bath, gas chromatography SHIMADZU GC2010 plus AFA PC with a cyanopropyl methyl sil column (capillary column), 10 mL syringe, flask, analytical balance, and micro pipette.
Fatty Acid Composition Analysis (AOAC 2005)
The method used for fatty acid composition analysis accorded to AOAC1 with method number 969.33. Sample of fat or oil in a flask was added by methanolic NaOH, then heated in a water bath for 20 minutes. BF3 reagent and internal standard were added to the mixture, and the mixture was heated again for 20 minutes. The mixture was cooled and then added by saturated NaCl and isooctana, subsequently the mixture was shaken well. Isooctana layer formed was transferred with the aid of pipette into a tube containing anhydrous Na2SO4 to remove H2O, and then awaited for 15 minutes. Liquid phase formed was separated, while oil phase was injected, previously injection of FAME standar mixture was performed. Retention time and peak of each component were measured and compared with the standard retention time to get information about the types and fatty acid components in the sample. Determination of fatty acid content in the samples can be calculated by using the formula as follows
Component content of samples = Ax/As x Cstandard x Vsample/100 x 100 % / Sample weight
Information
Ax : Sample area
As : Standard area
Cstandar : Standard concentration
Vsample : Sample volume
Result and Discussion
The principle of determination of the type and quantity of fatty acids was carried out based on the detection of fatty acid methyl esters in samples adjusted to the standard which have been injected before. Fatty acid methyl ester standard used in this study was Supelco 37 component FAME MIX. There were three categories of fatty acid methyl ester which would be the basis of the detection of fatty acids type in the sample, i.e. saturated fatty acids (SFA), monounsaturated fatty acids (MUFA), and polyunsaturated fatty acids (PUFA). Samples of this study comprised aquatic organisms oil from different habitat. There were oils derived from freshwater species (softshell turtle and freshwater eel) and oils derived from marine species (shark, tuna, and lemuru). Results are shown in Table 1
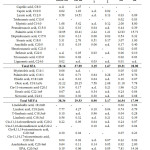 |
Table1: Fatty acid composition of some potential fish oil Click here to View table |
Table 1 shows fatty acid composition of some fish oil which were obtained from some fish oil production centers in Indonesia. The highest total fatty acid can be found in softshell turtle oil, while the lowest one was found in shark liver oil 2. Tuna oil had the highest polyunsaturated fatty acids (PUFA) content and the lowest PUFA content can be found in a sample shark liver oil 2. Large amount of saturated fatty acids (SFA) was found in freshwater eel oil, with lauric acid and palmitic acid as predominant fatty acid. Monounsaturated fatty acids (MUFA) content was highest in softshell turtle oil, with oleic acid (32.22%) as predominant fatty acid. The lowest total fatty acid detected was found in shark liver oil 2 and shark liver oil 1 having value 5.54% and 13.87%, respectively.
Steffens dan Wirth28 stated that fatty acid composition is influenced by lipid pattern of food consumed by fish. Osman et al.19 showed that PUFA content of marine fish is higher than PUFA content contained in freshwater fish. From the result of this study, we can find that PUFA content of tuna oil (34.99%) and lemuru oil (22.82%) was higher than those softshell turtle oil (10,24%) and freshwater eel oil (5.07%). Ozogul and Ozogul20 examined fat content and fatty acid composition from eight commercial fish originated from marine waters around Turkey. All eight commercial fish had 25.5-38.7% SFA content, 13.2–27.0% MUFA content, and 24.8-46.4% PUFA content. Its study showed that marine fish tend to contain high PUFA and SFA content. It is appropriated to study of Edirisinghe et al.7 showing pelagic fish species from Sri Lanka waters included yellow stripped scad, indian mackerel, and sardine had dominant SFA content and then followed by its PUFA content. Different fatty acid composition of one to another species is affected by some factors, such as temperature, season, place of growing, fish species, age, sex, and dietary habits26,4,29.
Result of this study shows that softshell turtle oil from Singkawang, West Kalimantan was dominated by palmitic acid (19.95%), oleic acid (32.22%), and linoleic acid (7.757%). EPA and DHA content of the softshell turtle oil was only 0.19% and 0.422%, respectivley. Huiqin et al.12 showed that the major components of softshell turtle oil are palmitoleic acid, palmitic acid, stearic acid, oleic acid, linoleic acid, EPA, and DHA. Softshell turtles are popular for food because of the palatability and desirability of their meat. Softshell turtle is one of the most common ingredients in traditional Chinese medicines23. Indonesia is considered as one of the major producer of softshell turtle (Amyda cartilaginea). Major harvest areas of A. cartilaginea for consumption and pet in Indonesia are Kalimantan and Sumatra Island. A. cartilaginea is popular among Chinese ethnic for soup, known as pi-oh. The pi-oh soup often sold in Jakarta, Balikpapan, Pontianak and Medan, where there are many Chinese community, as well as in Denpasar, where the soup is considered delicacy for tourists. Pi-oh is believed to increase stamina, as well as functioning as aphrodisiac16. Besides processed into soup, production of its oil is one of softshell turtle oil diversification. Study of Jing et al.13 proved that topical use of turtle oil give effect on wound healing of superficial second degree burn in rats. Jing et al.13 added that turtle oil can enhance the proliferation of repair cells in wound tissues of rats, by earlier repithelization, thus accelerating wound healing.
Freshwater eel oil observed had the total fatty acid at 72.59%. Among these fatty acids detected, lauric acid, palmitic acid, oleic acid, and linoleic acid were present in hight amount. Its predominant fatty acid content were 14.51%, 10,41%, 28.25%, and 4.27%, respectively. SFA content of freshwater eel oil was present in highest amount, then followed by MUFA (29.53%) and PUFA (5.07%). SFA content of freshwater eel oil was 37.99%. Dutta and Dutta6 examined fatty acid profile of freshwater eel (Monopterus chucia). Predominant fatty acids found in muscle of Monopterus chucia were heptadecanoic acid/C17:0 (35.29%) for its SFA content, palmitoleic acid/C16:1 (11.16%) for its MUFA content, and linoleic acid/C18:2 (2.77%) for its PUFA content. From two studies mentioned, it shows the tendency of linoleic acid concentration in freshwater eel. Linoleic acid is a precursor of n-6 fatty acid which became typical in freshwater fish. Razak et al.25 showed that major fatty acids in the Monopterus albus oil from the body were palmitic, oleic, arachidonic, and docosahexaenoic acid. Arachidonic acid and docosahexaenoic acid content of its body oil were 8.25% and 6.21%. The different of freshwater eel fatty acid composition is caused by different species observed.
This study shows that shark liver oil observed had the lowest total fatty acid. Predominant fatty acid detected in both shark liver oil were palmitic acid (2.42% and 1.21%) and oleic acid (7.58% and 2.68%). High monoenoic acid content could be a general characteristic of shark liver oil and dog fish liver oil9. Low value of fatty acids detected may caused by high proportion of squalene (C30H50) contained in shark liver oil observed. Raw materials used in the production of liver oil in West Nusa Tenggara and Pelabuhan Ratu are hiu botol fish which included to family squalidae and centrophoridae. Shark liver oil produced in West Nusa Tenggara and Pelabuhan ratu are known as a source of squalene. Storage of these shark liver oil in a freezer for less than seven days could not fractionate the oil structure, because its squalene content has a very low freezing point.
PUFA content of shark liver oil was 1.82% (shark liver oil 1) and 0.7% (shark liver oil 2). So, its proportion was about 13.12% (shark liver oil 1) and 12.57% (shark liver oil 2) from the total fatty acid. This result is in accordance to study of Bakes and Nichols5 showing that PUFA content in liver oil from six deep-sea shark species (Somniosus pacificus, Centrocymnus plunketi, Centrocymnus crepidater, Etmopterus granulosus, Deania calcea, and Centrophorus scalpratus) were relative minor component (1-13%). Liver oil from six deep-sea shark species observed by Bakes and Nichols5 contained squalene as major hydrocarbon having percentage about 50-82%. Deep sea sharks have generally higher squalene content in the liver than sharks found in shallower waters. Squalene is usually hydrogenated to squalane which is more stable compound used by the cosmetic industry15. Squalene has some advantages for the skin as an emollient and antioxidant, and for hydration and its antitumor activities. It is also used as a material in topically applied vehicles such as lipid emulsions and nano structured lipid carriers (NLCs)10.
Tuna oil obtained from Bali had DHA content in high amount, it was 24.56%. These tuna oil was dominated by palmitic acid (12.93%) as the main SFA, oleic acid (11.18%) as the main MUFA, EPA (7.81%), and DHA (24.56%). Total PUFA in tuna oil reached a number of 34.99%. Study of Alkio et al.3 showed that tuna oil contained high DHA which could reach 18.3% in tuna oil and 23.7% in tuna oil ethyl ester. Other major free fatty acid in tuna oil observed by Alkio et al.3 were palmitic acid (22.8%), oleic acid (17.7%), and EPA (4.6%). The result of this study is appropriated to the study of Estiasih et al.8 showing tuna oil had high DHA content (25.41%), and then followed by palmitic acid (17.37%), oleic acid (12.69%), and EPA (6.03%).
Lemuru oil observed had SFA content, leading as the major fatty acids group. Among these SFA content, palmitic acid was present in high amount, its value was 15.71%. Palmitoleic acid (9.76%) and oleic acid (7.78%) dominated its MUFA content. EPA and DHA were a major PUFA and their values were 14.36% and 4.60%, respectively. This study was in accordance to Khoddami et al.14, showing that Sardinella lemuru waste lipid had high EPA and DHA content which ranged from 1.73-2.76% for EPA content and 11.87-15.95% for DHA content. Omega-3 fatty acids in fish can be concentrated by the food network. Marine plankton contains low omega-6 unsaturated fatty acids, but high in EPA and DHA content, so it implies on the high content of omega-3 fatty acids in marine fish2. EPA and DHA are vital nutrient needed to maintain health function of cardiovascular system, human growth, and intellectual development22.
Another important aspect which must be noted is the n-3 : n-6 ratio of the unsaturated fatty acids of fish oil. The n-3 : n-6 ratio can compare relative nutritional values of fish oil. A ratio within 1.1 to 1.5 is considered healthy for human diet30. The n-3 : n-6 ratios of softshell turtle oil, freshwater eel oil, and shark liver oil 1 were under 1. Their n-3 : n-6 ratios were 0.14 for softshell turtle oil, 0.13 for freshwater eel oil, and 0.4 for shark liver oil 1. Tuna oil had highest n-3 : n-6 ratio (18.59), then followed by shark liver oil 2 (6.78) and lemuru oil (5.87).
Conclusion
Major free fatty acids in softshell turtle oil from Singkawang (West Kalimantan) were palmitic acid (19.95%), oleic acid (32.22%), and linoleic acid (7.77%). Freshwater eel oil observed contained high amount of lauric acid (14.51%), palmitic acid (10.41%), oleic acid (28.25%), and linoleic acid (4.27%). Lowest total fatty acid can be found in shark liver oil from West Nusa Tenggara and shark liver oil from Pelabuhan Ratu-West Java. Their total fatty acid were dominated by oleic acid, the typical fatty acid found in shark liver oil. Tuna oil was rich in DHA content (24.56%). EPA content of lemuru oil was present as predominant polyunsaturated fatty acid, and its value was 14.36%.
References
- AOAC. Official Method of Analysis. Association of Analytical Chemist, Inc. USA, (2005).
- Ackman, R.G. Program Food Nutritional Science. 1989, 13, 161-289.
- Alkio, M; Gonzalez, C.; Jänttia, M.; Aaltonena, O. JAOCS. 2000, 77(3), 315-321.
- Bandarra, M.N.; Batista, I. I.; Nunes, M.L.; Empis, J.M.; Christie, W.W. J. Food Sci. 1997, 62, 40.
- Bakes, M.J.; Nichols, P.D. Comparative Biochemistry and Physiology Part B: Biochemistry and Molecular Biology. 1995, 110(1), 267-275.
- Dutta, M. and Dutta, P. Oriental Journal of Chemistry. 2013, 29(4), 1501-1505.
- Edirisinghe, E.M.R.K.B.; Perera, W.M.K.; Bamunuarachchi, A. Proceedings of the APFIC Symposium, Beijing, People’s Republic of China, 24-26 September 1998, RAP Publication (FAO). 24, 172-181.
- Estiasih, T.; Ahmadi, K.; Nisa, F.C. Advance Journal of Food Science and Technology. 2013, 5(5):522-529.
- Gruger, E.H. Fatty Acid Composition of Fish Oils. Bureau of Commercial Fisheries. Washington, (1967)
- Huang, Z.R.; Lin, Y.K.; Fang, J.Y. Molecules. 2009, 14, 540-554, doi:10.3390/molecules14010540.
- Hjaltason, B.; Epax, A.S.; Haraldsson, G.G. Fish oils and lipids from marine sources. In : Gunstone, F.D. (Eds). Modifying Lipids for Use in Food. : Woodhead Publishing Limited. England, (2006)
- Huiqin, W.; Guiying, Z.; Zhiqing, C. Journal of Instrumental Analysis. 1997, 1997(2).
- Jing, B.; Yaping, T.; Hongming, Y.; Sen, H.; Zuo, X. Infection Inflammation Repair 2007, 2007(3), 162-165.
- Khoddami, A.; Ariffin, A.A.; Bakar, J.; Ghazali, H.M. World Applied Sciences Journal. 2009, 7(1), 127-131
- Kjerstad, M.; Fossen, I.; Willemsen, H.M. J. Northw. Atl. Fish. Sci. 2003, 31, 333-335.
- Mardiastuti, A. Harvest Sustainability of Asiatic Softshell Turtle (Amyda cartilaginea) in Indonesia. Directorate General of Forest Protection and Nature Conservation, Jakarta, (2008).
- Ministry of Fisheries and Marine Affairs Republic of Indonesia. Marine and Fisheries in Figures 2013. Ministry of Fisheries and Marine Affairs Republic of Indonesia, Jakarta (2013).
- [NISSUI]. 2014. Global trends in the fishmeal and fish oil markets and the reality of procurement. http://www.nissui.co.jp/english/corporate/frontier/04/02.html [6th February 2014].
- Osman, H.; Suriah, A.R.; Law, E.C. Food Chemistry, 2001, 73, 55–60.
- Ozogul, Y.; Ozogul, F.; Alagoz, S. Food Chemistry, 2006, 103, 217-223.
- Pike, I. International Aqua Feed, 2005, 8, 38-40.
- Pike, I.H.; Jackson, A. Fish oil: production and use now and in the future. Lipid Technology. WILEY-VCH Verlag GmbH & Co. KGaA,Weinheim. Maret 2010, 22(3):354-375. In: Houlihan, D.; Boujard, T.; Jobling, M (Eds). Food Intake in Fish. Blackwell Scientific. Oxford, (2010)
- Pro Wildlife. The Decline of Asian Turtles. Pro Wildlife. Munich, Germany, (2000).
- Rainuzzo, J.R.; Reitan, K.I.; Jorgensen, L.; Olsen, Y. Biochem. Physiol, 1994, 107A, 699-710.
- Razak, Z.K.A.; Basri, M.; Dzulkefly, K.; Razak, C.N.A.; Salleh, A.B. Malaysian Journal of Analytical Sciences, 2001, 7(1), 217-220.
- Saito, H.; Ishihara, K.; Murase, T. J. Sci. Food. Agri, 1997, 73:53-59.
- Shepherd, C.J. and Jackson, A.J. 2012. Global fishmeal and fish oil supply-inputs, outputs, and markets. http://www.seafish.org/ [6th February 2014].
- Steffens, W. and Wirth, M. Archieves of Polish Fisheries, 2005, 13(1), 5-16.
- Tanakol, R.; Yazici, Z.; Sener, E.; Sencer, E. Lipids, 1999, 34, 291-297.
- Zuraini, A.; Somchit, M.N.; Solihah, M.H.; Goh, Y.M.; Arifah, A.K.; Zakaria, M.S, N.; Somchite, M.A.; Rajionc, Z.A.; Zakariae, A.M.; Jaisa, M. Food Chemistry, 2006, 97(4), 674-678.

This work is licensed under a Creative Commons Attribution 4.0 International License.
![]()
A New Edition of Web of Science
Journal Impact Factor
2022: 0.5
Five Year: 0.8
Journal is Indexed in

Cabells Whitelist
![]()


