Development and Validation of a New Rp-Hplc Method For Simultaneous Estimation of N-Acetylcysteine And L – Arginine In Combined Dosage form
DOI : http://dx.doi.org/10.13005/ojc/300357
Download this article as:
![]()
An isocratic, reversed phase-liquid chromatographic method was developed for quantitative determination of N-acetylcysteine and L-Arginine in combined dosage form. A Waters Xterra Rp8, (150*4.6*5µm) column with a mobile phase containing a Phosphate Buffer (pH 4.5) and Methanol (90: 10 v/v) was used. The flow rate was maintained at 0.8 ml/min, column temperature at 30°C and effluents were monitored at 248 nm. The retention times of N-acetylcysteine and L-Arginine were found to be 2.697 min and 3.156 min, respectively. The correlation co-efficient for N-acetylcysteine and L-Arginine was found to be 0.99 and 0.99, respectively. The proposed method was validated with respect to linearity, accuracy, precision, specificity, and robustness. Recovery of N-acetylcysteine and L-Arginine in formulations was found to be in the range of 97-103% and 97-103% respectively confirms the non-interferences of the excipients in formulation. Due to its simplicity, rapidness and high precision, this method can be successfully applied for estimation of N-acetylcysteine and L-Arginine in combined pharmaceutical dosage forms.
KEYWORDS:RP-HPLC,Liquid chromatography; L-Arginine and N-acetylcysteine.
Arginine is an α-amino acid. The L-form is one of the 20 most common natural amino acids. At the level of molecular genetics, in the structure of the messenger ribonucleic acid mRNA, CGU, CGC, CGA, CGG, AGA, and AGG, are the triplets of nucleotide bases or codons that code for arginine during protein synthesis. In mammals, arginine is classified as a semiessential or conditionally essential amino acid, depending on the developmental stage and health status of the individual. Preterm infants are unable to synthesize or create arginine internally, making the amino acid nutritionally essential for them. There are some conditions that put an increased demand on the body for the synthesis of L-arginine, including surgical or other trauma, sepsis and burns. L-arginine may also play an important role in the treatment of cardiovascular disease due to its anti atherogenic, anti-ischemic, anti platelet, and anti thrombotic properties. It has been promoted as a growth stimulant and as a treatment for erectile dysfunction in men.
N-Acetylcysteine is a pharmaceutical drug and nutritional supplement used primarily as a mucolytic agent and in the management of paracetamol (acetaminophen) overdose. Other uses include sulfate repletion in conditions, such as autism, where cysteine and related sulfur amino acids may be depleted. N-Acetylcysteine causes cleavage of disulfide bonds by converting them to two sulfhydryl groups. This action results in the breakup of mucoproteins in lung mucus, reducing their chain lengths and causes thinning of the mucus thus facilitates easy removal of the same and therefore improving conditions such as bronchitis and flu. N-acetyl cysteine
is also used for preventing alcoholic liver damage; for protecting against environmental pollutants including carbon monoxide, chloroform, urethanes and certain herbicides; for reducing toxicity of ifosfamide and doxorubicin, drugs that are used for cancer treatment; as a hangover remedy; for preventing kidney damage due to certain X-ray dyes; and for human immunodeficiency virus (HIV) [1,2].
A number of spectrophotometric, colorimetric, chemiluminescence, Liquid chromatographic methods with electrochemical, fluorimetric, mass and ultraviolet detectors and GC have been widely applied as the main methods of detection in biological samples and pharmaceuticals. Several liquid chromatographic (LC) methods involve spectrophotometric detection with pre or post-column derivatization, where time consuming extraction or long derivatization steps hamper the studies of this compound [3-11].
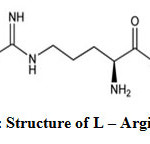 |
Fig1: Structure of L–ArginineClick here to View Figure |
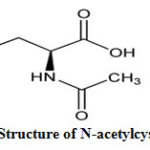 |
Fig2: Structure of N-acetylcysteine Click here to View Figure |
The present work concerns the method development, method validation of L-Arginine and N-acetylcysteine in combined pharmaceutical dosage form. The developed Liquid Chromatographic method was validated with respect to specificity, limit of detection (LOD), limit of quantification (LOQ), linearity, precision, accuracy and robustness. These studies were performed in accordance with established ICH guidelines
EXPERIMENTAL
Instrumentation
The separation was carried out on HPLC system with Waters e2695 alliance with binary HPLC pump, Waters 2998 PDA detector, Waters Empower2 software, Waters Xterra Rp8, (150*4.6*5µ) column.
Chemicals and Reagents
N-acetylcysteine and L-Arginine were procured as gift samples from Dr.Reddy’s Laboratories Ltd., Hyderabad. Methanol of HPLC grade was purchased from E. Merck (India) Ltd., Mumbai. MonoPotassium Phosphate of AR grade was obtained from S.D. Fine Chemicals Ltd., Mumbai and milli Q water.
HPLC Conditions
The mobile phase consisting of Phosphate Buffer (pH 4.5) : Methanol (HPLC grade) were filtered through 0.45µ membrane filter before use, degassed and were pumped from the solvent reservoir in a ratio of 90:10 v/v was pumped into the column at a flow rate of 0.8 ml/min. The column temperature was maintained at 30°C. The detection of effluents was performed at 248 nm and the run time was finalized as 6 min. The volume of injection was 10µl prior to injection of the drug solution the column was equilibrated for at least 15 min. with the mobile phase flowing through the system.
Preparation of standard solution
N-Acetylcysteine
Accurately weighed quantity, 120 mg of N-Acetylcysteine and 160 mg of L-Arginine was transferred into 100 ml of volumetric flask. 30 ml of mobile phase was added to this and sonicated for 15 min. Finally volume was made up to 100 ml with mobile phase. 5ml above solution was transferred into 25ml volumetric flask and diluted to the mark with mobile phase.
Preparation of sample solution
Accurately weighed 500 mg of granules of dosage form was transfered into 100 ml of volumetric flask. 25 ml of mobile phase was added to this and sonicated for 30 mins. Finally volume was made up to 100 ml with mobile phase. 5ml above solution was transferred into 25ml volumetric flask and diluted to the mark with mobile phase.
RESULTS AND DISCUSSION
Method Development
The analytical procedure for the estimation of L-Arginine and N-acetylcysteine in marketed formulation was optimized with a view to develop a precise and accurate assay method. Appropriate chromatographic separation was achieved on Waters Xterra Rp8, (150*4.6*5µm). Various mobile phase systems were prepared and used to provide an appropriate chromatographic separation, but the proposed mobile phase containing Phosphate Buffer (pH 4.5) and Methanol in the ratio of 900:100 (v/v) gave a better resolution. Using UV-visible PDA detector at 248 nm carried out the detection. Amongst the several flow rates tested, the flow rate of 0.8 ml/min was the best suited for both the drugs with respect to location and resolution of peaks. The retention time of L-Arginine and N-acetylcysteine was found to be 2.697 min and 3.156 min respectively. The chromatograms of standard and sample solution of L-Arginine and N-acetylcysteine were shown in Figure 3, 4 respectively. The asymmetry factor of L-Arginine and N-acetylcysteine was 1.353and 1.384 found to be respectively, which indicates symmetrical nature of the peak. The USP resolution of 7.957 was achieved between L-Arginine and N-acetylcysteine. The USP plate count of L-Arginine and N-acetylcysteine was 7190 and 8590 found to be respectively, which indicates column efficiency for separation. System suitability parameters such as Peak asymmetry, Resolution and Number of theoretical plates are meeting with ICH requirements. The results of analysis shows that the amounts of drugs estimated were in good agreement with the label claim of the formulations [12-14].
|
Parameters |
N-Acetyl cysteine |
L-Arginine |
|
Resolution |
||
|
Theoretical plates |
4588 |
5005 |
|
Tailing |
1.353 |
1.384 |
|
Correlation Coefficient |
0.99 |
0.99 |
|
Regression Equation |
y = 16616x |
y = 19288x |
|
LOD |
2.87 |
2.98 |
|
LOQ |
9.56 |
9.94 |
Table 1. System suitability parameters
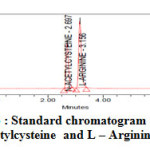 |
Figure3 : Standard chromatogram for N-acetylcysteine and L – Arginine Click here to View Figure |
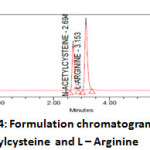 |
Figure4: Formulation chromatogram for N-acetylcysteine and L – ArginineClick here to View Figure |
3.2.Method Validation
Method validation of above set method is established by performing the below listed validation parameters as per ICH guidances.
System Suitability Studies
System suitability was determined before sample analysis from duplicate injections of the standard solutions of L-Arginine and N-acetylcysteine. The column efficiency, resolution and peak asymmetry were calculated for the standard solutions. Resolution between L-Arginine and N-acetylcysteine peaks was found to be 7.957. USP tailing (Peak Asymmetry) for L-Arginine and N-acetylcysteine were found to be 1.353 and 1.384 respectively. Number of theoretical plates (USP plate count) for L-Arginine and N-acetylcysteine were found to be 5005 and 4588 respectively.
The values obtained demonstrated the suitability of the system for the analysis of this drug combinations, system suitability parameters may fall within ± 3 % standard deviation range during routine performance of the method [15-17].
Specificity
Specificity is the ability to assess unequivocally the analyte in presence of components which may be expected to be present. Typically these might include impurities, degradants, excipients etc. Placebo interference was evaluated by analyzing the placebo prepared by the test method. No peak due to placebo was detected at the retention time of Arginine and N-acetylcysteine. The specificity of the developed method was also conducted in presence of its degradation products.
Precision
The precision of method was verified by repeatability and intermediate precision. Repeatability was checked by injecting six individual sample preparations of Arginine and N-acetylcysteine. Percent relative standard deviation (RSD) of the area for each drug was calculated. The results of precision study are provided in Table 2.
Table 2: Precision studies of L-Arginine and N-acetylcysteine
| S.No | Sample Wt(mg) | Area(L-Arginine) | Area(N-Acetyl cysteine) | %Assya(L-Arginine) | %Assya(N-Acetyl cysteine) |
| 1 | 500 |
3453165 |
5883357 |
99 | 100 |
| 2 | 500 |
3450236 |
5889593 |
99 | 100 |
| 3 | 500 |
3452627 |
5886255 |
99 | 100 |
| 4 | 500 |
3451253 |
5885959 |
99 | 100 |
| 5 | 500 |
3452239 |
5883805 |
99 | 100 |
| 6 | 500 |
3450246 |
5880174 |
99 | 100 |
Accuracy
The accuracy of the method was determined by recovery experiments. The recovery studies were evaluated in triplicate using three concentration levels 50%, 100% and 150%. The percentage recovery data was obtained, added recoveries of standard drugs were found to be accurate (Table III & IV).
Linearity and Range
The linearity of the method was determined at five concentration levels (50%, 75%, 100%, 125% and 150%). Linearity test solutions were prepared by diluting the stock solutions to the required concentrations. The calibration curves were plotted between the responses of peak area versus concentration of analyte. The slope and intercept value for calibration curve was y = 16616 x (r2=0.99) for N-Acetyl cysteine and y = 19288 x (r2=0.99) for L-Arginine. The result (Table V) shows that an excellent correlation exists between areas and concentration of drugs within the concentration range. Calibration curves are presented in Figure III.
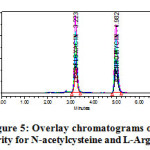 |
Figure5: Overlay chromatograms of Linearity for N-acetylcysteine and L-Arginine |
Limit of detection & Limit of quantification (LOD & LOQ
Limit of quantification and detection were predicted by plotting linearity curve for different nominal concentrations of N-Acetylcysteine and L-Arginine (Table V). Relative standard deviation (σ) method was applied, the LOQ and LOD values were predicted using following formulas. Precision was established at these predicted levels.
(a) LOQ = 10 σ / S
(b) LOD = 3.3 σ / S
Where σ = residual standard deviation of response
S = slope of the calibration curve.
LOQ and LOD values for N-Acetylcysteine and L-Arginine were found to be 9.180, 2.754 and 9.677, 2.903 respectively.
 |
Figure6: Accuracy Chromatograms-50%, 100% and 150% of N-acetylcysteine and L-Arginine Click here to View Figure |
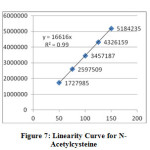 |
Figure7: Linearity Curve for N-Acetylcysteine Click here to View Figure |
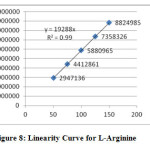 |
Figure8: Linearity Curve for L-Arginine Click here to View Figure |
Table 3: Accuracy for N-Acetylcysteine
|
Spiked Level |
Sample Weight |
Sample Area |
µg/ml added |
µg/ml found |
% Recovery |
Mean |
|
50% |
250.00 |
1724734 |
118.800 |
118.64 |
100 |
100 |
|
50% |
250.00 |
1722164 |
118.800 |
118.46 |
100 |
|
|
50% |
250.00 |
1727440 |
118.800 |
118.83 |
100 |
|
|
50% |
250.00 |
1721876 |
118.800 |
118.44 |
100 |
|
|
50% |
250.00 |
1720592 |
118.800 |
118.36 |
100 |
|
|
50% |
250.00 |
1729189 |
118.800 |
118.95 |
100 |
|
|
100% |
500.00 |
3453345 |
237.600 |
237.55 |
100 |
100 |
|
100% |
500.00 |
3456638 |
237.600 |
237.78 |
100 |
|
|
100% |
500.00 |
3450512 |
237.600 |
237.35 |
100 |
|
|
150% |
750.00 |
5188152 |
356.400 |
356.88 |
100 |
100 |
|
150% |
750.00 |
5184469 |
356.400 |
356.63 |
100 |
|
|
150% |
750.00 |
5183991 |
356.400 |
356.60 |
100 |
|
|
150% |
750.00 |
5184381 |
356.400 |
356.62 |
100 |
|
|
150% |
750.00 |
5176017 |
356.400 |
356.05 |
100 |
|
|
150% |
750.00 |
5179664 |
356.400 |
356.30 |
100 |
Table 4: Accuracy for L-Arginine
|
Spiked level |
Sample weight |
Sample area |
µg/ml added |
µg/ml found |
% recovery |
Mean |
|
50% |
250.00 |
2942271 |
160.000 |
159.52 |
100 |
100 |
|
50% |
250.00 |
2948345 |
160.000 |
159.85 |
100 |
|
|
50% |
250.00 |
2949836 |
160.000 |
159.93 |
100 |
|
|
50% |
250.00 |
2940368 |
160.000 |
159.42 |
100 |
|
|
50% |
250.00 |
2940916 |
160.000 |
159.45 |
100 |
|
|
50% |
250.00 |
2949928 |
160.000 |
159.94 |
100 |
|
|
100% |
500.00 |
5880059.00 |
320.000 |
318.81 |
100 |
100 |
|
100% |
500.00 |
5882977.00 |
320.000 |
318.96 |
100 |
|
|
100% |
500.00 |
5886713.00 |
320.000 |
319.17 |
100 |
|
|
150% |
750.00 |
8820491 |
480.000 |
478.23 |
100 |
100 |
|
150% |
750.00 |
8820071 |
480.000 |
478.21 |
100 |
|
|
150% |
750.00 |
8828925 |
480.000 |
478.69 |
100 |
|
|
150% |
750.00 |
8821166 |
480.000 |
478.27 |
100 |
|
|
150% |
750.00 |
8821638 |
480.000 |
478.29 |
100 |
|
|
150% |
750.00 |
8828376 |
480.000 |
478.66 |
100 |
3.2.7. Robustness
Robustness of the method was determined by making slight changes in the chromatographic conditions and system suitability parameters for Dosulepin hydrochloride Methylcobalamin standard and the resolution, USP Tailing and USP Plate count were recorded. The variables evaluated in the study were column temperature (±50C), flow rate (±0.2 mL/min). It was observed that there were no marked changes in the chromatograms, which demonstrates that the method developed is rugged and robust (Table VI & VII).
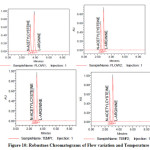 |
Figure10: Robustnes Chromatograms of Flow variation and Temperature |
Table 5: Robustness for N-Acetyl cysteine
|
S.No |
Parameter |
Sample Name |
Rt |
Area |
USP tailing |
USP plate count |
|
1 |
TEMP-1 |
N-Acetylcysteine |
2.689 |
3489330 |
1.369 |
5110 |
|
2 |
TEMP-2 |
N-Acetylcysteine |
2.682 |
3475109 |
1.358 |
5471 |
|
3 |
FLOW-1 |
N-Acetylcysteine |
3.276 |
4187987 |
1.423 |
5525 |
|
4 |
FLOW-2 |
N-Acetylcysteine |
2.468 |
3216985 |
1.342 |
4877 |
Table 6: Robustness for L-Arginine
|
S.No |
Parameter |
Sample Name |
Rt |
Area |
USP tailing |
USP plate count |
|
1 |
TEMP-1 |
L-Arginine |
3.148 |
5948134 |
1.341 |
5575 |
|
2 |
TEMP-2 |
L-Arginine |
3.129 |
5978288 |
1.340 |
6010 |
|
3 |
FLOW-1 |
L-Arginine |
3.834 |
4171168 |
1.420 |
5867 |
|
4 |
FLOW-2 |
L-Arginine |
2.890 |
5541476 |
1.333 |
5181 |
System suitability results were given by Table-1 such as system suitability parameters are retention time, resolution, tailing and plate count were shown uniformity and %RSD was less than 1, so we can say system is suitable for analysis. Method specificity was concluded by Figure-1 and Figure-2 those figures are N-acetylcysteine and L-Arginine Standard chromatogram and formulation. There was no placebo and excipients peaks interfering with standard and analyte peak, so it proves method is selective. The result given in Table-2 says that the method precision is passed for both N-acetylcysteine and L-Arginine. The method accuracy was evaluated by recovery studies. N-acetylcysteine and L-Arginine recovery was found to be 100% as per ICH requirements such as 97%-103% and also percentage RSD was very low. So method is accurate as results shown in Table 3 & 4. Linearity calibration curves were given in Figure: 7 & 8. Linear correlation was found to be Y= 16616 for N-Acetylcysteine and y = 19288 for L-Arginine. Method robustness results were given in Table 5 & 6. Based on above results, the proposed HPLC method was found to be simple, precise, accurate and sensitive for simultaneous estimation of N-acetylcysteine and L-Arginine in pharmaceutical dosage forms.
CONCLUSION
The proposed HPLC method for the simultaneous estimation of N-Methyl cysteine and L-Arginine in pharmaceutical dosage forms was found to be simple, sensitive, precise, accurate, linear, robust and rugged during validation. Further this method is stability indicating and can be used for routine analysis of production samples .Hence, this method can easily and conveniently adopt for routine quality control of N-Methyl cysteine and L-Arginine in pure and its pharmaceutical dosage forms.
ACKNOWLEDGEMENT
Authors are thankful to Department of Pharmaceutical Sciences, Jawaharlal Nehru Technological University, Hyderabad and Rainbow Pharma training lab, Kukatpally, for providing instruments and analytical support.
REFERENCES
- Sweetman, S. C., (ed), Martindale, The Complete Drug Reference, 37th ed., London, The pharmaceutical press, 2011.
- Budavari, S, (ed), The Merck Index, 13th ed. Whitehouse station, NJ: Merck & Co, Inc; 2006.
- Nitin S. Jadhav*, K.G. Lalitha , Validated Rp-Hplc Method Development For The Simultaneous Estimation Of Acetylcysteine And Acebrofylline In Capsule Formulation, Journal of Biomedical and Pharmaceutical Research 3 (3) 2014, 10-16.
- Shaikh Sanaa, Dr. Athawale Rajania*, Dr. Nadkar Sumedhab, Phadtare Pravinb and Dr. Naik Shripadb, Development and Validation of RP-HPLC Method for the Estimation of N-Acetylcysteine in Wet Cough Syrup, Int. J. Drug Dev. & Res., April-June 2012, 4 (2): 284-293
- Y. Vander Heyden1,*, D. Mangelings1, J. Van Brempt1, and H. Spapen2, Development And Validation Of An Hplc Method With Post-Column Derivatisation For Assay Of N-Acetylcysteine In Plasma, ACTA CHROMATOGRAPHICA, NO. 14, 2004
- Draganov G, Ribarova F, Peykov P. L-Tyrosine containing food supplements, health claims. Pharmacia 2009; 56(1):33-37.
- Tomé D, Bos C. Lysine Requirement through the Human Life Cycle. J Nutrition 2007; 137:1642S-45S.
- Garlick PJ. The Role of Leucine in the Regulation of Protein Metabolism. J Nutr 2005; 135:1553S-56S.
- Danka Petrova Obreshkova1, Dobrina Doncheva Tsvetkova*1, Kalin Valentinov Ivanov2, Validation Of Hplc Method For Determination Of L-Arginine In Tonotyl Solution, International Journal of Pharmacy and Pharmaceutical Sciences, Vol 4, Suppl 1, 2012.
- Draganov G, Bozhkova A. Application of food supplements, containing proteins and amino acids in the complex preparation of football players. Medicine and Sport 2009;5 (4):14-17.
- Miura T, Kashiwamura M, Kimura M. A fluorometric method for the specific determination of serum arginine with 2.3 -naphthalenedicarbaldehyde. Analytical Biochemistry, 1984;139(2):432-37.
- ICH (Q2 (R1); Validation of Analytical Procedures: Text and methodology. International Conference on Harmonization, Geneva, (2005).
- ICH, Q6A; Specifications: Test Procedures and Acceptance Criteria for New Drug Substances and New Drug Products: Chemical Substances, Geneva, (1999)
- FDA, Guidance for Industry on Analytical Procedures and methods Validation Chemistry, Manufacturing, and Controls Documentation (draft), Rockville, MD, (2000).
- Snyder, L.R., Kirkland, J.J., Glajch, J.L., Practical HPLC Method Development, 2nd ed., New York, Wiley (1997).
- United States Pharmacopeial convention: United States Pharmacopoeia 36; National Formulary 31, US Pharmacopoea Convention, Rockville, MD, (2013).
- European Pharmacopeia 7.0, European Directorate of Quality Medicines.


![]()


