A novel bio-adsorbent of mint waste for dyes remediation in aqueous environments: study and modeling of isotherms for removal of methylene Blue
Laboratory of Analytical Chemistry and Physical Chemistry of Materials, Faculty of Sciences Ben Msik, Hassan II University, BP 7955 Casablanca-20700, Morocco.
DOI : http://dx.doi.org/10.13005/ojc/300332
Download this article as:
![]()
The objective of this study was to investigate the possibility of using mint waste as a bioadsorbent for the removal of dye (Methylen Blue) from aqueous solutions. Batch adsorption studies were carried out by monitoring the pH, the bio-adsorbent dose and the initial dye concentration. Attempts have also been made to monitor the adsorption process through Langmuir, Freundlich, Dubinin-Radushkevich, and Temkin adsorption isotherm models. These results have demonstrated the immense potential of mint waste as a bioadsorbent for dyes remediation in polluted water and wastewater. Finally followed by the process of adsorption phenomenon was achieved by fourier transform infrared spectrometer (FTIR), the results shows that the adsorption is mechanical trapping.
KEYWORDS:removal of dyes; bio-adsorbent; waste mint; methylene blue; modeling; FTIR
Introduction
Dyeing technology is synonymous to man’s existence and the usage of dye products is unavoidable.[1,2] However, dyeing causes major problems when synthetic dyes are indiscriminately released into the environment producing pollution to man and his environment due to their slow biodegradability. [3] The contamination of water bodies by dyes has created serious environmental problems worldwide. [4]
In the other hand, large amounts of dyeing wastewater containing a certain amount of residual dye and a large number of dyeing auxiliaries are rich in harmful substances, and waters have different colors. [5] The presence of small amount of dyes is highly visible and undesirable. Whence, the necessity for dye-containing water to undergo treatment before disposal into the environment is highly imperative. [6-7]
Conventional waste water treatment methods for removing dyes include physicochemical, chemical and biological methods, such as coagulation and flocculation, ozonation, electrochemical techniques, fungal decolorization and others techniques. [8,9] But these processes are not always effective and economic where the solute concentrations are very low. Besides, most of the dyes undergo very slow biodegradation. Actually, the sorption technique has been proven to be an effective and attractive process for the treatment of dye-containing waste water. [10] In recent years, biosorption has been strongly recommended as an economically viable sustainable technology for the treatment of waste water streams. [11] The importance and usefulness of biosorption in wastewater treatment is well established. [12] Biosorption in environmental engineering is now in the focus and consideration of all nations, owing to its low initial cost, simplicity of design, ease of operation, insensitivity to toxic substances and complete removal of pollutants even from dilute solutions. [13-14]
The equilibrium sorption isotherm is fundamentally important in the design of sorption systems. Equilibrium studies give the capacity of the sorbent and describe the sorption isotherm by constants whose values express the surface properties and affinity of the sorbent. Equilibrium relationships between sorbent and sorbate are described by sorption isotherms, usually the ratio between the quantity sorbed and that remaining in the solution at a fixed temperature at equilibrium. [15-16]
This study is to investigate sorption of methylene blue (MB) from aqueous solution using mint waste biomass. In order to understand the nature of the sorption: at first we conducted an optimization of the parameters of adsorption such as pH effect, mass effect and the effect of initial concentrations of BM, and on the other hand kinetics and equilibrium isotherms have been evaluated. Also, we characterized mint waste biomass samples before and after MB adsorption by FTIR.
Materials and Methods
Materials
The waste mint was collected from the waste cafeteria (University Hassan 2, Casablanca, Morocco). The collected materials were washed several times with boiled water and finally with distilled water to remove any adhering dirt. The washed materials were then dried in the oven at 60 ◦C for 72 h. The dried biomass was then ground and sieved to obtain the particle size in the range 250–500 µm. Finally, the resulting product was stored in air-tight container for further use. No other chemical or physical treatments were applied prior to adsorption experiments.
Chemicals
Stock solution was prepared by dissolving 1.0 g of methyleneblue (MB) supplied by Sigma–Aldrich in 1 L distilled water. The test solutions were prepared by diluting stock solution to the desired concentrations. The maximum wavelength of this dye is 664 nm.
Effects of solution pH, of adsorbent dosage and of initial concentration
The effect of pH on the removal of MB was analyzed over the pH range 2–12. The pH was adjusted using 0.01M NaOH and 0.01M HCl solutions. In this study, 100mL of dye solution with fixed initial concentration of 50 mg/L was taken in a stopperred conical flask and was agitated with 0.1 g of biomass for 2 hours.
The effect of biomass dose on the amount of MB adsorbed was obtained by contacting 100 mL of MB solution of initial concentration of 50 mg/L with different amount of biomass into a number of 250 mL stopperred glass Erlenmeyers flasks at temperature of 25 ◦C and at pH 7.1. Dye solutions were then analyzed thereafter at which equilibrium is assumed (2 hours).
A test of the effect of concentration was obtained by contacting 100 mL volumes of MB at concentrations of 10 – 50 mg/L, with masses of 0.1 g/L of the mint in Erlenmeyers flasks 250 mL at 25 ◦ C and at pH 7.1.
Equilibrium studies and modelling
Equilibrium studies were carried out by contacting fixed amount of biomass (1 g/L) with 100 mL of MB solution of different initial concentrations in 250mL stopper conical flasks at a temperature of 25±2 ◦C and pH of 7.13. The initial and equilibrium concentrations of MB were analyzed using a UV–vis spectrophotometer (Shidmadzu Model UV-1601) at a wavelength of maximum absorbance (664 nm). The amount of adsorption at equilibrium, qe (mg/g), was calculated by
Where C0 and Ce (mg/L) are the liquid phase concentrations of MB at initial and equilibrium, respectively. W (g/L) is the mass of biomass used in the volume of the solution. The percentage removal of dye was calculated as follows

To examine the relationship between absorbed and aqueous concentration at equilibrium, we used the theoretical models (two-parameter sorption isotherm models) that are shown in Table 1, such as: Freundlich [17], Langmuir [18], Dubinin – Radushkevich [19], Temkin [20].
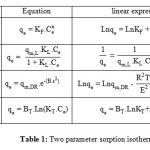 |
Table1: Two parameter sorption isotherm models. |
Characterization
Fourier transform infrared (FTIR) analysis was applied to determine the surface functional groups, using an FTIR spectroscope (Vertex 70), where the spectra were recorded from 4000 to 400 cm−1.
Results and discussion
Effects of solution pH, of adsorbent dosage and of initial concentration
The effect of pH (Figure 1) was realized by initial concentration C0 = 50 mg/L, adsorbent dose m = 1 g/L, and pH = 2.4, 4.7, 7.1, 9.8 and 11.8. The removal percentages are respectively 68.49 ± 7.43%, 89.47 ± 2.75%, 90.32 ± 1.81%, 90.04 ± 3.01% and 89.26 ± 1.63 %. The results of this experiment show that the pH = 7.1 has a high removal percentage, hence the continuation of the all experiments of this work were that pH.
On the other hand, the effect of adsorbent dose (Figure 2) was realized by initial concentration C0 = 50 mg/L, pH = 7.1 and adsorbent dose m = 0.2, 0.4, 0.6, 0.8 and 1 g/L. The removal percentages are respectively 77.71 ± 5.26%, 82.67 ± 4.86%, 87.59 ± 4.94%, 90.30 ± 3.47% and 91.31 ± 3.35 %. The results show that the removal percentage is increased relative to the increase in dose of the adsorbent.
Finally, the effect of initial concentration (Figure 3) was realized by adsorbent dose m = 1 g/L, pH = 7.1 and initial concentration C0 = 10, 20, 30 and 40 mg/L. The removal percentages are respectively 85.37 ± 1.95%, 80.56 ± 0.25%, 74.35 ± 1.20% and 72.13 ± 0.61%. The results show that the removal percentage is increased relative to the decrease in the initial concentration.
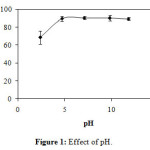 |
Figure1: Effect of pH. Click here to View Figure |
 |
Figure2: Effect of adsorbent dose. Click here to View Figure |
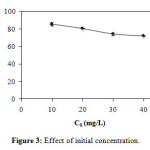 |
Figure3: Effect of initial concentration. Click here to View Figure |
Equilibrium studies and modelling
The isotherms study of sorption of methylene blue was done during a time of two hours, with agitation, temperature T = 25 ° C and pH = 7.1 constants. We tested initial concentrations: 60, 70, 80, 90 and 100 mg/L. Figure 4 illustrates the variation in the adsorption capacity q versus at equilibrium concentration Ce. This curves obtained shows that the physicochemical process of absorption is interpreted difficult thing, and the explanation is unknown. For that, we tested the theoretical models that can give experimental approaches to demonstrate the real mechanism.
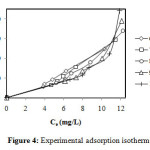 |
Figure4: Experimental adsorption isotherms. Click here to View Figure |
All the parameters of isotherms for sorption the methylene blue by biomass waste mint are determined from the straight linearity (Figure 5, 6, 7 and 8) according to the equations of the models described in Table 1. In considering the reliability of the proposed isotherms models, we calculated the correlation coefficients of the equations and the constants of each model. These are grouped in Table 2.
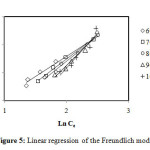 |
Figure5: Linear regression of the Freundlich model. Click here to View Figure |
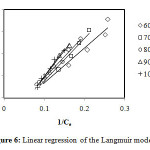 |
Figure6: Linear regression of the Langmuir model. Click here to View Figure |
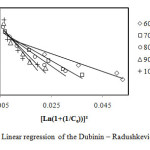 |
Figure7: Linear regression of the Dubinin–Radushkevich model. Click here to View Figure |
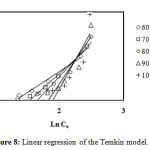 |
Figure8: Linear regression of the Temkin model. Click here to View Figure |
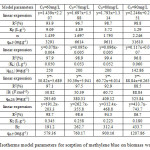 |
Table2: Isotherms model parameters for sorption of methylene blue on biomass waste mint. Click here to View table |
From the values of correlation coefficients R2 of these tables we can conclude that the model of Langmuir is closer to the experimental results of adsorption for initial concentrations: 60, 70 and 80 mg/L, that correlation coefficients are respectively: 97.9%, 98.9% and 99.4%, and the model of Freundlich is closer to the experimental results of adsorption for initial concentrations: 90 and 100 mg/L, that correlation coefficients are respectively: 98.8% and 96.8%. By cons, we note that the theoretical data from other models move away from the experimental data.
FTIR interpretation
The FTIR spectra before and after adsorption biomass methylene blue are shown in Figure 9. In the FTIR spectra of biomass before adsorption shows broad peaks and intense absorption at about 3443 cm-1 correspond to elongation of OH, also, vibrations due to inter and intramolecular hydrogen bonding of polymeric compounds (macromolecular associations), such as alcohols, phenols and carboxylic acids, such as pectin, cellulose and lignin, thus showing the presence of hydroxyl groups “free” on the surface of the adsorbent. The peak at 2921 cm -1 is attributed to CH symmetric and asymmetric vibration aliphatic acid elongation. The peak at 1655 cm-1 is the asymmetric stretching vibration of C = O and the peak observed at 1512 cm-1 be assigned to a group of aromatic compound. Other prominent peaks are the vibrations of NH2, C = O and –C – C – are respectively observed at 1440 cm-1,1066 cm-1 and 875 cm-1. Some distinct changes are observed between the spectra before and after methylene blue adsorption on biomass. In the case of the spectrum obtained after the adsorption of methylene blue, there is a remarkable change of the intensities of infrared bands with no change positions. The changes in the FTIR spectra, the results confirmed that the process involved is type inclusion of methylene blue with functional groups present in the biomass (mechanical entrapment).
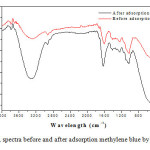 |
Figure9: FTIR spectra before and after adsorption methylene blue by bio-adsorbent. Click here to View Figure |
Conclusion
The results obtained during the sorption of methylene blue on biomass waste mint show that:
- The waste mint can be used as good adsorbent particularly for the removal of methylene blue and generally for all dyes.
- The adsorption isothems could be considered consistent with Langmuir model for initial concentrations: 60, 70 and 80 mg/L, and the Freundlich model for initial concentrations: 90 and 100 mg/L.
All the results obtained in this work, we have discovered new ways of valuing the waste mint, giving new biomass in the field of environmental applications.
References
- Zhu, S. C. ; Miao, C. G. ; Wu, Y. ; Yang, H. X. Advanced Materials Research. 2013, 726, 629-633.
- Bhatnagar, A. ; Kaczala, F. ; Hogland, W. ; Marques, M. ; Paraskeva, C. A.; Papadakis, V. G. ; Sillanpää, M. Environmental Science and Pollution Research. 2014, 21(1), 268-298.
- Adinew, B. Bulg J Sci Educ. 2012, 21, 434-456.
- Carneiro, P. A. ; Umbuzeiro, G. A. ; Oliveira, D. P. ; Zanoni, M. V. B. Journal of Hazardous Materials. 2010, 174(1), 694-699.
- Verma, A. K. ; Dash, R. R. ; Bhunia, P. A. Journal of Environmental Management. 2012, 93(1), 154-168.
- Fernando, E. ; Keshavarz, T. ; Kyazze, G. Bioresource technology. 2013, 127, 1-8.
- Wang, J. L. ; Xu, L. J. Critical Reviews in Environmental Science and Technology. 2012, 42(3), 251-325.
- Dawood, S. ; Sen, T. K. Water research. 2012, 46(6), 1933-1946.
- Salleh, M. A. M. ; Mahmoud, D. K. ; Karim, W. A. ; Idris, A. Desalination. 2011, 280(1), 1-13.
- Fu, F. ; Wang, Q. Journal of Environmental Management. 2011, 92(3), 407-418.
- Ainane, T. ; Abourriche, A. ; Kabbaj, M. ; Elkouali, M. ; Bennamara, A. ; Charrouf, M. ; Talbi, M. Journal of Chemical and Pharmaceutical Research. 2014, 6(4), 599-606.
- Fomina, M. ; Gadd, G. M. Bioresource technology. 2014, 160, 3-14.
- Chowdhury, S. ; Saha, P. D. Applied Water Science. 2012, 2(3), 209-219.
- Wang, S. ; Zhai, Y. Y. ; Gao, Q. ; Luo, W. J. ; Xia, H. ; Zhou, C. G. Journal of Chemical & Engineering Data. 2013, 59(1), 39-51.
- Gupta, V. K. ; Mittal, A. ; Jhare, D. ; Mittal, J. RSC Advances. 2012, 2(22), 8381-8389.
- Ainane, T. ; Abourriche, A. ; Kabbaj, M. ; Elkouali, M. ; Bennamara, A. ; Charrouf, M. ; Talbi, M. Journal of Materials and Environmental Science. 2014, 5 (4), 975-982.
- Zeng, F. ; He, Y. ; Lian, Z. ; Xu, J. Science of The Total Environment. 2014, 466, 577-585.
- Hao, S. ; Chu, W. ; Jiang, Q. ; Yu, X. Colloids and Surfaces A: Physicochemical and Engineering Aspects. 2014, 444, 104-113.
- Sari, A. ; Tuzen, M. Applied Clay Science. 2014, 88, 63-72.
- Song, X. ; Liu, D. ; Zhang, G. ; Frigon, M. ; Meng, X. ; Li, K. Bioresource technology. 2014, 151, 428-431.


![]()


