Thermodynamic Proton – Ligand Satability Constants in Dioxane – Water Media, Pka , Δg0, Δ H0 And Δ S0 , Values for 1, 3 – Disubstituted Barbituric Acid
Department of Chemistry, Sahu Jain (PG) College, Najibabad. – 246763, India
DOI : http://dx.doi.org/10.13005/ojc/300269
Download this article as:
![]()
Thermodynamic protonation constants of dimethyl barbituric acid [DMBA], Diphenyl barbituric acid [DPBA], di-o-tolyl barbitiuric acid[D-O-TBA], di-m-tolyl barbituric acid [D-m-TBA], di-p-tolyl, barbituric acid [D-p-TBA], di-o-xylyl barbituric acid [D-o-XBA], di-m-xylyl barbituric acid [ D-m-XBA], di-p-xylyl barbituric acid [D-p-XBA], di-α napthyl barbituric acid [D-α-NBA] and di-p-anisyl barbituric acid [D-p-ABA] have been determined in different mole fraction of deoxane [ 0.175 – 0.350 ] at 20, 30, and 40 0.100C. The thermodynamic protonation constant [ ] values do not vary linearly with reciprocal of dielectric constant of medium, but a plot of pkTa versus the mole fraction of dioxane is linear at all given temperatures. The mean ionic radii are for barbiturates ions, being in the region of 2.12 – 2.72 A0, slightly increases with dioxane percentages. The values of ΔG0, Δ H0 and Δ S0 have been evaluated. The effect of temperature as well as medium effect are briefly discussed.
KEYWORDS:Thermodynamic; protonation; dimethyl barbituric acid
INTRODUCTION
Barbituric acid are have found immense analytical and medicinal applications1-6. However, such applications necessitate a precise knowledge of their protonation constants. Recently, several analogous compounds have been synthesised by the introduction of substituent groups in different positions for improved analytical characteristics. This empirical approach, although sometimes inescapable , is generally wasteful and it is more fruitful to determine the physicochemical properties of the reagents and their resulting metal complexes, and in particular their protonation constants, which could lead to a better understanding of the cause of specificity and selectivity of relevant medicinal and analytical reactions. With this value, the thermodynamic protonation constant [ ] of 1, 3 di substituted barbituric acids in different mole fraction of dioxane at 20, 30, and 40 0.100C have been determined. The thermodynamic functions, associated with protonation processes have also been evaluated.
EXPERIMENTAL
The substituted barbituric acids were synthesised by the usual procedure reported in the literature7 and recrystallized before use and the purity was checked by analytical analysis, UV and IR spectra. All other chemicals were of Anala R and G.R grades of B.D.H or E. Merck unless otherwise stated. Dioxane was purified using the method of Weissberger et al8 or carbonate free sodium hydroxide was prepared by the electrolytic method of Vogel9.
The protonation constant were determined by the pH-titration method employing a pH-meter cell of type.
Ag, AgCl HCl, glass, KCl, Acids, HClO4– NaClO4 NaOH KCl, Hg2Cl2
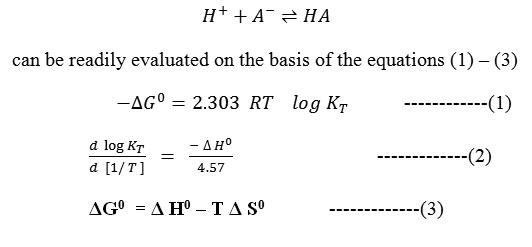
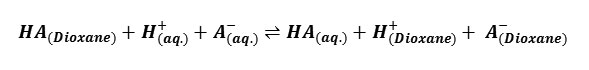
[To maintain I = 0.1 M]The pH values measured with an expanded scale pH- meter were corrected from the calibration curves to obtain the true pH values. From the potentiometric titrations of HClO4 in the absence and presence of barbituric acids, the formation curves in which [the average number of protons bound per free ligand] plotted against pH were constructed in accordance with the procedure of Irving and Rossotti10. By applying Bjerrum’s11 10 half integral method, the protonation constants at three temperatures were determined, the correction for activity coefficient were applied on the basis of Davies equation12 and the thermodynamic protonation constants were evaluated. The change in free energy ΔG0, enthalpy Δ H0 and entropy Δ S0 associated with the protonation equilibrium, i.e
Formula 1 to3
RESULT AND DISCUSSION
The thermodynamic protonation constant [PKTa ] at temperatures -20, 30 and 400C are given in table-1. The average [PKTa ] generally falls within
Table – 1 PKTa values of 1, 3 – di substituted Barbituric acids at different Temperatures
|
Acids |
Mole fraction of dioxane ( |
|||||||||||
|
0a |
0.175 |
0.250 |
0.350 |
|||||||||
|
200C |
300C |
400C |
200C |
300C |
400C |
200C |
300C |
400C |
200C |
300C |
400C |
|
|
DMBA |
3.85 |
3.74 |
3.65 |
4.18 |
4.00 |
3.92 |
4.25 |
4.12 |
4.02 |
4.33 |
4.21 |
4.10 |
|
DPBA |
4.07 |
3.98 |
3.92 |
4.35 |
4.22 |
4.09 |
4.44 |
4.35 |
4.24 |
4.60 |
4.48 |
4.39 |
|
D-p-TBA |
4.29 |
4.18 |
4.08 |
4.54 |
4.45 |
4.35 |
4.70 |
4.58 |
4.46 |
4.85 |
4.74 |
4.63 |
|
D-m-TBA |
3.98 |
3.88 |
3.79 |
4.23 |
4.14 |
4.03 |
4.34 |
4.23 |
4.10 |
4.48 |
4.36 |
4.24 |
|
D-o-TBA |
3.57 |
3.48 |
3.40 |
3.82 |
3.69 |
3.58 |
3.86 |
3.77 |
3.66 |
3.96 |
3.88 |
3.78 |
|
D-o-XBA |
3.66 |
3.57 |
3.46 |
3.85 |
3.76 |
3.64 |
3.96 |
3.84 |
3.71 |
4.04 |
3.95 |
3.85 |
|
D-m-XBA |
4.38 |
4.28 |
4.19 |
4.68 |
4.57 |
4.45 |
4.79 |
4.68 |
4.56 |
4.97 |
4.85 |
4.74 |
|
D-p-XBA |
3.94 |
3.83 |
3.72 |
4.16 |
4.05 |
3.92 |
4.27 |
4.15 |
4.03 |
4.39 |
4.27 |
4.15 |
|
D-p-ABA |
4.12 |
4.00 |
3.89 |
4.46 |
4.35 |
4.25 |
4.57 |
4.45 |
4.32 |
4.70 |
4.58 |
4.45 |
|
D-α-NBA |
4.33 |
4.22 |
4.13 |
4.58 |
4.48 |
4.37 |
4.74 |
4.62 |
4.52 |
4.80 |
4.68 |
4.57 |
oa →Extrapolated values at 0 % dioxane.
a spread of ±0.02 but not beyond ±0.03 in any case. The empirical data for the mole fraction of dioxane (n2) and ΔG0, Δ H0 and Δ S0 values are given in the table 2 and 3 respectively. The PKTa values increase in dioxane content because of the decrease in the dielectric constant of bulk solvent. As the dielectric constant decreases, the ion interaction involving the proton and anionic oxygen on the ligand decrease to a greater extent than the ion dipole interaction between the proton and the solvent molecule. A plot of PKTa against mole fraction of dioxane [ Fig.1] shows a linear relationship of the form. PKTa = mn2 + c.
Table – 2 Empirical correlation PKTa of with mole fraction of dioxane (n2)
|
Acids |
Temp. (0C) |
PKTa = m + c |
||||
|
Last square method |
graphically |
|||||
|
m |
c |
r |
m |
c |
||
|
DPBA |
20 |
5.66 |
3.96 |
1.00 |
5.63 |
3.98 |
|
30 |
5.64 |
3.88 |
0.99 |
5.61 |
3.90 |
|
|
40 |
5.63 |
3.80 |
1.00 |
5.62 |
3.82 |
|
|
DMBA |
20 |
5.56 |
3.81 |
1.00 |
5.54 |
3.82 |
|
30 |
5.53 |
3.72 |
1.00 |
5.52 |
3.74 |
|
|
40 |
5.52 |
3.64 |
1.00 |
5.50 |
3.65 |
|
|
D-p-TBA |
20 |
5.69 |
4.20 |
1.00 |
5.68 |
4.18 |
|
30 |
5.68 |
4.11 |
1.00 |
5.67 |
4.10 |
|
|
40 |
5.66 |
4.05 |
1.00 |
5.65 |
402 |
|
|
D-m-TBA
|
20 |
5.09 |
3.65 |
1.00 |
5.08 |
3.68 |
|
30 |
5.09 |
3.60 |
0.99 |
5.08 |
3.63 |
|
|
40 |
5.08 |
3.52 |
1.00 |
5.05 |
3.57 |
|
|
D-o-TBA
|
20 |
5.03 |
3.44 |
0.99 |
5.02 |
3.45 |
|
30 |
5.03 |
3.39 |
1.00 |
5.02 |
3.40 |
|
|
40 |
5.02 |
3.33 |
1.00 |
5.00 |
3.34 |
|
|
D-o-XBA |
20 |
5.78 |
3.60 |
1.00 |
5.76 |
3.59 |
|
30 |
5.75 |
3.53 |
1.00 |
5.74 |
3.52 |
|
|
40 |
5.73 |
3.48 |
0.99 |
5.72 |
3.46 |
|
|
D-m-XBA
|
20 |
5.14 |
4.00 |
0.99 |
5.12 |
4.02 |
|
30 |
5.14 |
3.94 |
1.00 |
5.12 |
3.96 |
|
|
40 |
5.12 |
3.88 |
1.00 |
5.10 |
3.90 |
|
|
D-p-XBA
|
20 |
5.25 |
3.65 |
1.00 |
5.23 |
3.62 |
|
30 |
5.25 |
3.55 |
1.00 |
5.23 |
3.54 |
|
|
40 |
5.24 |
3.50 |
0.99 |
5.22 |
3.48 |
|
|
D-α-NBA |
20 |
5.36 |
3.57 |
1.00 |
5.35 |
3.56 |
|
30 |
5.37 |
3.52 |
1.00 |
5.35 |
3.50 |
|
|
40 |
5.36 |
3.46 |
0.99 |
5.34 |
3.44 |
|
|
D-p-ABA |
20 |
5.44 |
3.50 |
0.99 |
5.42 |
3.48 |
|
30 |
5.43 |
3.43 |
1.00 |
5.42 |
3.42 |
|
|
40 |
5.43 |
3.37 |
1.00 |
5.40 |
3.35 |
|
Gurney13 and others 14, 15 have shown that the standard free energy change associated with the proton transfer, ΔG0diss, may be split into two distinct parts: electrostatic [el.] and none electrostatics [nonel].
Formula 4
![]()
The electrostatic contribution to the free energy change is often estimated using Born equation16.
Formula 5
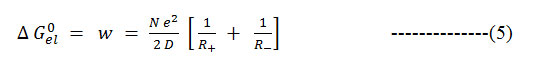
Where R+ and R – are radii of solvated ions and D is the dielectric constant of the medium17, 18. Hence
Formula 6
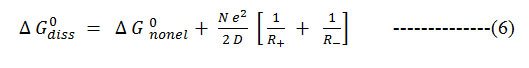
Further, as ΔGdiss = 2.303 RT PKTa15 , the equation simplifies as
Formula 7
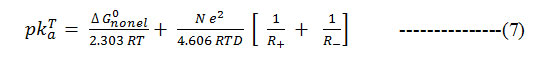
against 1/D assuming ΔG0nonel. to be independent of the solvent. When the PKTa values of substituted barbituric acids are plotted against 1/D it is observed that the plots possess a distinct curvature. It seems evident that non-electrostatic factors exert a considerable influence on the deprotonation of barbituric acids.
For barbituric acids, the change in PKTa with mole fraction of dioxane (η2) is of considerable magnitude. Generally, the difference in PKTa in aqueous medium ( η2= 0) and aqueous dioxane medium ( η2= 0.350) is of the order of 1.45 – 1.95 PKTa units. When PKTa values of these barbituric acids are plotted against n2, the straight line relationship are encountered [Fig 1]. The experimental values of PKTa here indicate a maximum deviation from linearly of the order of 0.05 or about 0.5% in PKTa .
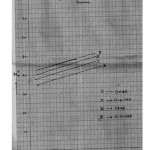 |
Figure 1 Click here to View Figure |
The goodness of fit in these instances was judged by calculating the correlation coefficient, , defined by 
Formula 8
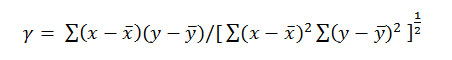
Where and are mean values of x (PKTa) and y (η2), respectively. The summations are extended to all pairs (x, y) a variable. Linear proportionality is readily indicated between the variables when the value of is γ +1.0.
Since the value of γ is approximately +1.0 at 20, 30 and 400C for all the substituted barbituric acids. [ Table-2], it implies that there is quite a high probability of a linear relationship between (PKTa) and η2. A similar behaviour is found for several other acids such as benzoic, acetic propionic and formic acids19. 18 in aqueous dioxane medium. Likewise, linear proportionality is also obtained for some other mixed water solvents, e.g: acetic, propionic, butyric and benzoic acids in methanol-water mixtures20.
The PKTa values have been determined with a precision of ±0.02 to ±0.03 and hence the error in ΔG0 is believed to be close to ±0.03 and ±0.04 Kcal/mole. The values of Δ S0 given in table -3 are accurate to ±0.02 cal.mole – 1 K – 1 .
Table – 3 ΔG0 Δ H0 and Δ S0 values for 1,3 – di substituted barbituric acids at 300C
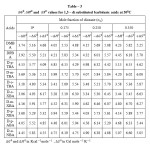 |
Table 3: ΔG0 Δ H0 and Δ S0 values for 1,3 – di substituted barbituric acids at 300C |
The negative value of Δ H0 found in aqueous as well as dioxane mixtures for all barbituric acids proves that their protonation at temperatures up to 400c is exothermic. The negative values of Δ H0 encountered here may be described to the formation of the covalent bond between proton and anionic oxygen on the barbituric acids. Further, It is evident that the magnitude of Change in, Δ H0 with solvent composition is relatively small and falls with in the range of experimental error. it is because of this that the slopes of straight lines in the plots of PKTa against n2 (Fig – 1 ) do not differ markedly and are nearly the same and parallel at the three temperatures for all the barbituric acids.
The values of Δ S0 are found to increase with increase in dioxane content of the solvent medium for all barbituric acids, there by proving that it is dependent of solvent composition. The net entropy changes associated with protonation process can be attributed to a combination of the following
(i). Change neutralisation; (ii) Subsequent liberation of ordered water molecules; and (iii) loss of rotational and vibrational degrees of freedom of the legend only (iii) gives a small negative contribution to entropy, but the contributions of (i) and (ii) together more than offset that due to (iii) and hence the protonation process has large positive Δ S0 values. The protonation of these acids then appears to be entropy driven as expected from the degree of change neutralisation and polarizability of the resulting anions.
When the acid protonates in two media, the free energy change for the transfer reaction from one medium to the other is given by 2.303 RT PKTa . For instance with DPBA, Δ G0(aq.) and Δ G0( = 0.175) are 5.50 and 5.83 Kcal mole – 1, respectively at 300 and Δ G0 changes by 0.33 Kcal mole – 1 in the transfer reaction.
Formula 9
and this result in a change of 0.20 Cal mole – 1 in entropy. PKTa Δ (S – W) values, ie PKTa ; (S) – PKTa (W) (where S and W refer to mixed solvents and water respectively) of barbituric acids are given in table 4. The change in PKTa (S – W) which is found to be different for the different acids for the same percentage of dioxane is probably due to the presence of different substituents which cause a great change in the distribution of electron density in the ring and hence the electron density at any particular point is also affected.
Table – 4 PKTa Δ (S – W) = (S) – PKTa (W)
|
Acids |
Mole fraction of dioxane ( |
|||||||||
|
0.1750C |
0.250 |
0.350 |
||||||||
|
200C |
300C |
400C |
200C |
300C |
400C |
200C |
300C |
400C |
||
|
DMBA |
0.33 |
0.26 |
0.27 |
0.40 |
0.38 |
0.37 |
0.48 |
0.47 |
0.45 |
|
|
DPBA |
0.28 |
0.24 |
0.17 |
0.37 |
0.37 |
0.32 |
0.53 |
0.50 |
0.47 |
|
|
D-p-TBA |
0.25 |
0.27 |
0.27 |
0.41 |
0.40 |
0.38 |
0.56 |
0.56 |
0.55 |
|
|
D-m-TBA |
0.25 |
0.26 |
0.24 |
0.36 |
0.35 |
0.31 |
0.50 |
0.48 |
0.45 |
|
|
D-o-TBA |
0.26 |
0.21 |
0.18 |
0.29 |
0.29 |
0.26 |
0.39 |
0.40 |
0.38 |
|
|
D-o-XBA |
0.19 |
0.20 |
0.19 |
0.30 |
0.27 |
0.25 |
0.38 |
0.38 |
0.39 |
|
|
D-m-XBA |
0.30 |
0.29 |
0.26 |
0.41 |
0.40 |
0.37 |
0.59 |
0.57 |
0.55 |
|
|
D-p-XBA |
0.22 |
0.23 |
0.20 |
0.33 |
0.32 |
0.31 |
0.45 |
0.44 |
0.43 |
|
|
D-p-ABA |
0.35 |
0.34 |
0.36 |
0.45 |
0.44 |
0.43 |
0.58 |
0.58 |
0.56 |
|
|
D-α-NBA |
0.25 |
0.26 |
0.24 |
0.41 |
0.40 |
0.39 |
0.47 |
0.46 |
0.54 |
|
ACKNOWLEDGEMENTS
Thanks are due to the department of chemistry, Sahu Jain (PG) college, Najibabad for providing the necessary facilities and also to the I.I.T. Roorkee for providing library facilities.
REFERENCES
- N. Haque, J. N. Roedel, I. P. Lorenz, Z. Anorg. Allg. Chem. 2009, 635,496 – 502.
- N. Haque, B. Neumann, I. P. Lorenz, Z. Naturforsch. 2010, 65 b, 101 – 106.
- N. Haque, B. Neumann, P. Mayer, I. P. Lorenz, J. Organomet. Chem. 2010 manuscript in preparation.
- M. Meusel, A. Ambrozak, T. K. Heckes, M. Gutschow, J. Org.Chem. 68, 4684 (2003).
- H. Brunner, K. P. Ittner, D. Lunz, S. Schmatlock, T. Schmidt, M. Zabel, Eur. J. Org. Chem. 855, (2003).
- E. Chansah, D. S. Weiss, Neuropharmacology 40, 327, (2001).
- M. Ridi, P. Viturini and L. Zipatti, Ann. chiqn. , 42, 25(1952).
- A Waissberger, E. S. Proskauer, J. A. Riddick and E. E. Troopes. Jr, Techniques of organic Chemistry, vol. VII, Interscience, New York, P. 126.
- A. I. Vogel, A textbook of quantitative Inorganic Analysis, Longmans, 3rd edn., 1961. P;239.
- H. M. Irving and H. S. Rossotti, J. Chem. soc., 2904(1954).
- J. Bjerrum, Metal-Amine formation in aqueous solution, P. Hasse and sons, Copenhagen, 1941.
- C. W. Davies, Ion association, Butter Worths, London, 1962, chap;3.
- R. W. Gurney, J. Chem phys. 6, 499(1938).
- H. L. Kapoor and Y. K. Agrawal, J. Chem. Eng. Data, 22, 159, (1977).
- S. G. Tandon and Y. K .Agarwal, Talanta. 19, 700, (1972).
- M. G. Born, Z. Phys., 1, 45, (1920).
- M. Mandel, Bull. Soc.. Chem. Belg, 64,44,(1955).
- M. Mandel and A. Jenard, Bull. Soc. Chem. Belg., 64, 575(1958).
- H. S. Harned and B. B. Owen, The Physical Chemistry of Electrolytic Solutions, Reinbold, New York, 3rd edn., 756(1958).
- R. H. Stoks and R.S. Robinson, Electrolytic Solutions, Buller-works, London 541(1955).


![]()


