Synthesis of Bio-Ethanol from Corn Stalk by Fermentation Process
Y. C. Wong1* and A. M. Fikri1
1Faculty of Agro Based Industry, Universiti Malaysia Kelantan, Jeli Campus, Locked Bag 100, 17600 Jeli, Kelantan, Malaysia
DOI : http://dx.doi.org/10.13005/ojc/300232
Article Received on :
Article Accepted on :
Article Published : 05 Jun 2014
Ethanol synthesis from corn stalk through fermentation process was studied. The ethanol produced was studied by various enzymatic treatment temperature and different feedstock loading in term of weight. The result shows that the highest concentration of ethanol contained in the sample was 48.90% at enzymatic temperature of 50°C. The temperature for optimum enzyme treatment have been identified as 50°C followed by 30, 40 and 60°C respectively.
KEYWORDS:ethanol; bio-ethanol; enzyme treatment; enzymatic temperature
Download this article as:| Copy the following to cite this article: Wong Y. C, Fikri A. M. Synthesis of Bio-Ethanol from Corn Stalk by Fermentation Process. Orient J Chem 2014;30(2). |
| Copy the following to cite this URL: Wong Y. C, Fikri A. M. Synthesis of Bio-Ethanol from Corn Stalk by Fermentation Process. Orient J Chem 2014;30(2). Available from: |
Introduction
Generally, bioethanol converted from edible sources is called first generation bioethanol (FGB). However, the drawback of FGB is that it stems from edible feed stock utilized, which include corn and sugarcane [1]. The technology development focuses on the production of ethanol has shifted towards the utilization of residual lignocellulosic materials to lower production costs [2].
The study will be focussing on the use of commercial enzyme and fermentation through yeast to produce ethanol derived from these corn stalk. The process include the degradation of lignocellulose materials through the enzymatic hydrolysis, enzymatic saccharification have been identified to be more effective for sugar production compared to chemical methods such as acid hydrolysis [3]. The enzyme then converting the sugar released into ethanol through the metabolism of Saccharomyces cerevisiae.
Corn stalk have high content of easily hydrolysable polysaccharides called pentosic. Compositions of the corn stalk are also obtained from the analysis, where it consists of 19.35% lignin, 40.28% Cellulose, 35.06% Pentosans[3]. The use of corn stalk as sources for ethanol can contribute in low cost production of ethanol.
There is certainly industry addressing the cellulosic ethanol sector by making the process cheaper and more competitive with ethanol produced from sugar and starch sources [4].
Objectives for this study are to analyse the composition of ethanol produced from the process using High Performance Liquid Chromatography (HPLC) and to study the production of bioethanol from corn stalks through enzymatic hydrolysis.
Materials and Method
Preparation of Corn Stalks
In this experiment, the corn stalk were obtained from Pasir Mas, Kelantan. The corn stalk obtained are from matured stalk that have been harvested for the corn. After obtaining the corn stalk, the leaves were removed and then dried at the temperature of 60-70°C until constant weight was achieved. The dried corn stalk then were chopped manually into small pieces of 10-30 mm. Finally the corn stalk were grinded into smaller pieces of 0.2-2 mm ready for the enzyme treatment.
Enzyme Treatment
The grinded corn stalk were slurried with acetate buffer (0.05M, pH 4.8) at 5% (w/v) substrate loading then were autoclaved at 121°C for 15 minutes[5]. After autoclaved, the sample was cooled to 50°C, 2% Tween 20 (v/v) was then loaded into the sample as surfactant. The sample mixture were treated with 0.3% (v/v) Viscozyme® L Cellulolytic Enzyme Mixture V2010 from Sigma Aldrich and was incubated on an orbital shaker 150rpm at different temperatures of 30°, 40°, 50° and 60° C for 48 hours. For each temperature, the sample have 10, 20 and 30 gram of corn stalk loading.
Microorganisms and batch fermentation
Commercial baker’s yeast, Mauripan were used as the source of Saccharomyces cerevisiae. The dry yeast were inoculated into the medium consists of: glucose 50g/L, peptone 5g/L, MgSO4. 7H2O 1g/L, K2HPO4 and 5g/L of Yeast. The medium was autoclaved at 121 ⁰C for 15 minutes. After autoclaved, the yeast was inoculated on the orbital shaker for a period of 18 hours at 30°C, 50rpm.
The media containing yeast then was added at the volume ratio of 1:10 of the fermentation broth aseptically. The fermentation of all samples were conducted at 30.5 ⁰C at 150rpm for a period of 48 hours using an orbital shaker [6].
Distillation of samples
The sample from the fermentation process was first filtered using muslin cloth, separating the solid form raw materials from the liquid. The filtrate were then underwent further separation using rotary vacuum evaporator. Evaporation was done at 78°C under vacuum condition with 100 rotation per minute.
High Performance Liquid Chromatography (HPLC) Analysis
1.5 ml of samples after rotary evaporator were loaded into the HPLC vial as sample preparation. 20µl was injected into the HPLC system to analyse the presence of ethanol in the sample. The HPLC analysis parameter were determined using the following conditions: column, C18 RP Hyper Sil; 20µl of sample was injected into the HPLC system. The mobile phase was 0.1M pH 2.5 Phosphoric Acid and the flow rate was 1.5ml/min and the detection was set at a wavelength of 254nm. [7]
Result and Discussion
High Performance Liquid Chromatorgraphy (HPLC) Analysis
Table 1 shows the retention time and the peak area for ethanol that was done using absolute ethanol at concentration of 25, 50, 75 and 100% concentration to the mobile phase. This different concentration were used to create a calibration linear equation to calculate the ethanol concentration on all the samples. Figure 1 shows the linear graph plot of the ethanol calibration used to produce the linear equation with the value of
Table 1: Absolute ethanol reading on the HPLC
| Ethanol Concentration (%) | Retention time (min) | Peak Area | Area (%) |
| 100 | 2.856 | 31,497 | 89.328 |
| 75 | 2.886 | 28,520 | 91.681 |
| 50 | 2.940 | 15,330 | 3.528 |
| 25 | 3.145 | 5229 | 1.685 |
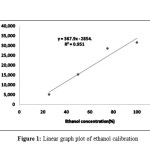 |
Figure 1: Linear graph plot of ethanol calibration Click here to View Figure |
R2=0.9516. The linear equation produced from the graph
Y = 367.98×2854.5—————————–Equation 1
Table 2 shows the mean for retention time and peak area for samples done at temperature of 50°C. The peak area were grouped into different weight of corn stalk loading, the highest mean peak area obtained from the HPLC analysis are 15142.5 for corn stalk loading of 30 gram. Then followed by 20 gram at 9629 and lastly 10 gram peak area of 2437. The peak area produced then were plotted into Figure 2 and the value of R2=0.9942 shows close correlation between the peak area and the corn stalk weight.
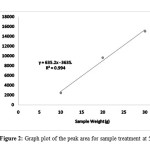 |
Figure 2: Graph plot of the peak area for sample treatment at 50°C Click here to View Figure |
Ethanol concentration were then calculated by substituting the peak area obtained from the HPLC analysis into y of the equation 1. The ethanol concentration produced then were plotted into linear graph (Figure 3). Ethanol concentration produce shows increasing trend with the increase of corn stalk weight. The highest concentration were 48.90% for corn stalk loading of 30 gram followed by 33.92% at 20 gram and 14.38% for 10 gram of corn stalk loading.
Table 2: Mean retention time and peak area for sample done at temperature of 50°C
| Sample at different weight (g) | Mean retention time (min) | Mean peak area | Mean peak height |
| 10 | 3.573 | 2437 | 420 |
| 20 | 3.478 | 9629 | 1430 |
| 30 | 3.118 | 15142.5 | 1571.5 |
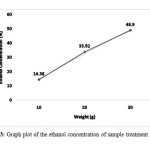 |
Figure 3: Graph plot of the ethanol concentration of sample treatment at 50°C Click here to View Figure |
Table 3 shows the mean peak area for enzyme treatment at 30°C with the highest area were 8304.5 for corn stalk weight 30 gram and the lowest was 10 gram corn stalk loading with peak area of 3340.5. Figure 4 shows the interaction between the peak area of 10, 20 and 30 gram of corn stalk, the straight line produce value of R2=0.9996 meaning that the all the points correlate between each other.
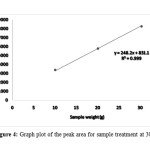 |
Figure 4: Graph plot of the peak area for sample treatment at 30°C Click here to View Figure |
Peak area value were then used to calculate the ethanol concentration of ethanol presence in the sample, Figure 5 shows the straight line produced from the ethanol concentration of sample at different weight. The ethanol increased with the increase of corn stalk weight, the highest ethanol concentration for 30°C enzyme treatment is 30.33% and the lowest is 16.83% ethanol presence on the sample.
Table 3: Mean retention time and peak area for sample done at temperature of 30°C
| Sample at different weight (g) | Mean retention time (min) | Mean peak area | Mean peak height |
| 10 | 3.568 | 3340.5 | 477.5 |
| 20 | 3.523 | 5740.5 | 803.5 |
| 30 | 3.531 | 8304.5 | 1073 |
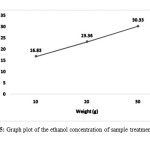 |
Figure 5: Graph plot of the ethanol concentration of sample treatment at 30°C Click here to View Figure |
Comparing the ethanol concentration between enzyme treatment at 30 and at 50°C, treatment at 50°C produce the highest ethanol concentration than treatment at 30°C, the highest concentration of 48.90% rather than 30.33% shows large difference between these two concentration. For 20 gram of corn stalk 50°C enzyme treatment also produce higher ethanol concentration at 33.92% rather than 23.36% at 30°C.
Treatment of 40°C during enzyme treatment produce a deviation in the ethanol concentration. Table 4 shows the peak area reading of the sample enzyme treatment at temperature 40°C, Figure 6 shows the linear graph of the ethanol concentration produced, the concentration produce a negative gradient declination from 22.77% of 10 gram of corn stalk to 12.57% (20gram) and no ethanol produced for 30 gram, this due to the oxidization of ethanol to acetic acid result from contamination from microorganisms probably Acetobacter sp. Have been seeing in converting these ethanol into acetic acid in most biological process.
Table 4: Mean retention time and peak area for sample done at temperature of 40°C
| Sample at different weight (g) | Retention time (min) | Peak Area | Peak Height |
| 10 | 2.215 | 5525 | 1109 |
| 20 | 2.147 | 1772 | 311 |
| 30 | N/A | N/A | N/A |
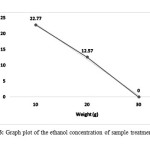 |
Figure 6: Graph plot of the ethanol concentration of sample treatment at 40°C Click here to View Figure |
Finally, enzyme treatment at 60°C did not yield any ethanol for any of the corn stalk loading. This is due to the fact that the temperature exceed the optimum temperature of the enzyme used to convert the lignocellulose materials. Thus did not show any peak during the HPLC analysis due to the fermentation process unable to convert any fermentable sugar on the samples.
Conclusion
From the results produced, it can be concluded that the production of ethanol from corn stalk through enzymatic hydrolysis have been successful. However, the quantity of the production is still small with only the highest concentration is 48.90%. Temperature of the enzyme hydrolysis have been determined to effect on the production of ethanol with 50°C have been the optimum temperature in producing higher ethanol yield for corn stalk. Further research need to be done to determine the optimum condition in producing ethanol and thus producing higher concentration of ethanol for corn stalk as feedstock materials.
Acknowledgment
The author wishes to acknowledge the Faculty of Agro Based Industry on all the support in term of financial also providing all infrastructure and facilities from the beginning until the end of the study being done. Not to be forgotten all assistance from the university and laboratory staff that enable the study to be done smoothly.
References
- Goh, C. S., Kok Tat Tan, KeatTeong Lee, Subhash Bhatia., (2010) Bio-ethanol from lignocellulose: status, perspective and challenges in Malaysia. Bioresource Technology.
- Howard, R.L., Abotsi, E. Jansen van Rensburge, E. L. and Howard, S., (2003) Lignocellulose biotechnology: Issues of bioconversion and enzyme production. African Journal of Biotechnology, Vol. 2 (12).
- Hassan, O., T. P. Ling, M. Y. Maskat, R. M. Illias, K. Badri, J. Jahim, N. M. Mahadi,. (2013) Optimization of pretreatments for the hydrolysis of oil palm empty fruit bunch fiber (EFBF) using enzyme mixtures. Biomass and Bioenergy, 56, 137-146.
- Valechev, I., S. Nenkova, P. Tsekova, V. Lasheva., (2009) Use of enzymes in hydrolysis of maize stalks. Bioresource, 4(1), 285-291.
- Maniatis, K., D. Chiaramonti. P. Thornley., (2012) Framework and prepestives of industrial lignocellulosic ethanol development: Introduction to the 1st International Conference on Lignocellulosic Ethanol. Biomass & Bioenergy, 46, 1-4.
- Karagoz, P., I. V. Rocha, M. Ozkan, I. Angelidaki., (2012) Alkaline peroxide pretreatmentof rapeseed straw for enhancing bioethanol production by Same Vessel Saccharification and Co-Fermentation. Bioresource Technology, 104, 349-357
- Cao, W., Sun, C., Liu, R., Yin, R., Wu, X., (2012) Comparison of the effects of five pre-treatment methods on enhancing the enzymatic digestibility and ethanol production from sweet soghum bagasse. Bioresource Technology, 111, 215-221.
- McFeeters, R. F., R. L. Thompson, H. P. Fleming., (1984) Liquid chromatography analysis of sugars, acids and ethanol in lactic acid vegetable fermentation. Journal of the Association of Official Analytical Chemists, 67, 4.

This work is licensed under a Creative Commons Attribution 4.0 International License.
![]()
A New Edition of Web of Science
Journal Impact Factor
2022: 0.5
Five Year: 0.8
Journal is Indexed in

Cabells Whitelist
![]()


