Synthesis, characterization, theoretical treatmentand antitubercular activity evaluation of (E)-N’-(2,5-dimethoxylbenzylidene) nicotinohydrazide and some of its transition metal complexes against Mycobacterium tuberculosis, H37Rv
Ogunniran Kehinde1,*, Adekoya Joseph1, Siyanbola Tolutope1, Aladesuyi Olanrewaju1, Ajanaku Christiana1, Akinlolu Kayode1, Mehdi Shihab Salih2 and Narender Tadigoppula3
1Department of Chemistry, College of Science and Technology, Covenant University, Ota, Ogun State., Nigeria. 2Department of Chemistry, College of Science,Al_Nahrain University, Baghdad, Iraq. 3Medicinal and Process Chemistry Division, CSIR-Central Drug Research Institute, Lucknow, India. Corresponding Author Email: kehinde.ogunniran@covenantuniversity.edu.ng
DOI : http://dx.doi.org/10.13005/ojc/320147
Article Received on :
Article Accepted on :
Article Published : 05 Mar 2016
(E)-N’-(2,5-dimethoxylbenzylidene) nicotinohydrazide) (HL) was synthesized by condensing nicotinic acid hydrazide and 2,5-dimethoxylbenzaldehyde with ONO coordination pattern. The structure of the hydrazone was elucidated by using CHN analyzer, ESI mass spectrometry, IR, 1H NMR, 13C NMR and 2D NMR (COSY and HSQC). The hydrazone was used to synthesized five metal complexes [Mo(V), VO(II), Mn(II) Ni(II) and Cu(II)] which werecharacterized by several physicochemical methods, namely elemental analysis, electronic spectra, infrared, EPR, molar conductivity and magnetic susceptibility measurements. An octahedral geometry was suggested for Mo(V), Ni(II) and Cu(II) complexes while tetrahedral was proposed for Mn(II) complex. VO(II) complex conformed with tetrahedral pyramidal. Structural geometries of these compounds were also suggested in gas phase by using Hyper Chem-8 program for the molecular mechanics and semi-empirical calculations. The energy (E) and eV for homo and lumo state for the prepared compounds were calculated by using PM3 method. In vitroantimycobacterial activity study of the compounds was evaluated against Mycobacterium tuberculosis, H37Rv, by using micro-diluted method. Some of the metal complexes displayed higher activity than the ligand (HL) and isoniazid (INH).Also some of the complexes showed moderate activity when compared to isoniazid. Generally, the results obtained revealed that the compounds exhibited promising antitubercular activity. However, the metal complexes were found to be more toxic than isoniazid drug.
KEYWORDS:Hydrazones; metal complexes; electron spin resonance; thermogravimetric; powder X-ray diffraction; antitubercular agents
Download this article as:| Copy the following to cite this article: Kehinde O, Joseph A, Tolutope S, Olanrewaju A, Christiana A, Kayode A, Salih M. S, Tadigoppula N. Synthesis, characterization, theoretical treatmentand antitubercular activity evaluation of (E)-N’-(2,5-dimethoxylbenzylidene) nicotinohydrazide and some of its transition metal complexes against Mycobacterium tuberculosis, H37Rv. Orient J Chem 2016;32(1). |
| Copy the following to cite this URL: Kehinde O, Joseph A, Tolutope S, Olanrewaju A, Christiana A, Kayode A, Salih M. S, Tadigoppula N. Synthesis, characterization, theoretical treatmentand antitubercular activity evaluation of (E)-N’-(2,5-dimethoxylbenzylidene) nicotinohydrazide and some of its transition metal complexes against Mycobacterium tuberculosis, H37Rv. Orient J Chem 2016;32(1). Available from: http://www.orientjchem.org/?p=14709 |
Introduction
TB is one of the oldest infectious diseases affecting mankind.It is the leading cause of death due to a single infectious agent among human adults in the world1. Mycobacterium tuberculosis, the causative agent of tuberculosis (TB), is one of the world’s most devastating human pathogens, infecting one-third of the global population and claiming two million lives every year2. Tuberculosis is an airborne disease, since the infectious bacilli are inhaled as droplets from the atmosphere.The Mycobacterium tuberculosis complex includes strains of five species- M. tuberculosis, M. canettii, M. africanum, M. microti, and M. bovis and two sub species M. caprae and M. pinnipedii3-5. Mycobacterial infections have been shown to be increasing in number worldwide, mainly due to a global increase in developing countries, the increased number of patients with HIV infection and AIDS disease worldwide, an increasing number of elderly patients and the emergence of multidrug resistant tuberculosis.Tuberculosis may arise in two different ways: either from a recent infection with M. tuberculosis; or from the reactivation of dormant tubercle bacilli years or decades after initial infection resulting intuberculosis disease. Currently, more than one-third of the world’s population is infected with Mycobacterium tuberculosis. According to the report released by WHO, in 2010, there were 9.4 million incident cases, 14 million prevalent cases and 1.3 million deaths among HIV-negative people. TB is the leading cause of death in HIV-infected individuals 3-7. The alarming estimates exposes that 0.22 billion people may acquire TB while 79 million people could die due to TB by the year 2030. Effective TB treatment is difficult, TB can be cured in most cases by course of antibiotic treatment such as isoniazid, rifampicin, pyrazinamide, and ethambutol but the difficulty of a timely diagnosis, socioeconomic factors in TBendemic areas and the fact that bacterial clearance requires many months of treatment have combined to prevent successful global TB control by antibiotics 8,9. Most of the drugs in the current tuberculosis regime result from research performed over 50 years ago 10. With the global emergence of multidrug-resistant tuberculosis (MDRTB) and extensively drug-resistant tuberculosis (XDRTB) there is an urgent need to develop new anti-mycobacterial agents. Acylhydrazone derivatives have been considered to be of interest in the development of novel compounds with anticonvulsant, antiinflammatory, antidepressant, analgesic, antiplatelet, antimalarial, antimicrobial, antimycobacterial, anticancer activities. isoniazid derivatives have been found to possess potential tuberculostatic activities 11.They are important compounds for drug design, as possible ligands for metal complexes, organocatalysis and also for the syntheses of heterocyclic compounds 12,13.In continuation of our effort to search for new anti-mycobacterial compounds, an acylhydrazoneobtained in the reaction of nicotinic hydrazide with 2,5- dimethoxylbenzaldehyde and its Mo(V), VO(II), Mn(II) Ni(II) and Cu(II) complexes weresynthesized, characterized and tested for their antimycobacteriumactivity. The presence of hydrazine pharmacophore in these compounds is expected for high antimycobacterium activity.
Experimental Chemicals
All the chemicals used were procured from Sigma–Aldrich used without further purification.
Instruments
Melting points were determined in open capillary tubes on Electrothermal capillary apparatus and are uncorrected.ESI-MS spectrum of the ligand was obtained using Agilent 6520 Q-TOF mass spectrometer.The spectrum was recorded with a scan range m/z 100–1000 for positive ions.The micro analysis of the hydrazone and the metal complexes were determined by using Vario EL CHNS analyzer. 1H, 13C and 2D NMR (COSY, HSQC and DEPT 135) spectra of the hydrazone were recorded using Bruker AMX 300 FT-NMR spectrometer.The chemical shifts were referenced to TMS (tetramethylsilane).The IR spectra of the hydrazone and the metal complexes were recorded on Perkin – Elmer RX-1 Fourier Transform Infrared Spectrometer using KBr pellets in the range of 4000 – 400 cm-1. The electronic data of the hydrazone and the metal complexes were obtained in methanol/DMSO by using Perkin Elmer Spectro UV-visible Double Beam UVD spectrometer in the range of 200 – 700 nm. The molar conductivities of the metal complexes at ambient temperature in DMF solution (10-3M) were measured using systronics – 304 conductivity meter. The magnetic measurements of paramagnetic metal complexes in powder form were measured at room temperature by using vibrating susceptibitymagnometer (PAR 155). TGA/DTAthermographs of some of the metal complexes were obtained by using thermogravimetric analyzer TGA Q500 V20.8 Build 34 model. The EPR spectra of the metal complexes at 77 K were recorded on a Varian E-112 spectrometer using TCNE as the standard. Powder diffraction data was recorded on a Bruker AXS D8 Advance diffractometer operating in the θ:θ mode, equipped with a secondary beam graphite monochromator, a Na(Tl)I scintillation counter, and pulse-height amplifier discrimination. CuKα radiation (λ = 1.5418 Å) was used. The X-ray generator and diffractometer settings were 40 kV, 40 mA, DS 0.5°, AS 0.5°, and RS 0.1 mm. Experimental conditions were step scan mode, with 5 < θ <105°, ∆θ = 0.02°, and t = 30 s step−1. Silicon NBS 640b was used as an external standard.
Synthesis (E)-N’-(2, 5-dimethoxylbenzylidene)nicotinohydrazide)[HL]
The synthetic method (Scheme 1) described by Cui et al.14 was modified and adopted. The nicotinic acid hydrazide (10 mmol, 1.37g) was dissolved in 20 ml of absolute ethanol by heating gently on water bath. The solution obtained was mixed with ethanolic solution of 2,5-dihydroxylbenzaldehyde (10mmol) in a round bottom flask. The mixture was stirred at 20oC for 6 h after which it was allowed to stand at ambient temperature for 24 h. The precipitate formed was filtered and washed several times with cold ethanol. The precipitate was recrystallized in mixture of methanol and chloroform (1:1). It was filtered off, washed with ether and dried in vacuum. The purity of the hydrazone was confirmed by TLC using methanol: chloroform (2:8) mixture. (2.42 g, 84.9%); mp: 190 – 192oC; Rf = 0.63 (CHCl3/CH3OH, 4:1, at RT.).1H-NMR (DMSO-d6) δ: 12.05(s, 1H, NH), 9.09 (s, , 1H, H(2)), 8.78 (s, 1H, H-C=N), 8.76 (dd, J1 = 1.08 Hz, J2 = 4.59 Hz, 1H, H(4)), 8.29 (dt, J1 = 7.92 Hz, 1H, H(5)), 7.61 (m, J1 = 4.89 Hz, J2 = 7.83 Hz, 1H, H(6)), 7.40 (d, J = 2.64 Hz, 1H, H(7)), 7.05 (d, 1H, H(8)), 7.01 (dd, 1H, H(9), J= 2.73 Hz), 3.77 (s, 3H of OCH3, H(10)), 3.74 (s, 3H of OCH3,H-C(11)), ppm. 13C-NMR (DMSO-d6) δ: 161.50 (CO), 153.27 (C(2)),152.39 (C(3)), 152.23 (C(4)), 148.57 (C(3)), 143.78 (HC=N), 135.36 (C(7)), 129.08 (C(8)), 123.53 (C(9), 122.68 (C(10)), 117.85 (C(11)), 113.46 (C(12)), 109.24 (C(13)), 56.24 (C(14)), 55.46 (C(15)) ppm. IR (KBr) cm-1: 3413 (enolisation OH), 3194 (NH), 1649 (C=O), 1596 (C=N), 1564 (N-N), 1367 (C-O), 1171 (C-N). MS (ESI+): in m/z: 286.2[M + H]+. Anal.calcd. for C15H15N3O3 (285.11): C, 63.15; H, 5.30; N, 14.73. Found: C, 63.37; H, 5.09; N, 14.52.
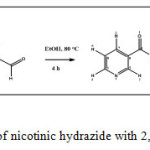 |
Scheme 1: Reaction of nicotinic hydrazide with 2,5-dimethoxylbenzaldehyde Click here to View scheme |
Synthesis of Mn(II) complex of (E)- N’-(2,5-dimethoxybenzylidene)nicotinohydrazide[Mn(HL)(CH3COO)2]
To a solution of the ligand (10 mmol ) in 15 mL of ethanol, Mn(lI) acetate (10 mmol) dissolved in 15 mL of ethanol was added followed by addition of two drops of triethylamine. The resulting solution was then refluxed for 5-6 h to obtain a golden yellow precipitate which was filtered, washed with cold ethanol followed by ether and dried over P4010in vacuo. Yield: 174 mg (60.63%). Elemental Anal. Found (Calcd.) (%): M, 11.57 (11.96); C, 50.42 (49.68); H, 4.54 (4.83); N, 8.54 (9.15). μ= 5.97 BM.
Synthesis of Mo(II) complex of (E)- N’-(2,5-dimethoxybenzylidene)nicotinohydrazide[Mo(HL)Cl3]
Solution of HL was prepared by dissolving 10 mmol of the ligand with 15 mL of ethanol in a double neck round bottomed flask. Then equivalent of 10 mmol of MoCl5 was weighed into a clean appendorf in a fume cupboard and transferred directly into the ethanolic solution of HL. The appendorf was rinsed into the solution with 5 mL of ethanol. The mixture was refluxed at 80oC for 5 h under nitrogen gas. The solute obtained was allowed to stay at room ambient temperature for 24 h, after which it was filtered, washed with cold ethanol and dried over P4O10in vacuo. Yield: 172 mg (56.39%). Elemental Anal.found (Calcd.) (%): Mo, 20.07 (19.64); C, 37.33 (36.87); H, 3.47 (3.30); N, 8.98 (8.60). m= not determined due to limitation on the number of samples allowed for analysis.
Synthesis of VO(II) complex of (E)- N’-(2,5-dimethoxybenzylidene)nicotinohydrazide[VO(HL)2]
Ethanolic solutionof (20 mmol in 15 mL) HL was mixed directly with ethanolic solution of VOCl2 (10 mmol in 15 mL) in a round bottomed flask, after which two drops of TEA was added. The mixed solution was then refluxed at 80oC for 6 h. The brown-black precipitate formed was filtered and washed with cold ethanol, followed by ether and dried over P4O10in vacuo. Yield: 119 mg (61.02%). Elemental Anal.found (Calcd.) (%): V, 8.08 (8.17); C, 57.67 (57.79); H, 5.09 (5.17); N, 12.98 (13.48). μ= 0 BM.
Synthesis of Cu(II) complex of (E)-N’-(2,5-dimethoxybenzylidene)nicotinohydrazide[Cu(HL)2]
Ethanolic solution of HL was prepared by dissolving 20 mmolin 20 mL of ethanol in a round-bottom flask. The solution was warmed to 50°C on a water bath for 40 min before adding ethanolic solution of (10 mmol in 10 mL) of CuSO4. The mixture was refluxed at 80°C for 4 h. The precipitate formed was filtered after cooling the solution in iced water, washed with cold ethanol and thereafter with ether. Then, the precipitate obtained was dried over P4O10 in vacuo. Yield: 138 mg (69.69%). Elemental Anal.found (Calcd.) (%): Cu, 9.52 (9.99); C, 56.78 (56.64); H, 4.98 (5.07); N, 12.76 (13.21). μ= 1.99 BM.
Synthesis of Ni(II) complex of (E)- N’-(2,5-dimethoxybenzylidene)nicotinohydrazide[Ni(HL)2]
10 mmol of NiCl2∙4H2O was dissolved in 10 mL of ethanol and was added to ethanolic solution of HL (20 mmol in 10 mL of ethanol) in a round bottom flask after which two drops of TEA was added. The solution was refluxed at 80°C for 6 h after which the precipitate formed was filtered, washed with 20 mL of ethanol and then with ether. The precipitate was dried over P4O10 in vacuo. Yield: 107 mg (54.31%). Elemental Anal.found (Calcd.) (%): M, 9.58 (9.30); C, 56.52 (57.08); H, 5.56 (5.11); N, 12.52 (13.31). μ= 3.22 BM.
AntimycobacterialActivity Studies MIC determination
The compounds were screened for antimycobacterial activities against isoniazid resistant strains of M. tuberculosis(ATCC 35822), using the micro plate Alamar Blue assay (MABA) 15,16.A serial dilution of the compounds was made directly on the plate. The final drug concentrations tested were 0.01-20.0 µg/mL. The plates were covered and sealed with parafilm and incubated at 37oC for five days. After this time, 25 mL of a freshly prepared 1:1 mixture of Alamar Blue reagent and 10% tween 80 was added to the plate and incubated for 24 h. A blue color in the well indicated no bacterial growth, and a pink color indicated growth. The MIC (minimal inhibition concentration) was defined as the lowest drug concentration, which prevented a color change from blue to pink.
Cytotoxicity studies
Cytotoxicity of HLand some of its synthesized metal complexes were determined with the Vero cell line ATCC CCL-81 using an MTS assay 17.
Results and Discussion
Mass spectrum of the Ligand (HL)
The ESI mass spectrum(Fig.S1) established the molecular mass of the ligand (HL) to be 285 g/mol. The mass spectrum showed the molecular ion peak at m/z 286.1 which corresponded to M+1 peak of the compound 18.
NMR spectral studies of(E)-N’-(2, 5-dimethoxybenzylidene)nicotinehydrazide)[HL]. 1H NMR
The 1H NMR spectrum of the ligand (HL) in DMSO-d6 is shown in Fig. 1. In the 1H NMR spectrum, N(2)-H(1) proton displayed a singlet signal that resonated downfield at 12.05 ppm. The two hydrogen atoms adjacent to N(1) atom in the pyridyl ring were assigned to a broad singlet at 9.09 ppm and a doublet signal at 8.76 ppm respectively. The lower δ values are as a result of the adjacent high electron withdrawing activity of the N(1) atom. The doublet of the triplet signal at 8.29 ppm was assigned to H(5) while a multiplet signal at 7.66 ppm was assigned to H(6) proton in the molecule. The proton attached to azomethine carbon H(3) appeared down field due to conjugative effect experienced from N(3)-N(2)-C=O(1) core of the hydrazone molecule.The doublet peak at 7.40 ppm was due to the H(7) in dimethoxylbenzene ring. The multiplet signal observed between 7.05- 6.92 ppm were attributed to the protons H(8) and H(9). The first methoxyl protons 3H(10) resonated at 3.77 ppm while the second methoxyl protons 3H(11) resonated at 3.64 ppm up-field as expected.
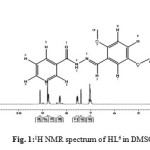 |
Figure 1: 1H NMR spectrum of HL6 in DMSO-d6at 300 MHz |
COSY spectrum
The1H NMR assignment was confirmed by COSY experiment which explained the multiplicity observed in the molecule by correlation contour19,20. COSY spectrum (Fig. 2) identified direct correlation between H(4) and H(6) proton and confirmed the two protons to be adjacent to each other. Thus H(4) appeared as a doublet signal. Also, correlation was observed between H(6) and H(5) and concurently between H(5) and H(2) in the spectrum. Thus, the multiplet signal at 7.66 ppm corresponded to H(6) while the doublet of triplet signal at 8.29 ppm assigned to H(5) fitted the coupling experienced by the proton. H(2) proton appeared as very broad peak due to slight coupling effect from H(5). In the dimethoxybenzene region, correlation was observed between H(7) and H(9), and therefore the doublet signal at 7.40 ppm was assigned to H(7) while H(8) and H(9) resonated as multiplet signal. Based on the correlation from COSY spectrum, the schematic diagram for 1H-1H coupling is shown in Fig. 3.
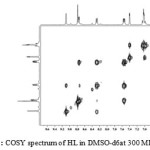 |
Figure 2: COSY spectrum of HL in DMSO-d6at 300 MHz Click here to View figure |
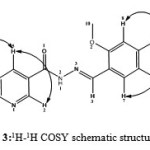 |
Figure 3: 1H-1H COSY schematic structure for HL |
13C NMR spectrum
The carbon skeleton of the molecule was identified by using the 13C NMR spectrum (Fig. 4). The carbonyl carbon C(1) resonated at δ value of 161.50 ppm downfield to TMS due to the conjugative effect of N(2) ̶N(3)=C(6) core of the molecule. The two carbon atoms of the methoxyl groups, C(2) and C(4) appeared downfield at 153.26 and 152.29 ppm respectively. This observation is due to high electron withdrawing activity of the methoxyl group 21. Also, the two carbon atoms adjacent to N(1) in the pyridyl ring, C(3) and C(5), were assigned to the signals at 152.39 and 148.57 ppm respectively. The downfield δ values are as a result of the de-shielding effect from adjacent N(1) atom which reduced the electron density around the carbon atoms. The other carbons in the pyridyl ring, C(7), C(8) and C(9) were assigned to signals at 135.36, 129.08 and 123.53 ppm respectively. The azomethine carbon atom C(6) was assigned to a signal at 143.78 ppm. The carbon experienced a high de-shielding effect from N(3)-N(2)-C(1)=O(1) core of the hydrazone. The four other carbons in the dimethoxybenzeneC(10), C(11), C(12) and C(13) were attributed to the signal at 122.68, 117.85, 113.46 and 109.24 ppm respectively. The methyl carbons, C(14) and C(15), in the methoxyl group resonated upfield due to the high shielding effect of the oxygen atom. They were assigned to the signals at 56.24 and 55.34 ppm respectively.
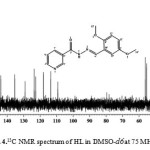 |
Figure 4: 13C NMR spectrum of HL in DMSO–d6at 75 MHz Click here to View figure |
HSQC spectrum
The HSQC spectrum (Fig. 5) confirmed the 13C NMR assignments. The spectrum did not show contour for the signals assigned to C(1), C(2), C(4), C(8) and C(10) carbon atoms. This shows that these carbon atoms were non-protonated as assigned.However, ten correlation contours were observed in the spectrum as expected. The following carbon atoms in the molecule: C(3), C(5), C(6), C(7), C(9), C(11), C(12) and C(13) showed correlation contour to confirm that they were protonated carbons. Their correlation contours corroborated with the 1H and 13C NMR assignments. Also, two correlation contours attributed to C(14) and C(15) appeared upfield as expected due to the two methyl groups in the molecule. Based on the spectrum, schematic diagram for 1H-13C correlation of the molecule is shown in Fig. 6.
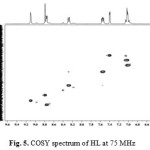 |
Figure 5: COSY spectrum of HL at 75 MHz |
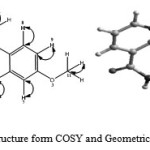 |
Figure 6: Schematic structure form COSY and Geometrical Optimization for HL |
Theoretical treatment of HL
Geometry optimization by using molecular mechanics (MM+) and the semi empirical calculations (PM3) at 25oC for the ligand (HL) corroborate the deduced structure of the ligand22, 23. The optimization stable energy of -325501.1 kJ/mol was obtained for HL ligand. The value established the stability of the compound. The3D contour plot to investigate the reactive sites of the molecule was generated (Fig. 7). The electron potential values of HOMO (eV= -8.9673) and LUMO, (eV= -0.7810). Theoretically calculated value indicated that oxygen and nitrogen atoms of HOMO type of the ligand would be preferable for coordination.
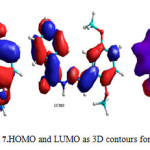 |
Figure 7: HOMO and LUMO as 3D contours for HL. |
Characterization of metal complexes Physical and analytical data
The physical and analytical data of the metal complexes of HL are listed in Table 1. The complexes displayed sharp melting points. They were sparingly soluble in methanol, chloroform and DMF but soluble in DMSO. The elemental analysis results of the complexes are in good agreement with the calculated values. All the complexes displayed low molar conductance values indicating that they are non-electrolyte. The magnetic susceptibility values for Mn(II), Cu(II) and Ni(II) complexes at room temperature were in agreement with the octahedral arrangement proposed for the complexes24.
Table 1: Analytical data of HLmetal complexes
|
Complex |
Colour
|
Melting pt. (oC) |
Found (Calc.), % |
LM |
μeff |
|||
|
M |
C |
H |
N |
S cm2 mol-1 |
μB |
|||
| [Mn(HL)(CH3COO)2] |
brown |
276 – 277 |
11.57 (11.96) |
50.42 (49.68) |
4.54 (4.83) |
8.54 (9.15) |
39 |
5.97 (5.92) |
| [Mo(HL)Cl3] |
Deep brown |
283 – 285 |
20.07 (19.64) |
37.33 (36.87) |
3.47 (3.30) |
8.98 (8.60) |
47 |
–
|
| [VO(HL)2] |
green |
291 – 293 |
8.08 (8.17) |
57.67 (57.79) |
5.09 (5.17) |
12.58 (13.48) |
42 |
–
|
| [Cu(HL)2]SO4 |
Golden brown |
290 – 292 |
9.52 (9.99) |
56.78 (56.64) |
4.98 (5.07) |
12.76 (13.21) |
51 |
1.98 (1.73) |
| [Ni(HL)2]H2O |
Greenish yellow |
278 – 280 |
9.58 (9.30) |
56.52 (57.08) |
5.56 (5.11) |
12.52 (13.31) |
56 |
3.22 (2.83)
|
L = C15H15N3O3
Infrared spectra
The vibrational bands of the ligand, HL, and its metal complexes, which we considered important for the determination of the mode of coordination in the complexes are shown in Table 2. Assignments of the bands were made by comparing the spectra of the metal complexes with that of the ligand. The selected infrared spectra of the metal complexes are shown in Fig. S2-S4. The interpretation was done by comparing the spectrum of the hydrazone with the spectra of the metal complexes 25. The broad bands observed in the region of 3194 – 3413 cm-1 attributed to hydrogen bonding that formed between the lattice water and the (N-H) group in the ligand appeared as a single broad peak in the metal complexes between except in Mn(II) complex where it appeared as a weak peak between 3183-3450 cm-1. This probably indicates the elimination of hydrogen bonding due to coordination of the azomethine group with the metal ions. Also, the azomethine peak (1596 cm-1) in the hydrazone had shifted to lower wavenumber in the metal complexes (1554 – 1582 cm-1) due to coordination through the lone pair of electrons on the nitrogen atom of the azomethine bond. This is further supported by a lower wavenumber shift of δ(N-N) bending band in the complexes (1455 – 1489 cm-1) which can be attributed to conjugate effect from the coordination of nitrogen atom of azomethine group. The presence of multiple peaks between 3183 – 3450 cm-1 in the spectrum of Mn(II) can be attributed to presence of H2O in the coordination sphere of the complex. However, the strong band at 1649 cm-1 attributed to δ(C=O) vibrational mode in the spectrum of the ligand appeared in the spectra of the metal complexes at lower frequency coupled with reduction in intensity in all the complexes except in Mn(II) complexes with higher wavenumber. This indicated coordination to central metal ions through carbonyl oxygen. The new bands observed in the complexes in the region 611-513 and 422-510 cm-1 were attributed to ν(M-N) and ν(M-O) bands respectively26.
Table 2: Infrared spectra assignments for metal complexes of HL
|
Ligands/ Complex |
ν(NH) cm-1 |
ν(C=O) cm-1 |
ν(C=N) cm-1 |
δ(N-N) cm-1 |
δ(C-O) cm-1 |
δ(C-N) cm-1 |
ν(M-O) cm-1 |
ν(M-N) cm-1 |
| HL | 3413 m3194 m | 1649 s | 1596 m | 1564 m | 1367m | 1171 m | – | – |
| [Mn(HL)(CH3COO)2] | 3450 w3183 w | 1662 m | 1560 w | 1480 m | 1350 w | 1114 w,b | 513 | 487 |
| [Mo(HL)Cl3 ] | 3414 m,b | 1633 w | 1561 m | 1479 s | 1393 s | 1186 m | 584 | 518 |
| [VO(HL)2] | 3422 b | 1604 w | 1554 w | 1494 w | 1283 m | 1118 m | 611 | 510 |
| [Cu(HL)2]SO4 | 3402 b | 1601 m | 1560 w | 1455 m | 1377 m | 1145 m | 518 | 422 |
| [Ni(HL)2]H2O | 3402 b | 1625 m,b | 1582 m | 1489 m | 1324 m | 1128 m | 546 | 481 |
Thermal analyses The thermal decomposition behaviour of Mn(II), Mo(V) and Cu(II) complexes under inert atmosphere at heating rate of 10oC min-1 are shown in Fig. 8-10. The Mn(II) complex was found to be thermally stable on heating from ambient temperature to 290oC. This observation suggested the absence of lattice and coordinated water in the complex. The thermogram for the Mn(II) complex shows that the complex decomposed in three steps. The decomposition occurred at 307, 382 and 466oC as indicated by DTA curve. The first decomposition step occurred within the temperature range of 291-310oC corresponding to the loss of two uncoordinated OCH3 group of the ligand. The decomposition resulted in 9% (Calcd. 9.9%) weight loss of the complex. Part of the ligand (C7H4N) decomposed in the second step of the decomposition which occurred within the temperature range of 310-393oC while the last part of the ligand (C6H5N2) decomposed in the third stage of the decomposition within the temperature range of 394-492oC. The two decomposition stages accounted for 34% (Calcd. 32%) and 36% (Calcd. 35%) weight loss respectively. Finaly, the residue, which is about 22% (Calcd. 20.5%) of the complex, formed between 472 and 700oC. Mo(V) complex was found to be thermally stable from ambient temperature to 200oC and thus suggested the absence of water molecules in the complex. However, part of the coordinated ligand (C13H9N3) decomposed between 200 and 525oC. The decomposition accounted for 50% (Calcd. 48%) weight loss. Further decomposition of the part of the ligand (CH3O) was observed between 621 and 670oC, which was about 9% (10%) weight loss. The residue formed at 672oC is believed to contain part of the ligand as further decomposition was expected above 700oC. Therefore, the complex did not decompose fully within the temperature range studied. The TGA/DTA curve for Cu(II) complex shows that the complex is thermally stable up to 210oC. The fact that there was no decomposition form the complex from ambient temperature to above 200oC confirmed the absence of water molecules in the complex. The complex lost 12% (Calcd 11.6%) weight within 211-232oC in the first step of decomposition as well as in the second step of decomposition. The weight loss corresponded to the loss of SO4, 12% (Calcd. 12.4%) in the complex. Part of the coordinated ligand (C23H18N6) decomposed within 232 – 400oC. This accounted for 6% (Calcd. 62%) weight loss in the complex. However, the residue which was assumed to be CuO formed above 400oC and accounted for 29% of the compound.
![Fig. 8. TGA/DTA spectra of [Mn(HL)(CH3COO)2]](http://www.orientjchem.org/wp-content/uploads/2016/03/Vol32_No1_Synt_Ogun_Fig8-150x150.jpg) |
Figure 8: TGA/DTA spectra of [Mn(HL)(CH3COO)2] |
![Fig. 9. TGA / DTA spectra of [Mo(HL)Cl3]](http://www.orientjchem.org/wp-content/uploads/2016/03/Vol32_No1_Synt_Ogun_Fig9-150x150.jpg) |
Figure 9: TGA / DTA spectra of [Mo(HL)Cl3] |
![Fig. 10.DTA/TGA spectrum of [Cu(HL)2]SO4](http://www.orientjchem.org/wp-content/uploads/2016/03/Vol32_No1_Synt_Ogun_Fig10-150x150.jpg) |
Figure 10: DTA/TGA spectrum of [Cu(HL)2]SO4 |
EPR spectra studies The EPR spectra of Cu(II) and Mo(V) complexes recorded in DMSO at 77 K are shown in Fig. 11-12. Cu(II) complex gave four resolved hyperfine lines both in the parallel and perpendicular regions with the hyperfine splitings constants of A‖ = 8 mT and A⊥ = 10 mT. However, giso was found to be 2.05012 with g⊥ of 2.1189 and g‖ of 2.6045. In this case, g‖ >g⊥> 2.0023, which is the characteristics of an octahedral geometry with dx2-y2 as the ground state 27,28. The geometrical parameter was calculated by using G = (g‖ – 2.0023)/(g⊥ – 2.0023) [27, ].The value of G determines the possibility of interaction in Cu(II) complexes. If the G > 4.4, the exchange interaction is negligible but if G < 4.4, then the exchange interaction is present and cannot be ignored as it is the case in the solid. The exchange interaction in the complex is 5.2, which is greater than 4.4. Therefore, the exchange of electrons between the metal ions and the ligand in the complex is negligible and thus, accounted for weak hyperfine splitting observed in the spectrum of the complex. The EPR spectrum of Mo(V) complex exhibited two hyperfine splitting with one of the splitting in the axial position. This observation was attributed to a distorted geometry of the complex. However, the spectrum displayed giso of 1.9457 with g‖ of 2.1965 and g⊥ of 1.9665. The splitting constant, A, was found to be 3 mT. Since g‖ >g⊥, the Mo(V) complex was considered to be a distorted octahedral complex 29.
![Fig. 11. EPR spectrum of [Cu(HL)2]SO4 in DMSO at 77 K](http://www.orientjchem.org/wp-content/uploads/2016/03/Vol32_No1_Synt_Ogun_Fig11-150x150.jpg) |
Figure 11: EPR spectrum of [Cu(HL)2]SO4 in DMSO at 77 K |
![Fig.12. EPR spectrum of [Mo(HL)Cl3] in DMSO at 77 K](http://www.orientjchem.org/wp-content/uploads/2016/03/Vol32_No1_Synt_Ogun_Fig12-150x150.jpg) |
Figure 12: EPR spectrum of [Mo(HL)Cl3] in DMSO at 77 K |
Powder X-ray diffraction studies
The crystal lattice parameters for Mo(V) complex were measured by using a Bruker AXS D8 Advance Diffractometer employing Cu-Kα radiation. The Mo(V) complex was scanned in the range 5 – 120° at wavelength 1.543 Å. The diffractogram and associated data depicted 2θ value for each peak, relative intensity and inter-planar spacing (d-values), Table 3. The diffractogram of the complex, Fig. 13, had several reflections with maxima at 2θ = 6.718° corresponding to d value of 13.146 Å. Some of the major peaks of relative intensity greater than 10% were indexed using a computer programme30-32. The indexing method yielded Miller indices (hkl), unit cell parameters and unit cell volume. The unit cell of Mo(V) complex yielded values of lattice constants, a = 20.108 Å, b = 26.293 Å, c = 18.672 Å and unit cell volume, V = 9870.822 Å3. In concurrence with these cell parameters, the condition such as a ≠ b ≠ c and α = β = γ = 90° required for sample to be orthorhombic were tested and found to be satisfactory. Hence, it can be concluded that Mo(V) complex has orthorhombic crystal system.
![Fig. 13. X-ray diffraction pattern for [Mo(HL)Cl3]](http://www.orientjchem.org/wp-content/uploads/2016/03/Vol32_No1_Synt_Ogun_Fig13-150x150.jpg) |
Figure 13: X-ray diffraction pattern for [Mo(HL)Cl3] |
Table 3: X-ray diffraction data for [Mo(HL)Cl3]
|
Peak |
2θ° |
dobs(Å) |
Intensity Count |
Intensity % |
1/d2 |
(1/d2)/Z |
h k l |
| 1 | 6.718 | 13.1464 |
1105 |
100 |
0.00579 |
1 |
1 0 0 |
| 2 | 8.788 | 10.0542 |
109 |
9.9 |
0.00989 |
2 |
1 1 0 |
| 3 | 10.536 | 8.3897 |
218 |
19.7 |
0.01421 |
1 |
0 1 0 |
| 4 | 11.283 | 7.83589 |
96.2 |
8.7 |
0.00786 |
2 |
1 1 0 |
| 5 | 13.173 | 6.71571 |
116 |
10.5 |
0.02217 |
2 |
2 0 0 |
| 6 | 13.857 | 6.38554 |
157 |
14.2 |
0.02452 |
3 |
1 1 1 |
| 7 | 15.896 | 5.57071 |
117 |
10.6 |
0.03222 |
3 |
1 1 1 |
| 8 | 16.235 | 5.45526 |
132 |
12 |
0.0336 |
3 |
1 1 1 |
| 9 | 16.919 | 5.23621 |
137 |
12.4 |
0.03647 |
4 |
2 0 0 |
| 10 | 17.681 | 5.01228 |
105 |
9.5 |
0.0398 |
4 |
2 1 0 |
| 11 | 19.456 | 4.5588 |
120 |
10.9 |
0.04812 |
5 |
2 1 0 |
| 12 | 20.111 | 4.41171 |
109 |
9.9 |
0.05138 |
5 |
2 1 0 |
| 13 | 21.889 | 4.05721 |
120 |
10.9 |
0.06075 |
6 |
2 1 1 |
| 14 | 24.063 | 3.69544 |
197 |
17.9 |
0.07323 |
7 |
2 1 1 |
| 15 | 25.299 | 3.51756 |
77.4 |
7 |
0.08182 |
8 |
2 2 0 |
| 16 | 27.017 | 3.29771 |
133 |
12.1 |
0.09195 |
9 |
3 0 0 |
| 17 | 28.439 | 3.1359 |
68.3 |
6.2 |
0.01017 |
1 |
0 0 1 |
| 18 | 28.982 | 3.07842 |
63 |
5.7 |
0.1055 |
10 |
3 1 0 |
| 19 | 29.811 | 2.99469 |
65.8 |
6 |
0.0124 |
1 |
0 1 0 |
| 20 | 30.769 | 2.90356 |
62.3 |
5.6 |
0.1186 |
11 |
3 1 1 |
| 21 | 32.921 | 2.71853 |
57.8 |
5.2 |
0.1353 |
13 |
3 2 2 |
Theoretical treatment of metal complexes
In addition to analytical and spectroscopic data obtained, the proposed structures of the complexes were computed using the program Hyper Chem-8 for the semi-empirical and molecular mechanics calculation33. The results of PM3 and ZNDO/1 methods of calculation in gas phase for heat of formation and binding energy for the metal complexes proposed the optimized geometries and energy of the complexes. All theoretically probable structures of metal complexes corroborated the results of analytical and spectroscopic structure. Thus, they are regarded as the most probable model building stable structures (Fig. 14).
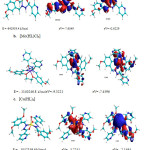 |
Figure 14: Deduced proposed structures for the metal complexes |
Antimycobacterial results
The in-vitro anti-M.tuberculosis properties of the synthesized hydrazones and the metal complexes(1–5) were evaluated against M. tuberculosis H37Rv (ATCC 35822)34and the results for the Minimum Inhibitory Concentrations (MICs) are reported in Table 4. The metal complexes tested displayed higher activity with MIC value of 0.74, 0.68 and 0.69 µg/mL for1, 2 and 3 respectively. 4 and 5 showed moderate activity with MIC value of 0.97 and 1.35 µg/mL accordingly. However, 1 emerged with the lowest toxicity value, IC50 of 9.70. 1, 2 and 3were found to be more active than the standard drug isoniazid and the ligand, HL. Based on the resultsobtained, 2 and 3were found to be more potent than 1 but they were more toxic than isoniazid (INH). 5was found to be the least active among the complexes with MIC value of 1.35 µg/mL.
Table 4: MIC (µg/mL), IC50 (µM) and SI (IC50/MIC) values of the metal complexes of HL.
|
Compound
|
MIC (µg/mL) |
IC50 x10 (µM) |
SI (IC50/MIC) |
|
|
MoHL (1) |
0.74 ± 0.125 |
0.97 |
1.31 |
|
|
VOHL(2) |
0.68 ± 0.473 |
1.19 |
1.75 |
|
|
MnHL (3) |
0.69 ± 0.243 |
1.28 |
1.53 |
|
|
NiHL (4) |
0.97 ± 0.174 |
1.49 |
1.53 |
|
|
CuHL (5) |
1.35 ± 0.053 |
1.57 |
1.16 |
|
|
HL |
0.77 ± 0.033 |
2.45 |
3.18 |
|
INH (Control) = 0.91 ± 0.133 (µg/mL)
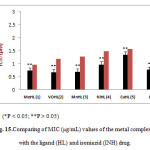 |
Figure 15: Comparing of MIC (μg/mL) values of the metal complexes with the ligand (HL) and isoniazid (INH) drug. |
Conclusions
In conclusion, (E)-N’-(2,5-dimethoxylbenzylidene)nicotinohydrazide (HL) and some of its transition metal complexes were successfully synthesized.The hydrazide is a derivative of isoniazid and therefore was expected to possess antitubercular activity. The structure of the hydrazone was successfully elucidated by using mass spectrum, CHN analysis, 1H, 13C and 2D NMR. All the efforts made to grow single crystals of the metal complexes did not yield positive results. However, the physical properties and the structures of the metal complexes were elucidated using different spectroscopic analysis supported by computational modeling. The information obtained was used to proposethe possible structures of the complexes. The in vitroantitubercularstudy confirmed the efficacies of the compounds. The metal complexes were found to be more active than isoniazid however, they were found to be more toxic against the Vero cell than isoniazid.
Acknowledgements
We gratefully acknowledge financial support of CISR and TWAS through TWAS-CSIR fellowship granted to carry out this work.We thank all the staff of SAIF Central Drug Research Institute, Lucknow, Indian Institute of Technology, Roorkee, and Indian Institute of Technology, Bombay, India for technical support. This research article was dedicated to the retirement of Prof. M.A. Mesubi.
References
- RamosD. F. ; TavaresL.; da SilvaP. E.;DellagostinO. A.Braz. J.Microbiol. 2014, 45,365.
CrossRef - GrahamR. S.;BrianD. R.;DouglasB. Y.Nature Reviews, Microbiology. 2003, 1, 97.
CrossRef - Phillip, O.; Graham,A. W. R.Nature Reviews, Microbiology. 2004, 2, 932.
- Lara,L. P. R.; Ocampo, V.J. of Opthalmic Inflammation and Infection.2013, 1,45.
- Smith, N.H.; Gordon, S.V.; Rua-Domenech, V.; Clifton-Hadley, R. S.Nature Reviews Microbiology.2006,4, 681.
CrossRef - Harper, C.Nat. Med.2009, 4, 312.
- World Health Organization (2010/2011) Tuberculosis Global Facts.
- Ginsberg, A.M.Tuberculosis. 2010,5,167.
- Jia, L.; Tomaszewski, J. E ,; Hanrahan, C,; Coward, L.; Noker, P,; Gorman, G,; Nikonenko, B,; Protopopova, M.British J. Pharmacol. 2005,144,87.
- Jindani, A,; Nunn, A.J,; Enarson, D. A.Lancet. 2004, 346,1251.
- Sacchettini, J.C,;Rubin, E.J,; Freundlich, J. S.Nat. Rev. Microbiol. 2008,6, 52.
CrossRef - Aboul-Fadl, T.; Abdel-Aziz, H.A.; Abdel-Hamid, M.K,; Elsaman, T,; Thanassi, J.Pucci. Molecules.2011, 16,7879.
- Nataliya, P.B,;Wim, D,;Vasiliy, A.B.ARKIVOC,2010,332.
- Cui, Y,; Dong, X,; Li, Y,; Li, Z,;Chen,W.Eur. J. Med. Chem.2012,58,231.
- Petra, L,;Edda, B,; Elke, G,; Jutta, W,; Helmut, H.Journal of Clinical Microbiology. 2003, 41,1068.
- Cory, A.H,;Owen, T.C,; Barltrop, J.A.Cancer Commun. 1999,3,212.
- Betanzos-Lara, S,;Gomez-Ruiz, C,; Barron-Sosa, L.R,; Gracia-Mora, I,; Flores-Alamo, M,;Barba-Behrens, N.J. Inorg. Biochem.2012, 144,93.
- Raghavendra,P.B,;Aishakhanam, H.P,; Ganesh, N.N,; Shrinath, S.M.Applied Organometallic Chemistry,2014, 28,724.
- Eugene, E. K,;Shaw, G.H.Eur. J. Org. Chem. 2008,2688.
- Pavia, D.L,;Lampman, G.M,; Kriz, G. S,; Vyvyan, J.A.Brooks Cole. 2008, 312.
- Jursic, B.S,;Douelle, F,; Bowdy, K,; Stevens, E.D.Tetrahedron Letters. 2002, 43,5365.
- Clark, T. A.; Hand Book of Computational Chemistry.John Wiley and Sons, New York,1985.
- Young, D. C. Computational Chemistry. John Wiley &Sons.2001.
CrossRef - Sankar, R,; Vijayalakshmi, S,; Rajagopan, S,;Kaliyappan, T.J. Appl. Polym. Sci. 117 2010,117,2152.
- Mustafa, I.M,;Hapipah, M.A,; Abdulla, M.A,; Robinson, T,; Ward, T.R.Polyhedron.2009,28,3998.
CrossRef - Al-Shaalan, N.Molecules.2011, 16,8645.
CrossRef - Valko, M,;Pelikan, S,; Biskupic, S,; Mazur, M.Chem. Papers, 1990,44,813.
- Hamed, M.Y,; Neilands, J.B.J. Inorg.Biochem.,1994,53,248.
CrossRef - Huang, T,; Haight Jun, J. P.J. Chem. Soc.1969, 17,986.
- Hippert, F,;Geissler, E,; Hodeau, J.L,; Lelièvre-Berna, E,;Regnard, J.R. Springer.2005,342.
- Hesse, R.ActaCrystallogr.1948,1, 200.
CrossRef - Lipson, H.ActaCrystallogr. 1949,2, 43.
CrossRef - Anderson, W.P,; P. Behm, P,;Glennon, T.M.J. Phys. Chem. 1997,11,1926.
- Vikramjeet, J,; Balasubramanian, N,;A. Munish, A,;Dharmarajan, S,; Perumal, Y,; De Clercq, E,; Pannecouque, C,; Balzarini, J.Med. Chem. Res. 2012,2,1952.

This work is licensed under a Creative Commons Attribution 4.0 International License.
![]()
A New Edition of Web of Science
Journal Impact Factor
2022: 0.5
Five Year: 0.8
Journal is Indexed in

Cabells Whitelist
![]()


